Domain-General Brain Regions Do Not Track Linguistic
Input as Closely as Language-Selective Regions
The MIT Faculty has made this article openly available.
Please share
how this access benefits you. Your story matters.
Citation
Blank, Idan A. and Evelina Fedorenko. “Domain-General Brain
Regions Do Not Track Linguistic Input as Closely as
Language-Selective Regions.” The Journal of Neuroscience 37, 41 (September
2017): 9999–10011 © 2017 The Authors
As Published
http://dx.doi.org/10.1523/JNEUROSCI.3642-16.2017
Publisher
Society for Neuroscience
Version
Final published version
Citable link
http://hdl.handle.net/1721.1/115271
Terms of Use
Attribution 4.0 International (CC BY 4.0)
Behavioral/Cognitive
Domain-General Brain Regions Do Not Track Linguistic
Input as Closely as Language-Selective Regions
X
Idan A. Blank
1and Evelina Fedorenko
2,31Department of Brain and Cognitive Sciences, Massachusetts Institute of Technology, Cambridge, Massachusetts 02139,2Department of Psychiatry,
Massachusetts General Hospital, Charlestown, Massachusetts 02129, and3Department of Psychiatry, Harvard Medical School, Boston, Massachusetts 02115
Language comprehension engages a cortical network of left frontal and temporal regions. Activity in this network is language-selective,
showing virtually no modulation by nonlinguistic tasks. In addition, language comprehension engages a second network consisting of
bilateral frontal, parietal, cingulate, and insular regions. Activity in this “multiple demand” (MD) network scales with comprehension
difficulty, but also with cognitive effort across a wide range of nonlinguistic tasks in a domain-general fashion. Given the functional
dissociation between the language and MD networks, their respective contributions to comprehension are likely distinct, yet such
differences remain elusive. Prior neuroimaging studies have suggested that activity in each network covaries with some linguistic
features that, behaviorally, influence on-line processing and comprehension. This sensitivity of the language and MD networks to local
input characteristics has often been interpreted, implicitly or explicitly, as evidence that both networks track linguistic input closely, and
in a manner consistent across individuals. Here, we used fMRI to directly test this assumption by comparing the BOLD signal time courses
in each network across different people (
n
⫽ 45, men and women) listening to the same story. Language network activity showed fewer
individual differences, indicative of closer input tracking, whereas MD network activity was more idiosyncratic and, moreover, showed
lower reliability within an individual across repetitions of a story. These findings constrain cognitive models of language comprehension
by suggesting a novel distinction between the processes implemented in the language and MD networks.
Key words: comprehension; functional localization; intersubject correlation; language network; multiple-demand network; naturalistic
cognition
Introduction
A key desideratum for a theory of language comprehension is to
specify the division of linguistic labor across distinct cognitive
mechanisms. Insofar as distinct mechanisms are implemented in
separable neural populations, such theories can draw inferences
from functional characterization of different brain
regions/net-works that engage in comprehension. Indeed, high-level
lan-Received Nov. 26, 2016; revised Aug. 16, 2017; accepted Aug. 18, 2017.
Author contributions: I.A.B. and E.F. designed research; I.A.B. and E.F. performed research; I.A.B. analyzed data; I.A.B. and E.F. wrote the paper.
This work was supported by a K99/R00 award HD 057522 from NICHD and a grant from the Simons Foundation to the Simons Center for the Social Brain at MIT to E.F., and partially supported by the Office of the Director of National Intelligence (ODNI), Intelligence Advanced Research Projects Activity (IARPA), via Air Force Research Laboratory (AFRL), under contract FA8650-14-C-7358. The views and conclusions contained herein are those of the authors and should not be interpreted as necessarily representing the official policies or endorsements, either expressed or implied, of ODNI, IARPA, AFRL, or the U.S. Government. The U.S. Government is authorized to reproduce and
distrib-ute reprints for Governmental purposes notwithstanding any copyright annotation thereon. We thank the Athinoula A. Martinos Imaging Center at the McGovern Institute for Brain Research at MIT and its support team (Steve Shan-non, Atsushi Takahashi, and Sheeba Arnold); MIT affiliates Alexander Paunov and Zach Mineroff for their help with data collection, Anastasia Vishnevetsky for her help with constructing the stories, and Nancy Kanwisher and Ted Gibson for recording the stories; Uri Hasson (Princeton University) for providing the materials for the second repli-cation; and Nancy Kanwisher, Ted Gibson, John Duncan (Medical Research Council, Cognition and Brain Science Unit), and the audience at the CUNY Sentence Processing conference in San Diego for comments on earlier versions of this work.
The authors declare no competing financial interests.
Significance Statement
Language comprehension recruits both language-specific mechanisms and domain-general mechanisms that are engaged in
many cognitive processes. In the human cortex, language-selective mechanisms are implemented in the left-lateralized “core
language network”, whereas domain-general mechanisms are implemented in the bilateral “multiple demand” (MD) network.
Here, we report the first direct comparison of the respective contributions of these networks to naturalistic story comprehension.
Using a novel combination of neuroimaging approaches we find that MD regions track stories less closely than language regions.
This finding constrains the possible contributions of the MD network to comprehension, contrasts with accounts positing that this
network has continuous access to linguistic input, and suggests a new typology of comprehension processes based on their extent
of input tracking.
guage processing recruits several large-scale networks, each
exhibiting a unique functional profile. Among these, the “core
language network”, consisting of left frontal and temporal
re-gions, is most critical to language processing. This network is
robustly engaged in comprehension (
Binder et al., 1997
;
Jung-Beeman, 2005
;
Menenti et al., 2011
) across languages (
Sebastian
et al., 2011
), presentation modalities (
Chee et al., 1999
;
Buch-weitz et al., 2009
;
Braze et al., 2011
;
Vagharchakian et al., 2012
),
and developmental experiences (
Neville et al., 1998
;
Bedny et al.,
2011
). It exhibits sensitivity to both lexical semantics and
syntac-tic structure (
Keller et al., 2001
;
Fedorenko et al., 2012b
;
Bautista
and Wilson, 2016
;
Blank et al., 2016
) but, critically, shows
virtu-ally no engagement in nonlinguistic tasks (
Fedorenko et al., 2011
;
Fedorenko and Varley, 2016
).
In addition, language processing engages the “multiple
de-mand” (MD) network (
Duncan, 2010
) consisting of bilateral
frontal, parietal, cingulate, and insular regions. This network
exhibits sensitivity to comprehension difficulty, increasing its
ac-tivity in response to, e.g., temporary ambiguity, infrequent
con-structions, and nonlocal syntactic dependencies (
Fedorenko,
2014
). However, its activity similarly scales with cognitive effort
across a wide range of nonlinguistic tasks (
Duncan and Owen,
2000
;
Miller and Cohen, 2001
;
Braver et al., 2003
;
Cole and
Sch-neider, 2007
;
Fedorenko et al., 2013
;
Hugdahl et al., 2015
).
The strikingly different functional profiles of the
domain-specific language network and the domain-general MD network
extend beyond task-based neuroimaging studies. First, in
rela-tively unconstrained neuroimaging paradigms of “naturalistic
cognition”, these networks show independent activity
fluctua-tions (
Blank et al., 2014
). Second, neuropsychological studies
have reported that damage to language regions leads to language
impairments (
Broca, 1861/2006
;
Dax, 1863
;
Wernicke, 1874/
1969
;
Geschwind, 1970
;
Bates et al., 2003
) but leaves other
high-level cognitive functions largely intact (
Fedorenko and Varley,
2016
); whereas damage to MD regions impairs executive
func-tions (
Luria, 1966/2012
;
Fuster, 1989
;
Woolgar et al., 2010
),
but sometimes leaves comprehension mostly unimpaired (
Fe-dorenko, 2014
). Importantly, this double-dissociation need not
imply that language processing is encapsulated from
domain-general processes (
Geranmayeh et al., 2014
;
Fedorenko, 2014
).
Indeed, executive control and language appear to be causally
linked (
Wiener et al., 2004
;
Fridriksson et al., 2006
;
Amici et al.,
2007
;
Murray, 2012
). However, their distinct functional profiles,
distinct patterns of activity fluctuations during naturalistic
cog-nition, and distinct patterns of deficits following damage
estab-lish that these two networks contribute to comprehension via
fundamentally distinct computations.
Nonetheless, the precise nature of these respective
contribu-tions remains elusive, as most prior neuroimaging studies have
not been couched in terms of the distinction between the
lan-guage and MD networks. Insofar as available accounts do draw
this distinction, however implicitly, they suggest that the two
networks differ in either the input features that they process or
their operations on such input (
Novick et al., 2005
;
Thompson-Schill et al., 2005
;
Hickok and Poeppel, 2007
;
Friederici, 2012
;
Hagoort, 2013
). Critically, the various postulated roles of each
network have been mostly tested via linguistic manipulations
that, behaviorally, affect online processing and comprehension
(
Preston, 1935
;
Forster and Chambers, 1973
;
Frazier, 1987
;
Mac-Donald et al., 1994
;
Grodner and Gibson, 2005
;
Levy, 2008
).
Thus, prior suggestions that language/MD network activity
cova-ries with continuously unfolding linguistic features (e.g.,
proper-ties of words, changes in parsing difficulty) have been articulated
in the psycholinguistic terminology of ongoing, incremental
pro-cesses that rely on tight tracking of the input. However, the
as-sumption that both networks closely track linguistic input,
crucial for understanding the contributions of these networks to
comprehension, has not been empirically evaluated.
Here, we use fMRI to directly test this assumption: we
mea-sure activity fluctuations in language and MD regions during
story comprehension and estimate how tightly coupled those
fluctuations are to the story. Current views predict that both
networks would exhibit equally close tracking of stories.
Alterna-tively, linguistic tracking might be weaker in one network
com-pared with the other, thus importantly constraining the space of
operations that the former network could support. Such a finding
would indicate that the contributions of the two networks to
comprehension differ more fundamentally than is presently
assumed.
Materials and Methods
Below, we outline and motivate our methodology. Specifically, we de-scribe a novel combination of existing approaches that is designed to meet four criteria: (1) high functional resolution for identifying brain networks, (2) a naturalistic paradigm suitable for studying comprehen-sion in all its richness (cf. traditional task-based paradigms), (3) direct comparisons of brain networks for valid statistical inferences, and (4) re-producibility of results.
To evaluate the extent of input tracking in the language and MD net-works, we first must define the cortical regions-of-interest that constitute these networks. In doing so, we must account for the fact that individual brains are highly variable in the mapping of high-level cognitive func-tions onto macro-anatomical landmarks. This variability, evident in the temporal cortex (Jones and Powell, 1970;Gloor, 1997;Wise et al., 2001) and especially in the frontal cortex (Amunts et al., 1999;Tomaiuolo et al., 1999) where language and MD regions lie side-by-side (Fedorenko et al., 2012a), renders anatomical localization precarious (Juch et al., 2005;
Poldrack, 2006;Fischl et al., 2008;Frost and Goebel, 2012;Tahmasebi et al., 2012). For these reasons, we similarly cannot rely on functional localization at the level of an entire sample using group-based analy-ses (Saxe et al., 2006;Fedorenko and Kanwisher, 2009). Therefore, we functionally localize language and MD regions individually in each participant. This approach allows us to pool data from the same functional regions across participants even when those regions do not align well spatially.
Following functional localization, we evaluate how closely the lan-guage and MD networks track linguistic input during naturalistic com-prehension. Our interest in naturalistic input is threefold: first, some brain regions respond more reliably to richly structured natural input compared with experimentally controlled input (Hasson et al., 2010). Second, unlike traditional experimental paradigms which often require participants to perform artificial tasks on linguistic materials, naturalistic comprehension more closely approximates language processing “in the wild”, where the primary goal is the extraction of meaning. Therefore, this “task free” paradigm provides an important complementary ap-proach for evaluating the contributions of the MD regions to compre-hension, especially given that these regions operate in a task-dependent manner (Miller and Cohen, 2001;Sreenivasan et al., 2014;D’Esposito and Postle, 2015). And third, naturalistic comprehension requires all aspects of the input to be combined into a single rich representation, unlike experimental stimuli and tasks that focus on particular linguistic features and have lower ecological validity. Therefore, we record the BOLD signal fluctuations of language and MD regions while partici-pants passively listen to stories, where the only explicit task is to compre-hend the story’s content.
Correspondence should be addressed to Dr. Idan A. Blank, 43 Vassar Street, Room 46-3037c, Cambridge, MA 02139. E-mail:[email protected].
DOI:10.1523/JNEUROSCI.3642-16.2017
FollowingLerner et al. (2011), we reasoned that if a given network closely tracked the story such that fluctuations in its BOLD signal were stimulus-locked, then its signal time course would be similar across par-ticipants and would thus show a high intersubject correlation (ISC; Has-son et al., 2004). Hence, we use ISC as an index of input tracking. Critically, ISC is a “model-free” measure: instead of testing how well signal time courses can be explained by certain pre-specified, hypothesis-driven predictors, each participant’s empirical data serve as the model compared against the data from the other participants.
This data-driven method has been successfully used to demonstrate that broad cortical swathes do track stories to significant extents (Wilson et al., 2008;Lerner et al., 2011;Honey et al., 2012;Regev et al., 2013;
Silbert et al., 2014;Schma¨lzle et al., 2015), proposing a neural correlate of “shared understanding” across individuals (Hasson et al., 2012). Never-theless, prior studies have measured ISCs in a voxelwise fashion, whereby brains were first anatomically aligned and, then, each stereotaxic location served in turn as a basis for comparing signal time courses across partic-ipants. Relating the resulting cortical topography of ISCs to the topogra-phy of known functional brain networks could then proceed only through “reverse inference” (Poldrack, 2006). Moreover, voxelwise com-parisons across participants rely on the invalid assumption that a given anatomical location has a common function across individuals. To relax this assumption, here we augment the ISC framework by comparing signal time courses across regions that are functionally defined. This allows us to focus on, and compare between, language and MD regions, such that we can tie our findings to the wealth of prior literature charac-terizing the response profiles of those networks.
In addition, we augment the statistical approach adopted in early stud-ies of ISCs by directly testing the correlations in the language network against those in the MD network. Such an explicit comparison between networks allows for more nuanced inferences compared with those li-censed when each network is separately tested against a null baseline and differences across networks are indirectly inferred (cf.Lerner et al., 2011;
Nieuwenhuis et al., 2011).
Finally, we demonstrate that our results are reproducible, by reporting two replications of our main, story comprehension experiment: the first is a direct replication with a subset of the original stories; the second is a conceptual replication with a new, even more naturalistic story.
Experimental design and statistical analysis
Our overall design and analytical strategy were as follows: participant-specific regions responding more strongly to reading sentences compared with lists of nonwords were defined as regions-of-interest comprising the language network. Similarly, regions responding more strongly during a
hard version versus an easy version of a spatial working-memory task were defined as regions-of-interest comprising the MD network. Whereas the precise anatomical locations of these regions were allowed to vary across participants, their overall topography was constrained by independently de-rived criteria to establish functional correspondence across brain regions of different participants.
Time courses of activity in these regions were measured while partic-ipants listened to stories. For each region in each network, our critical variable was the ISC in activity between each participant and the rest of the sample. The group-averaged ISC in each region was tested for signif-icance via a permutation test of the time-series data. For our critical analysis, all individual ISC values were modeled together using a linear, mixed-effects regression with brain region as a within-subject, fixed fac-tor and both participant and sfac-tory as random facfac-tors. The regional fixed effects were then averaged within each network and compared across networks. Full details regarding the Materials and Methods are provided in the next subsections.
Participants
Fifty participants between the ages of 18 and 47, recruited from the MIT student body and the surrounding community, were paid for participa-tion. Two participants were removed from the analysis due to poor qual-ity of the functional localizer data and three more were removed due to poor segmentation of their anatomical scan. Of the remaining 45 partic-ipants (30 females; mean age 23.5, SD 4.8), 19 were tested in the main experiment, 13 in the first replication and 19 in the second replication (the first and third groups were partially overlapping). In addition, 15 of these participants were tested in a control experiment (described be-low): these included eight participants from the main experiment, two from the first replication, and one who participated in both the main experiment and the second replication. Forty-one participants were right-handed (based on the Edinburgh Handedness Inventory;Oldfield, 1971), and the remaining four handed participants had a left-lateralized language network (for motivation to include left-handers in cognitive neuroscience research, seeWillems et al., 2014). All partici-pants were native English speakers and gave informed consent in accor-dance with the requirements of MIT’s Committee on the Use of Humans as Experimental Subjects.
Stimuli and procedure
Language localizer task. The task used to localize the language network is
described in detail inFedorenko et al. (2010). Briefly, we used a reading task contrasting sentences and lists of unconnected, pronounceable non-words (Fig. 1a) in a standard, deterministic blocked design with a coun-Figure 1. Experimental tasks. a, The reading task used to localize language regions, based on the critical contrast sentences⬎ nonwords. b, The spatial working-memory task used to localize MD regions, based on the critical contrast hard⬎ easy. c, An excerpt from a story used in the main comprehension experiment. Linguistic phenomena that increase processing difficulty and have been shown to recruit the MD network, but are naturally infrequent, were edited into the text. These include nonlocal syntactic dependencies (green; words in this relation have subscripts with the same number but different letters); temporary ambiguity (purple), where a likely initial parse is later revealed to be wrong; and low-frequency words (brown).
terbalanced order across runs (for timing parameters, seeTable 1). Stimuli were presented one word/nonword at a time. For the first 10 participants only, each trial ended with a memory probe and they had to indicate, via a button press, whether or not that probe had appeared in the preceding sequence of words/nonwords. The remaining participants instead read the materials passively (we included a button-pressing task at the end of each trial, to help participants remain alert). Importantly, this localizer has been shown to generalize across task manipulations: the sentences⬎ nonwords contrast robustly activates the frontotemporal language network regardless of the task (Fedorenko et al., 2010). The regions identified by this contrast engage in a broad range of linguistic processes including (but not limited to) lexico-semantic processes and combinatorial syntactic and semantic processes (Fedorenko et al., 2012b,2016,2017;Blank et al., 2016). Moreover, this localizer identifies the same regions that are localized with a broader contrast, between recorded natural speech and its acoustically-degraded ver-sion (Scott et al., 2017).
MD localizer task. Regions of the MD network were localized using a
spatial working-memory task contrasting a hard version with an easy version (Fig. 1b). On each trial (8 s), participants saw a 3⫻ 4 grid and
kept track of eight (hard version) or four (easy version) randomly gen-erated locations that were sequentially flashed two at a time or one at a time, respectively (1 s per flash). Then, participants indicated their mem-ory for these locations in a two-alternative, forced-choice (2AFC) para-digm via a button press (3 s total). Feedback was immediately provided upon choice (or lack thereof; 250 ms). Hard and easy conditions were presented in a standard blocked design (4 trials in a 32 s block, 6 blocks per condition per run) with a counterbalanced order across runs. Each run included 4 blocks of fixation (16 s each) and lasted a total of 448 s. Thirty-nine participants completed one to two runs of the localizer. The remaining six participants either provided poor-quality data (5 partici-pants) or were not run on this task (1 participant). For this latter group, MD regions were localized with data from the language localizer task, using the (reverse) nonwords⬎ sentences contrast. Both the hard ⬎ easy contrast and the nonwords⬎ sentences contrast have been previously demonstrated to robustly and reliably identify the MD network ( Fe-dorenko et al., 2013; these participants did not differ from the rest of the sample in the dependent variables;Table 2).
Story comprehension task. In the main experiment, each subject
lis-tened to one to four stories (1 story: n⫽ 7; 2: n ⫽ 3; 3: n ⫽ 2; 4: n ⫽ 7; duration: 270 –364 s) over scanner-safe headphones (Sensimetrics).
Sto-ries were constructed based on publicly available fairy tales and short stories:
(1) “The Legend of the Bradford Boar” (by E. H. Hopkinson; uned-ited version: www.make4fun.com/stories/British-short-story/ 3917-The-Legend-of-the-Bradford-Boar-by-E-H-Hopkinson) (2) “Aqua; or the Water Baby” (by Kate Douglas Wiggin; unedited
version:fullreads.com/literature/aqua-or-the-water-baby/) (3) “The King of the Birds” (by The Brothers Grimm; unedited
version: www.apples4theteacher.com/holidays/bird-day/short-stories/the-king-of-the-birds.html)
(4) “Elvis Died at the Florida Barber College” (by Roger Dean Kiser; unedited version:www.eastoftheweb.com/short-stories/UBooks/ ElvDie.shtml).
These stories were edited to include a variety of linguistic phenomena that have been shown to increase local processing difficulty in numerous prior behavioral sentence processing studies and which recruit the MD network (Fig. 1c). As a result of these edits, comprehension difficulty was
robustly modulated across each story. Namely, self-paced reading times in a separate sample (n⫽ 181 participants) were reliably predicted by measures of linguistic complexity (Shain et al., 2016). Moreover, in these stories, some measures of complexity influenced on-line behavior more robustly than in studies that have used unedited texts, plausibly because the relevant linguistic phenomena do not naturally occur with suffi-ciently high-frequency (Collins, 1996;Roland et al., 2006,2007;Ferreira, 2008;Futrell et al., 2015). Further, even though the stories in the current experiments were presented via the auditory rather than visual modality, we still expect them to successfully modulate processing difficulty be-cause reading-time effects generalize to on-line listening (Ferreira et al., 1996;Waters and Caplan, 2001;Table 3for evidence that our neuroim-aging results generalize to visual story presentation).
In the first replication, participants listened to stories 1 and 3 used in the main experiment (these data were originally collected for the purpose of a separate experiment; participants also listened to the other 2 stories, but performed a simultaneous, unrelated task during those trials). In the second replication, participants listened to an autobiographical story (“Pie-man,” told by Jim O’Grady) recorded at a live storytelling event (“The Moth” storytelling event, NYC). This story (duration: 420 s) did not undergo linguistic editing and was thus even more naturalistic than the previous stories. Each story started and ended with 16 s of fixation (and music, for the Pie-man story) that were not analyzed.
To test the reliability of signal time courses in the language and MD networks, participants in the control experiment listened to the same stories twice, either within the same scanning session (⬃1 h apart, n ⫽ 7) or in separate sessions (6.5–21.5 months apart, n⫽ 8; 4 participants listened to the same story twice within the same session and then, once more, in a separate session).
After each story, participants answered 6 –12 comprehension ques-tions that required attentive listening (i.e., could not have been answered correctly based on common knowledge). For the main experiment and the first replication, participants answered 2AFC questions via a button press while in the scanner. For the second replication, participants filled in a 4AFC questionnaire after the scanning session. For eight partici-pants, answers to these questions were not recorded due to equipment malfunction (these participants did not differ from the rest of the sample in the dependent variables;Table 2). The remaining 37 participants dem-onstrated good comprehension, with a negatively skewed accuracy dis-tribution (mode⫽ 100%, median ⫽ 87.5%, semi-interquartile range ⫽ 12.85%).
Data acquisition and preprocessing
Data acquisition. Whole-brain structural and functional data were
col-lected on a whole-body 3 Tesla Siemens Trio scanner with a 32-channel head coil at the Athinoula A. Martinos Imaging Center at the McGovern Institute for Brain Research at MIT. T1-weighted structural images were collected in 176 axial slices with 1 mm isotropic voxels [repetition time (TR)⫽ 2530 ms; echo time (TE) ⫽ 3.48 ms]. Functional, blood oxygen-ation level-dependent (BOLD) data were acquired using an EPI sequence with a 90° flip angle and using GRAPPA with an acceleration factor of 2;
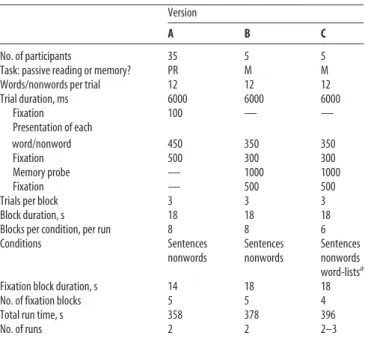
Table 1. Timing parameters for the different versions of the language localizer task
Version
A B C
No. of participants 35 5 5
Task: passive reading or memory? PR M M
Words/nonwords per trial 12 12 12
Trial duration, ms 6000 6000 6000 Fixation 100 — — Presentation of each word/nonword 450 350 350 Fixation 500 300 300 Memory probe — 1000 1000 Fixation — 500 500
Trials per block 3 3 3
Block duration, s 18 18 18
Blocks per condition, per run 8 8 6
Conditions Sentences Sentences Sentences nonwords nonwords nonwords word-listsa
Fixation block duration, s 14 18 18
No. of fixation blocks 5 5 4
Total run time, s 358 378 396
No. of runs 2 2 2–3
the following parameters were used: thirty-one 4-mm-thick near-axial slices acquired in an interleaved order (with 10% distance factor), with an in-plane resolution of 2.1⫻ 2.1 mm, FoV in the phase encoding (A ⬎⬎ P) direction 200 mm and matrix size 96⫻ 96 mm, TR ⫽ 2000 ms and TE ⫽ 30 ms. The first 10 s of each run were excluded to allow for steady-state magnetization.
Spatial preprocessing. Data preprocessing was performed with SPM5 (using
default parameters, unless specified otherwise; RRID:SCR_007037) and sup-porting, custom scripts in MATLAB (RRID:SCR_001622). Preprocess-ing of anatomical data included normalization into a common space [Montreal Neurological Institute (MNI) template], resampling into 2 mm isotropic voxels, and segmentation into probabilistic maps of the gray matter, white matter (WM), and cerebro-spinal fluid (CSF). Pre-processing of functional data included motion correction (realignment to the mean image using second-degree b-spline interpolation), normal-ization (estimated for the mean image using trilinear interpolation), re-sampling into 2 mm isotropic voxels, smoothing with a 4 mm FWHM Gaussian filter and high-pass filtering at 200 s.
Temporal preprocessing. Additional preprocessing of data from the
story comprehension runs was performed using the CONN toolbox (Whitfield-Gabrieli and Nieto-Castanon, 2012; RRID:SCR_009550) with default parameters, unless specified otherwise. Five temporal prin-cipal components of the BOLD signal time courses extracted from the WM were regressed out of each voxel’s time course; signal originating in the CSF was similarly regressed out. Six principal components of the six motion parameters estimated during offline motion correction were also regressed out, as well as their first time derivative. Next, the residual signal was bandpass filtered (0.008 – 0.09 Hz) to preserve only low-frequency signal fluctuations (Cordes et al., 2001). This filtering did not influence the results reported below.
Participant-specific functional localization of language and
MD networks
Modeling localizer data. For each localizer task, a standard mass
univari-ate analysis was performed in SPM5 whereby a general linear model estimated the effect size of each condition in each experimental run. These effects were each modeled with a boxcar function (representing entire blocks) convolved with the canonical hemodynamic response function. The model also included first-order temporal derivatives of these effects, as well as nuisance regressors representing entire experi-mental runs and offline-estimated motion parameters. The obtained weights were then used to compute the functional contrast of interest: for the language localizer, sentences⬎ nonwords, and for the MD localizer, hard⬎ easy (or nonwords ⬎ sentences for 6 participants; see Stimuli and Procedure).
Defining fROIs. Language and MD functional regions-of-interest
(fROIs) were defined individually for each participant based on func-tional contrast maps from the localizer experiments (a toolbox for this procedure is available online; RRID:SCR_009644). These maps were first restricted to include only gray matter voxels by excluding voxels that were more likely to belong to either the WM or the CSF based on SPM’s probabilistic segmentation of the participant’s struc-tural data.
Then, fROIs in the language network were defined using group-constrained, participant-specific localization (Fedorenko et al., 2010). For each participant, the map of the sentences⬎ nonwords contrast was intersected with binary masks that constrained the participant-specific language network to fall within areas where activations for this contrast are relatively likely across the population. These masks are based on a group-level representation of the contrast obtained from a previous sam-ple. We used eight such masks in the left-hemisphere, including regions in the posterior, mid-posterior, mid-anterior, and anterior temporal lobe, as well as in the middle frontal gyrus, the inferior frontal gyrus, and its orbital part (Fig. 2a). These masks were mirror-projected onto the
right-hemisphere to create eight homologous masks (the masks cover significant parts of the cortex, so their mirrored version is likely to encompass the right-hemisphere homolog of the left-hemisphere lan-guage network, despite possible hemispheric asymmetries in their precise locations). In each of the resulting 16 masks, a participant-specific language fROI was defined as the top 10% of voxels with the highest contrast values. This top n% approach ensures that fROIs can be defined in every participant and that their sizes are the same across participants, allowing for generalizable results (Nieto-Castan˜o´n and Fedorenko, 2012).
fROIs in the MD network were similarly defined (using the “top 10%” approach) based on the hard⬎ easy contrast in the spatial working-memory task. Here, instead of using binary masks based on group-level functional data, we used anatomical masks (Tzourio-Mazoyer et al., 2002;Fedorenko et al., 2013;Blank et al., 2014). Nine masks were used in each hemisphere, including regions in the middle frontal gyrus and its orbital part, the opercular part of the inferior frontal gyrus, the precentral gyrus, the superior and inferior parts of the parietal lobe, the insula, the supplementary motor area, and the cingulate cortex (Fig. 2b). Based on
prior findings (Dosenbach et al., 2006,2007;Nomura et al., 2010;Power et al., 2011;Mantini et al., 2013), we grouped the resulting fROIs into two functionally distinct subnetworks: frontoparietal (first 6 masks) and
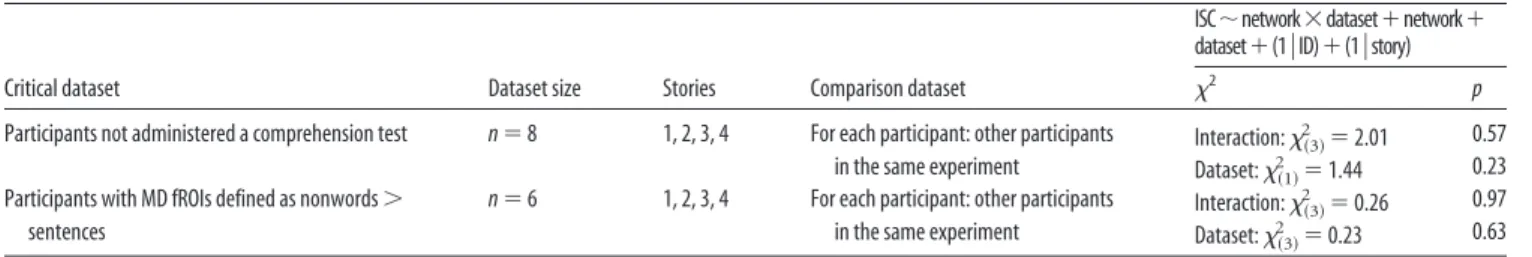
Table 2. Testing whether ISCs are modulated by task characteristicsa,b
Critical dataset Dataset size Stories Comparison dataset
ISC⬃network⫻dataset⫹network⫹ dataset⫹(1兩ID)⫹(1兩story)
2 p
Participants not administered a comprehension test n⫽ 8 1, 2, 3, 4 For each participant: other participants in the same experiment
Interaction:2共3兲⫽ 2.01 0.57 Dataset:2共1兲⫽ 1.44 0.23 Participants with MD fROIs defined as nonwords⬎
sentences
n⫽ 6 1, 2, 3, 4 For each participant: other participants in the same experiment
Interaction:2共3兲⫽ 0.26 0.97 Dataset:2共3兲⫽ 0.23 0.63
Significant results are presented in bold.
aForTables 2– 4, p values are FDR-corrected for multiple comparisons. All results are from linear, mixed-effect regressions with models as specified (ID⫽ participant).
bFor each participant in the critical dataset, ISCs were computed relative to average data across participants in the respective comparison dataset. ISCs were then averaged across fROIs within each network.
Table 3. Visual presentation of the storiesa,b(word-by-word, timing matched to
the auditory version)
DV⬃ fROI ⫹ (1 兩 ID) ⫹ (1 兩 Story) DV: intersubject correlations DV: within-subject correlations ISC Z p WSC Z p Language LH 0.24 7.57 <10ⴚ12 0.20 5.58 <10ⴚ6 Language RH 0.20 6.16 <10ⴚ8 0.17 4.77 <10ⴚ5 MDfp 0.15 4.77 <10ⴚ5 0.10 3.01 0.006 MDco 0.08 2.58 0.015 0.03 0.85 0.58 Language LH⬎ RH 2.59 0.016 1.13 0.42 Language LH⬎ MDfp 5.87 <10ⴚ7 4.12 0.0001 Language LH⬎ MDco 8.39 ⬇0 6.05 <10ⴚ7 Language RH⬎ MDfp 3.04 0.004 2.88 0.008 Language RH⬎ MDco 5.99 <10ⴚ8 5.01 <10ⴚ5 MDfp⬎ MDco 3.70 0.0005 2.78 0.01
Significant results are presented in bold.
aBased on stories 2 and 4. Sample size: n⫽ 11 for ISCs, n ⫽ 7 for WSCs.
bUnlike the main experiment, here we test ISCs and WSCs against 0 (using a Z statistic) and not against an empirical null distribution. These two tests provide similar results.
cingulo-opercular (last 3 masks). Similar re-sults were obtained when fROIs were instead grouped by hemisphere. (We note that func-tional masks derived for the MD network based on 197 participants significantly over-lapped with the anatomical masks; we chose to use the anatomical masks to maintain compa-rability between our functional data and data from previous studies that have used these masks.)
The resulting fROIs showed some negligible overlap across the two networks (similar to
Blank et al., 2014). Specifically, language fROIs had a median overlap of 0 voxels with the MD network (mean: 2.7%, range: 0 –37.5%, inter-quartile range: 2.1%). MD fROIs also had a median overlap of 0 voxels with the language network (mean: 2.8%, range: 0 – 47%, inter-quartile range: 1.6%). Therefore, any voxels that were identified by both the language and the MD localizer were excluded from analysis (this procedure did not influence the results). The resulting fROIs had an average size of 247⫾ 77 voxels in the language network, and 212⫾ 111 voxels in the MD network.
Critical analysis: ISCs
Computing ISCs. For each participant and
fROI, BOLD signal time courses recorded dur-ing story comprehension were extracted from each voxel beginning 6 s following the onset of the story (to exclude an initial rise in the hemo-dynamic response relative to fixation, which could increase ISCs). These time courses were first temporally z-scored in each voxel and then averaged across voxels. Next, to ensure that the resulting signal time course reflected the track-ing of high-level ltrack-inguistic information and not low-level sensory information, we removed from it any variance that was explained by ac-tivity in the auditory cortex. Specifically, the
signal was regressed against signals extracted from anatomically defined regions around the posteromedial and anterolateral sections of Heschl’s gyrus bilaterally (Tzourio-Mazoyer et al., 2002; this regression did not affect the pattern of results reported here;Table 4). Finally, for each story, participant, and fROI we computed an ISC value, namely, Pearson’s moment correlation coefficient between the residual time course and the corresponding average residual time course across the remaining participants (Lerner et al., 2011). ISCs were Fisher-transformed before statistical testing to improve normality (Silver and Dunlap, 1987).
Statistical testing. In each fROI, ISCs were then tested for significance
against an empirical null distribution based on 1000 simulated signal time courses that were generated by phase-randomization of the original data (Theiler et al., 1992). Namely, we generated null distributions for individual participants, fit each distribution with a Gaussian, and analyt-ically combined the resulting parameters across participants. The true ISCs, also averaged across participants, were then z-scored relative to these empirical parameters and converted to one-tailed p values.
Critically, ISCs were compared across networks using a linear, mixed-effects regression (Barr et al., 2013) implemented with the “lme4” pack-age in R (RRID:SCR_000432). In each experiment, ISCs across all fROIs, participants, and stories were modeled with a fixed effect of fROI and random intercepts for participant and story. The fixed-effect estimates were combined across fROIs within each functional network [left-hemisphere (LH) language, right-[left-hemisphere (RH) language, frontopa-rietal MD, and cingulo-opercular MD] and were pairwise compared with each other using the “multcomp” package in R. Hypotheses were two-tailed for the first experiment and one-two-tailed for the replications and control analyses. In each experiment, p values are reported following false
discovery rate (FDR) correction for multiple comparisons (Benjamini and Yekutieli, 2001). In addition to the z-scores and p values from these pairwise comparisons, we also report the corresponding effect sizes (Co-hen’s d) for the mean difference in ISCs across network pairs, averaged first across stories, then across fROIs, and finally across participants.
Figure 2. Functional regions of the language and MD networks. a, LH language regions in three individual participants are shown in dark red. These regions were localized with a reading task (Fig. 1a). These regions were constrained to fall within eight
broad areas where activations for this task are common across the population, shown in light pink. These areas were defined based on group-level data from a previous sample (Fedorenko et al., 2010). b, LH MD regions of the same three participants are shown in dark blue. These regions were localized with a spatial working-memory task (Fig. 1b). These regions were constrained to fall within
nine broad areas where activations for this localizer are common across the population, shown in light blue. These areas were anatomically defined (Fedorenko et al., 2013). Apparent overlap between language and MD fROIs is illusory and due to projection onto the cortical surface.
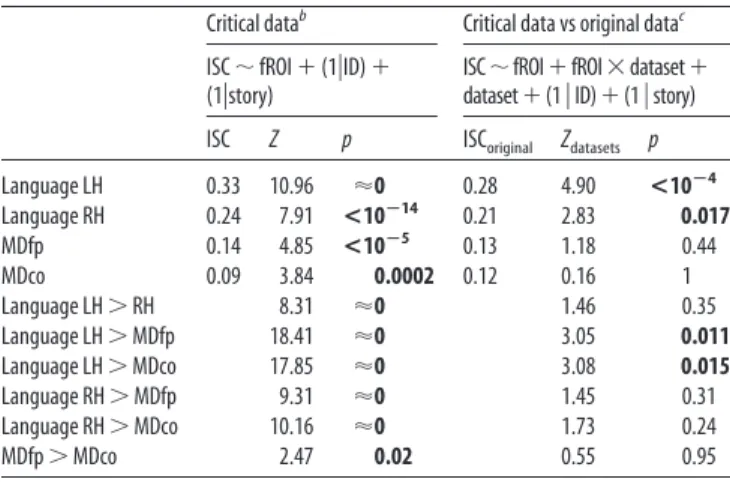
Table 4. ISCs computed without regressing out time-series from the auditory cortexa
Critical datab Critical data vs original datac
ISC⬃ fROI ⫹ (1兩ID) ⫹ (1兩story)
ISC⬃fROI⫹fROI⫻dataset⫹ dataset⫹(1 兩 ID)⫹(1 兩 story) ISC Z p ISCoriginal Zdatasets p
Language LH 0.33 10.96 ⬇0 0.28 4.90 <10ⴚ4 Language RH 0.24 7.91 <10ⴚ14 0.21 2.83 0.017 MDfp 0.14 4.85 <10ⴚ5 0.13 1.18 0.44 MDco 0.09 3.84 0.0002 0.12 0.16 1 Language LH⬎ RH 8.31 ⬇0 1.46 0.35 Language LH⬎ MDfp 18.41 ⬇0 3.05 0.011 Language LH⬎ MDco 17.85 ⬇0 3.08 0.015 Language RH⬎ MDfp 9.31 ⬇0 1.45 0.31 Language RH⬎ MDco 10.16 ⬇0 1.73 0.24 MDfp⬎ MDco 2.47 0.02 0.55 0.95
Significant results are presented in bold.
aData from the main experiment, based on stories 1– 4. Sample size: n⫽ 19 participants.
bUnlike the main experiment, here we test ISCs against zero (using a Z statistic) and not against an empirical null distribution. These two tests provide similar results.
For all findings based on linear, mixed-effects regression analyses, similar results were obtained when data for each participant were first averaged across fROIs within each network and pairwise network com-parisons (across participants) were then tested using exact permutation tests (Gill, 2007). Therefore, our results are independent of assumptions regarding data normality.
Control analysis: within-subject correlations
Computing WSCs. For each participant who listened to the same story on
two separate trials, we computed a within-subject correlation (WSC) value for each fROI by correlating the signal time courses across the two trials. The resulting correlations were Fisher-transformed.
Note that unlike ISCs, which compare the signal from one participant to an average signal across all other participants, WSCs compare two single-trial signals. Consequently, the two measures are not directly com-parable: despite the fact that WSCs are not contaminated by interindi-vidual variability and should thus be higher than ISCs, ISCs will de facto be higher because signal averaging removes a lot of noise from the data. To make ISCs comparable to WSCs we therefore computed “pairwise ISCs”: for each participant and fROI, we correlated the signal time course separately with each of the corresponding, individual signal time courses of the other participants, Fisher-transformed the resulting correlation values, and averaged them.
Statistical tests. Before these analyses, we tested whether WSCs in the
within-session and across-session datasets differed from each other. To this end, we performed a linear, mixed-effects regression analysis that
modeled individual WSCs for all fROIs, participants, and stories with a fixed effect of the interaction between fROI and dataset, random intercepts for participant and story, and a random slope for dataset varying by participant (this model was chosen because a fuller model failed to converge). Pairwise contrasts tested whether WSCs in each network were stronger across sessions than within a session. These two groups did not differ from each other in their network WSCs. Therefore, these two sets of data were modeled together in the critical analyses: here, WSCs were compared across networks using the same model that was used to test ISCs, modeling individual WSCs for all fROIs, participants, and stories.
A similar approach was used for comparing WSCs to pairwise-ISCs. Here, contrasts tested whether pairwise differences between networks observed with WSCs were distinct from those observed with ISCs.
Results
Correlations of network activity across individuals listening
to the same story
ISC data are presented in
Figure 3
. Across stories in the main
experiment, the LH language network showed the highest ISCs
(across fROIs, the mean
 estimate for Fisher-transformed ISCs:
r
⫽ 0.280), stronger than ISCs in the RH language network (r ⫽
0.210; Cohen’s d
⫽ 0.73, z ⫽ 6.25, p ⬍ 10
⫺9), the frontoparietal
MD (MDfp) network (r
⫽ 0.136; d ⫽ 1.07, z ⫽ 14.12, p ⬇ 0) and
the cingulo-opercular MD (MDco) network (r
⫽ 0.117; d ⫽ 1.32,
Figure 3. ISCs during story comprehension in the language and MD networks. a, ISC (Fisher-transformed) for each brain region. Black dots are individual data points. Thick, colored horizontal lines show the average ISCs across participants. Gray rectangles show 95% confidence intervals of these average ISCs (empirically derived using 1000 permutations). Colored vertical curves show Gaussian fits to empirical null distributions against which average ISCs can be tested (ns, nonsignificant results at a threshold of 0.05; FDR-corrected). Regions are grouped into four functional networks, indicated by color. Across experiments, a replicable pattern emerges where ISCs are stronger in language regions (red) than in MD regions (blue). b, Mean ISCs within each functional network, same conventions as in a. Black, horizontal lines connect pairs of networks that significantly differ from one another (in each pair, the left ISC is greater than the right ISC and all ISCs that are further to the right). L, left; R, right; post, posterior; temp, temporal; mid, middle; ant, anterior; inf, inferior; orb, orbital; op, opercular; sup, superior; supp, supplementary.
z
⫽ 13.51, p ⬇ 0). The RH language network, in turn, showed
higher ISCs than both the MDfp network (d
⫽ 1.07, z ⫽ 7.27, p ⬍
10
⫺11) and the MDco network (d
⫽ 1.04, z ⫽ 7.72, p ⬍ 10
⫺13).
The two MD networks did not differ from each other (d
⫽ 0.18,
z
⫽ 1.70, p ⫽ 0.218). The difference between the LH language
network and the two MD networks was also observed for each
story separately.
In both replication experiments, we again found that ISCs in
the LH language network (replication 1: r
⫽ 0.252; replication 2:
r
⫽ 0.303) were stronger than in the RH language network (r ⫽
0.172, d
⫽ 0.90, z ⫽ 5.62, p ⬍ 10
⫺7; r
⫽ 0.250, d ⫽ 0.77, z ⫽ 3.35,
p
⫽ 0.001), the MDfp network (r ⫽ 0.147, d ⫽ 1.06, z ⫽ 8.09, p ⬍
10
⫺15; r
⫽ 0.160, d ⫽ 1.29, z ⫽ 9.95, p ⬇ 0) and the MDco
network (r
⫽ 0.114, d ⫽ 1.33, z ⫽ 8.95, p ⬇ 0; r ⫽ 0.163, d ⫽ 1.34,
z
⫽ 8.20, p ⬍ 10
⫺15). ISCs in the RH language network were
somewhat stronger than ISCs in the MDfp network (d
⫽ 0.46, z ⫽
1.93, p
⫽ 0.066; d ⫽ 0.82, z ⫽ 6.28, p ⬍ 10
⫺9) and stronger than
ISCs in the MDco network (d
⫽ 0.70, z ⫽ 3.74, p ⬍ 0.001; d ⫽
0.83, z
⫽ 5.10, p ⬍ 10
⫺7). The two latter networks reliably
dif-fered from each other only in the first replication (d
⫽ 0.53, z ⫽
2.28, p
⬍ 0.033).
Across these three experiments, we find that signals in the
language and MD networks differ in their ISCs and, thus, in the
percentage of variance they share across individuals. To further
interpret these findings we computed an “upper bound” on ISCs,
reflecting the highest values that could be expected in our
mea-surements; namely, we computed ISCs in low-level auditory
re-gions (see Materials and Methods) that track sensory input very
closely (
Lerner et al., 2011
). Combining data across experiments,
these auditory ISCs are estimated at r
⫽ 0.450. Thus, signals in the
LH language network (r
⫽ 0.287 across experiments) share
40.8% of this “maximum shareable variance” across individuals;
signals in the RH language network (r
⫽ 0.216) share 23%,
whereas signals in the MDfp network (r
⫽ 0.153) and MDco
network (r
⫽ 0.134) share only 11.6% and 8.8%, respectively.
Importantly, however, almost all ISCs, even those in MD regions,
are significantly greater than expected by chance (
Fig. 3
).
There-fore, domain-general MD regions track stories to a nontrivial
extent despite doing so substantially and reliably more weakly
than the language regions.
Is it possible that other subregions of the MD network, not
identified by our localizer, track the stories more strongly? To test
this possibility, we computed traditional, voxelwise ISCs (based
on anatomical alignment of individual brains) and identified,
within each mask of the MD network, the voxels that showed the
highest ISCs during one story. These voxels served as “alternative
fROIs”, and we estimated the strength of their ISCs using
inde-pendent data from another story. The resulting ISCs were even
weaker than those reported above (
Table 5
), and the same finding
held in “alternative fROIs” identified in the language network.
Critically, compared with the original fROIs, the alternative
fROIs responded less robustly to the language and MD localizers
(responses in the original fROIs were obtained from runs of the
localizers that were held-out during fROI definition). For
in-stance, alternative fROIs in the MDco network did not respond
differentially to the hard and easy versions of the spatial working
memory task; and alternative fROIs in the RH language network
did not respond differentially to sentences and nonwords (
Table
5
). These decreased functional signatures are likely caused by
interindividual variability in the precise anatomical locations of
the language and MD regions, such that a given voxel might
belong to a certain network in some participants but not others.
Therefore, with no means for establishing functional (rather than
anatomical) correspondence across individual brains in areas
that lie outside of our localizer-defined fROIs, we do not find any
MD regions that track linguistic input as closely as the language
network.
Correlations of network activity within individuals listening
to a story twice
The relatively low ISCs in MD regions could be interpreted in two
ways: on the one hand, MD regions might closely track linguistic
input but do so in an idiosyncratic fashion across individuals. For
example, if different people find different sections of the story
difficult to comprehend, they might each recruit their MD
net-work at respectively different times. In this case, MD activity time
courses would be stimulus-locked for each individual but would
differ across individuals. Alternatively, activity in the MD regions
might not be closely linked to the linguistic input at all. These two
interpretations can be distinguished by correlating signal time
Table 5. Functional profiles of “alternative” fROIs defined as the top 10% of voxels in each mask showing the highest ISCs (computed based on anatomical alignment across individual brains)a
Within dataset (new/original): DV⬃ fROI ⫹ (1兩ID) Across datasets: DV⬃ fROI ⫹ dataset ⫹ fROI ⫻ dataset ⫹ (1 ⫹ dataset兩ID)
Language LH Language RH MDfp MDco
DV New Original New Original New Original New Original
ISCb 0.22 0.28 0.18 0.21 0.11 0.15 0.09 0.11
Z⫽ 16.2 Z⫽ 13.4 Z⫽ 13.5 Z⫽ 10.1 Z⫽ 8.2 Z⫽ 7.6 Z⫽ 6.3 Z⫽ 5.0
p⬇ 0 p⬇ 0 p⬇ 0 p⬇ 0 p < 10ⴚ15 p < 10ⴚ13 p < 10ⴚ9 <10ⴚ5 Z⫽ 4.78, p < 10ⴚ5 Z⫽ 2.38, p ⴝ 0.03 Z⫽ 4.05, p < 10ⴚ4 Z⫽ 1.5, p ⫽ 0.21
Language localizerc: sentences⬎ nonwords 0.17 0.63 ⫺0.01 0.21 ⫺0.24 ⫺0.38 ⫺0.03 ⫺0.13
Z⫽ 4.4 Z⫽ 12.0 Z⫽ ⫺0.4 Z⫽ 4.0 Z⫽ ⫺7.0 Z⫽ ⫺7.7 Z⫽ ⫺0.7 Z⫽ ⫺2.4
p < 10ⴚ4 p⬇ 0 p⫽ 1 pⴝ 10ⴚ4 p < 10ⴚ11 p < 10ⴚ12 p⫽ 0.77 pⴝ 0.03
Z⫽ 11.9, p ⬇ 0 Z⫽ 5.9, p < 10ⴚ7 Z⫽ ⫺3.9, p < 10ⴚ3 Z⫽ ⫺2.3, p ⴝ 0.04
MD localizerc: hard⬎ easy ⫺0.03 ⫺0.12 0.06 0.01 0.37 0.95 0.04 0.52
Z⫽ ⫺0.4 Z⫽ ⫺1.4 Z⫽ 0.8 Z⫽ 0.09 Z⫽ 5.22 Z⫽ 10.5 Z⫽ 0.5 Z⫽ 5.3 p⫽ 1 p⫽ 0.48 p⫽ 0.97 p⫽ 1 p < 10ⴚ6 p⬇ 0 p⫽ 1 p < 10ⴚ6
Z⫽ 1.4, p ⫽ 0.42 Z⫽ 0.7, p ⫽ 0.94 Z⫽ 8.4, p ⬇ 0 Z⫽ 5.9, p < 10ⴚ7 aWe compare the data of the first replication reported in the manuscript (“original” dataset) to data derived from the “alternative” fROIs (“new” dataset). The first replication was chosen because it had a sufficient number of participants (n⫽ 13) who listened to the same two stories, namely, 1 and 3.
bFor the new dataset, one story was used for defining “alternative” fROIs, and the held out story was used to estimate their ISCs independently of the criteria used to define them. The process was then repeated with the two stories in reversed roles, and the resulting two estimates for each fROI were averaged.
cFor language (MD) fROIs in the original dataset, one run of the language (MD) localizer was used to define fROIs and the second run was then used to estimate their responses independently of the criteria used to define them. The process was then repeated with the two runs in reversed roles, and the resulting two estimates for each fROI were averaged.
courses within a given individual who is listening to the same
story twice (
Hasson et al., 2009
): if MD activity tracks the story in
an idiosyncratic manner across individuals, then it should still be
similar across two instances of the same story within an
individ-ual; however, if MD activity does not track the story closely, then
it should not exhibit reliable time courses even within an
individual.
Therefore, we scanned several participants listening to stories
twice and computed WSCs. In line with our findings above,
WSCs in the LH language network (r
⫽ 0.160) were stronger than
in the RH language network (r
⫽ 0.129; d ⫽ 0.33, z ⫽ 3.66, p ⬍
0.001), the MDfp network (r
⫽ 0.083; d ⫽ 0.83, z ⫽ 8.5, p ⬇ 0)
and the MDco network (r
⫽ 0.097; d ⫽ 1.25, z ⫽ 6.05, p ⬍ 10
⫺8).
WSCs in the RH language network were stronger than those in
the MDfp network (d
⫽ 0.30, z ⫽ 4.48, p ⬍ 10
⫺4) and the MDco
network (d
⫽ 0.32, z ⫽ 2.66, p ⫽ 0.012), but the two latter
networks did not differ (
Fig. 4
a). When we directly contrasted
WSCs to ISCs (the latter recomputed as “pairwise-ISCs” to be
directly comparable to the former; see Materials and Methods)
we found that the patterns of results were indistinguishable
across the two measures (for all comparisons between WSCs and
pairwise-ISCs, p
⬎ 0.52;
Fig. 4
b). Therefore, even across story
repetitions within a given individual, MD network activity is
sig-nificantly less reliable than language network activity, indicating
that the former, but not the latter, tracks linguistic input closely.
Discussion
During story comprehension, a robust and reliable difference
in neural activity distinguished between the language network
and the MD network. The language network, particularly in
the LH, showed relatively little individual variation in activity
(high ISCs) due to close tracking of the story (high WSCs). In
contrast, MD network activity was more idiosyncratic across
individuals (low ISCs), showing weaker tracking of the story
(low WSCs). These findings suggest a novel typology of mental
processes contributing to language comprehension: it is not
only a question of which linguistic features are tracked by
different mechanisms, but of whether, and to what extent,
these mechanisms track linguistic input. Thus, some processes
implemented in the language network are stimulus-related
and consistent across individuals; other processes, implemented in
the MD network, are less tightly coupled to the input and appear
more idiosyncratic.
This distinction importantly constrains cognitive models of
lan-guage processing: it narrows the space of domain-general processes
that can be implemented in the MD network to those processes that
do not require continuous access to the input. This conclusion is
inconsistent with the assumption of close input tracking, which
im-plicitly underlies existing interpretations of MD network activity in
task-based neuroimaging studies of comprehension. It might also be
inconsistent with current psycholinguistic models describing how
domain-general working-memory resources contribute to
incre-mental, moment-to-moment language processing along with
language-specific knowledge (for review, see
Levy, 2013
).
Characterizing the respective contributions of the language
and MD networks to comprehension was methodologically
pos-sible due to the localization of these networks using functional
contrasts, individually for each participant. This method
ac-counts for interindividual variability in the mapping of function
onto cortical anatomy (
Jones and Powell, 1970
;
Gloor, 1997
;
Amunts et al., 1999
;
Tomaiuolo et al., 1999
;
Wise et al., 2001
),
conferring high functional resolution (
Nieto-Castan
˜o´n and
Fe-dorenko, 2012
) that is unobtainable if ROIs are instead defined
based on anatomical criteria or group analyses of functional data
(
Juch et al., 2005
;
Poldrack, 2006
;
Saxe et al., 2006
;
Fischl et al.,
2008
;
Frost and Goebel, 2012
;
Tahmasebi et al., 2012
).
Conse-quently, single-participant functional localization provides a
principled way of relating our ISC data to known functional
di-visions in the cortex. This method thus augments the ISC
ap-proach, allowing us to provide a novel key characterization of the
functional topography of ISCs based on the distinction between
the language and MD networks.
Within this topography, the role of MD regions in language
comprehension is particularly interesting. Whereas task-based
studies have demonstrated that MD regions scale their activity
with increasing comprehension difficulty in numerous contexts
(
Stromswold et al., 1996
;
Stowe et al., 1998
;
Caplan et al., 1999
;
Fiez et al., 1999
;
Fiebach et al., 2002
;
Chee et al., 2003
;
Constable
et al., 2004
;
Rodd et al., 2005
;
Chen et al., 2006
;
Nakic et al., 2006
;
Nieuwland et al., 2007
;
Novais-Santos et al., 2007
;
Hauk et al.,
2008
;
Yarkoni et al., 2008
;
Carreiras et al., 2009
;
January et al.,
2009
;
Ye and Zhou, 2009
;
Peelle et al., 2010
;
Barde et al., 2012
;
McMillan et al., 2012
,
2013
), we demonstrate that they track
natural language relatively weakly. Our results suggest that
activ-ity fluctuations in the MD network do not reflect momentary
fluctuations in comprehension difficulty, e.g., as related to the
frequency of words, or the syntactic complexity at each position
in the sentence. One might suggest that the domain-general
op-erations of the MD network are only recruited when linguistic
labor is sufficiently high and burdens the language network
be-yond its capacities; as long as this threshold is not crossed, the
executive resources that aid in comprehension might be
domain-specific and implemented within the language network.
How-ever, we find such an interpretation unlikely, given that our story
stimuli contain frequent occurrences of challenging linguistic
phenomena that are relatively uncommon in natural texts and,
therefore, are expected to significantly challenge comprehension
processes (
Shain et al., 2016
).
Our finding that the MD network tracks linguistic stimuli
relatively weakly also appears to disagree with prior evidence that
this network tracks other naturalistic stimuli that are not purely
linguistic. Specifically, in audiovisual movies, experiential
fea-tures like “suspense” modulate MD activity similarly across
indi-viduals (
Naci et al., 2014
), possibly by influencing the frequency
of attentional disengagement (
Nakano et al., 2013
). Does the
domain-general MD network play a different role in language
comprehension compared with its role in processing other
natu-ralistic stimuli?
Perhaps MD regions are biased toward visual information (or
audio-visual integration) in movies compared with the auditory
information of stories (
Michalka et al., 2015
;
Braga et al., 2017
;
Noyce et al., 2017
). Alternatively, MD regions may track both
movies and stories, but fluctuations in MD activity during movie
viewing could simply be slower, and thus more reliably
mea-Figure 4. WSCs (left) and pairwise-ISCs (right) during story comprehension in the language and MD networks. Same conventions as inFigure 3.