Publisher’s version / Version de l'éditeur:
Journal of Power Sources, 196, 15, pp. 6168-6176, 2011-03-22
READ THESE TERMS AND CONDITIONS CAREFULLY BEFORE USING THIS WEBSITE. https://nrc-publications.canada.ca/eng/copyright
Vous avez des questions? Nous pouvons vous aider. Pour communiquer directement avec un auteur, consultez la
première page de la revue dans laquelle son article a été publié afin de trouver ses coordonnées. Si vous n’arrivez pas à les repérer, communiquez avec nous à PublicationsArchive-ArchivesPublications@nrc-cnrc.gc.ca.
Questions? Contact the NRC Publications Archive team at
PublicationsArchive-ArchivesPublications@nrc-cnrc.gc.ca. If you wish to email the authors directly, please see the first page of the publication for their contact information.
This publication could be one of several versions: author’s original, accepted manuscript or the publisher’s version. / La version de cette publication peut être l’une des suivantes : la version prépublication de l’auteur, la version acceptée du manuscrit ou la version de l’éditeur.
For the publisher’s version, please access the DOI link below./ Pour consulter la version de l’éditeur, utilisez le lien DOI ci-dessous.
https://doi.org/10.1016/j.jpowsour.2011.03.024
Access and use of this website and the material on it are subject to the Terms and Conditions set forth at
Low equivalent weight short-side-chain perfluorosulfonic acid
ionomers in fuel cell cathode catalyst layers
Lei, Chao; Bessarabov, Dmitri; Ye, Siyu; Xie, Zhong; Holdcroft, Steven;
Navessin, Titichai
https://publications-cnrc.canada.ca/fra/droits
L’accès à ce site Web et l’utilisation de son contenu sont assujettis aux conditions présentées dans le site LISEZ CES CONDITIONS ATTENTIVEMENT AVANT D’UTILISER CE SITE WEB.
NRC Publications Record / Notice d'Archives des publications de CNRC:
https://nrc-publications.canada.ca/eng/view/object/?id=5f48731f-a5d8-4734-b637-8f903366b0f6
https://publications-cnrc.canada.ca/fra/voir/objet/?id=5f48731f-a5d8-4734-b637-8f903366b0f6
This article appeared in a journal published by Elsevier. The attached
copy is furnished to the author for internal non-commercial research
and education use, including for instruction at the authors institution
and sharing with colleagues.
Other uses, including reproduction and distribution, or selling or
licensing copies, or posting to personal, institutional or third party
websites are prohibited.
In most cases authors are permitted to post their version of the
article (e.g. in Word or Tex form) to their personal website or
institutional repository. Authors requiring further information
regarding Elsevier’s archiving and manuscript policies are
encouraged to visit:
Contents lists available atScienceDirect
Journal of Power Sources
j o u r n a l h o m e p a g e :w w w . e l s e v i e r . c o m / l o c a t e / j p o w s o u r
Low equivalent weight short-side-chain perfluorosulfonic acid ionomers in fuel
cell cathode catalyst layers
Chao Lei
a, Dmitri Bessarabov
b,c, Siyu Ye
d, Zhong Xie
a, Steven Holdcroft
a,e, Titichai Navessin
a,∗aInstitute for Fuel Cell Innovation, National Research Council Canada, Vancouver, BC, Canada V6T 1W5 bAutomotive Fuel Cell Cooperation, Burnaby, BC, Canada V5J 5J8
cNorth-West University (NWU) and Council for Scientific and Industrial Research (CSIR), South African Hydrogen and Fuel Cell Program (DST-HySA),
HySA Infrastructure Center of Competence, South Africa
dBallard Power Systems, Burnaby, BC, Canada V5J 5J8
eDepartment of Chemistry, Simon Fraser University, Burnaby, BC, Canada V5A 1S6
a r t i c l e
i n f o
Article history:
Received 26 January 2011
Received in revised form 10 March 2011 Accepted 12 March 2011
Available online 22 March 2011 Keywords: Fuel cell Catalyst layer Short-side-chain ionomer MEA Equivalent weight
a b s t r a c t
The morphology and fuel cell performance of cathode catalyst layers (CCLs) using low equivalent weight (EW) short-side-chain (SSC) perfluorosulfonic acid ionomers have been investigated in this work. The results were compared with those for a baseline CCL containing 30 wt% of the conventional ionomer 1100 EW Nafion®. The CCLs fabricated with 10–20 wt% of the AquivionTMionomer displayed a similar
morphology to the Nafion®-based CCLs. Electrochemical surface areas (ECSA) and double layer
capaci-tances of all the AquivionTM-based samples were similar to those of the baseline. The oxygen reduction
reaction (ORR) kinetics in CCLs with 20 wt% and 30 wt% AquivionTMwere lower than the baseline under
100% relative humidity (RH), yet similar to the baseline at 70% RH. In situ electrochemical impedance spectroscopy (EIS) measurements suggested that the lowered ORR kinetics at 100% RH may be attributed to the large mass transport resistance in AquivionTM-based samples at low current densities. Relative to
the baseline, CCLs containing 20 wt% AquivionTMionomer demonstrated an improvement in fuel cell
per-formance under operating conditions of 95◦C and RH values of 30, 50 and 70%. The greater hydrophilicity
of the SSC ionomers is believed to account for the improved fuel cell performance at the relatively higher operating temperature and dry conditions.
Crown Copyright © 2011 Published by Elsevier B.V. All rights reserved.
1. Introduction
The membrane-electrode-assembly (MEA) plays an essential role in proton exchange membrane fuel cells (PEMFCs). The cat-alyst layers (CLs) of the MEA require effective three-phase reaction boundaries, high catalyst utilization, efficient conduction of pro-tons and electrons, and facile transport of reactants and water throughout the entire electrode. The optimization of the electrode, especially the cathode catalyst layer (CCL) is essential for high fuel cell performance[1–3]. Perfluorosulfonic acid (PFSA) ionomers have been widely used as the electrolyte membrane and as a binder and proton conductor in CLs. The most commonly utilized ionomer is Nafion®; it consists of a polytetrafluoroethylene (PTFE) backbone
and ether-linked, perfluorinated side chains with a sulfonic acid end group. Nafion®is often referred to as a long-side-chain (LSC)
ionomer. To achieve good fuel cell performance, Nafion®is
incorpo-rated into the electrode to extend the three-phase reaction sites and
∗ Corresponding author.
E-mail address:titichai.navessin@nrc-cnrc.gc.ca(T. Navessin).
improve the pathway for proton conduction. A number of studies reveal that the optimal Nafion®loading in the CL is ∼30 wt%[4–6].
Although Nafion®exhibits many advantageous properties and
still remains a suitable material for fuel cell applications, it does have limitations; for example, the useful operating temperature is relatively low (<90◦C), and its proton conductivity is insufficient
under dry conditions. For both stationary and automotive applica-tions, it is desirable to operate fuel cells at higher temperatures (e.g. >100◦C) and under lower humidity conditions to improve
reac-tion kinetics, enhance carbon monoxide tolerance at the anode, and simplify cooling and humidification subsystems[7].
A short-side-chain (SSC) PFSA ionomer, originally synthesized by Dow Chemical[8], showed an improvement in proton conduc-tivity compared to Nafion®[9–12]. Due to the complexity of the
synthetic process, the development of this SSC ionomer has been limited until recently. Solvay Solexis has developed a much sim-pler synthetic route and re-initiated the development of this SSC ionomer for fuel cell applications. The SSC ionomer is similar in structure to Nafion®, however it contains a shorter pendant
side-chain that carries the functional ion-exchange group. For a given equivalent weight (EW), SSC ionomers generally exhibit a higher
0378-7753/$ – see front matter. Crown Copyright © 2011 Published by Elsevier B.V. All rights reserved. doi:10.1016/j.jpowsour.2011.03.024
Author's personal copy
C. Lei et al. / Journal of Power Sources 196 (2011) 6168–6176 6169
crystallinity and glass transition temperature when compared to Nafion®; these characteristics make SSC ionomers promising
for high-temperature applications. Moreover, the enhanced crys-tallinity enables the EW of SSC membrane to be reduced to values as low as 700 g eq−1, without having the membranes dissolve or
swell excessively[9]. Compared with 1100 EW Nafion®, the SSC
ionomer with an EW of 858 g eq−1 results in a higher charge
carrier concentration, increased proton conductivity, and, thus, a smaller Ohmic potential loss[12]. A number of experimental and theoretical studies have been published on SSC PFSA mem-branes[10,13,14]; on the contrary, reports on using low EW SSC PFSA ionomers in the CCL remain scarce. Xu et al. have recently reported their results on improved PEMFC performance using low EW PFSA in the CCL; however, the study did not fully explore the microstructure-performance relationship from the perspective of electrode design[15]. Peron et al. studied the influence of different EW SSC ionomers on the cell performance at high temperatures, and found that fuel cell performance was greatly improved at 110◦C
and 30% relative humidity (RH)[16]. Despite the above-mentioned findings reported in the literature, the role of SSC PFSA ionomers in CCLs is still not sufficiently understood.
Considering that the cell performance at low RH is strongly dependent on the water-uptake capacity of the ionomer in a CL, a systematic study on the microstructure-performance relationships of CCLs containing SSC ionomer is of particular interest. It is hypoth-esized that the low EW ionomer may reduce the ionomer loading requirements and change the structure of the CL. This potential structural change may possibly lead to a more effective use of pore space and improved cell performance. This work attempted to test and evaluate this hypothesis by preparing CCLs contain-ing an 830 EW SSC ionomer (AquivionTMD83-15C, Solvay Solexis).
For comparison purposes, a baseline CCL was fabricated with an optimal Nafion®ionomer loading of 30 wt%. Various amounts of
SSC ionomer were incorporated in the CCL, and the optimum SSC ionomer content was identified. The differences in morphology and electrochemical fuel cell performances between SSC-based MEAs and Nafion®-based MEAs are analyzed and discussed.
2. Experimental
2.1. Fabrication of membrane–electrode-assemblies (MEA)
Both cathode and anode catalyst inks were prepared using a dis-persion media mixture of 1:1 MeOH/water and 46 wt% Pt/C (Tanaka Kikinzoku Kogyo). The solid content of all the inks was approx-imately 1 wt%. The AquivionTMD83-15C SSC dispersion (EW 830,
Solvay Solexis) was used as the CCL ionomer. The CCLs with various AquivionTMcontents, 10, 20, 30 and 40 wt%, are denoted as AQ10,
AQ20, AQ30 and AQ40, respectively. CCLs with 30 wt% Nafion®
ionomer (D-520, 5 wt% solution, EW 1100, DuPont) were also fabri-cated, and are denoted as NF30. The anode CL for all MEAs contained of 30 wt% Nafion®ionomer.
Nafion®membrane (25 m thick, NRE-211, DuPont) was used
as-received. An automated spray coater (EFD Ultra TT series) was employed to deposit the anode CL (0.1 mg cm−2Pt) and the
cath-ode CL (0.4 mg cm−2Pt) onto the membrane. The catalyst-coated
membranes (CCMs) had electrode geometrical surface areas of 5 cm × 5 cm. The membrane was mounted on a vacuum table heated to 85◦C. The anode CL was deposited first on one side of
the membrane, and then the cathode CL was deposited on the other side. The amount of catalyst deposited was controlled by calibrating the flux of the spray coater; the calibration experiment consisted of spraying catalyst ink onto an inert substrate (Al foil) and measur-ing the mass deposited. The actual Pt loadmeasur-ings of cathode half-CCMs were verified by inductively coupled plasma-optical emission
spec-trometry (ICP-OES); the variation of the Pt loading was confirmed to be within 3% for a 0.40 mg Pt per cm2 loading. Detailed
fabri-cation procedures are described in the supplementary material of Ref.[3].
2.2. Physical characterization of catalyst inks and CCL
In order to assess the impact of ionomer on the catalyst ink dispersion and, thus, the ability to spray the CCL homogeneously, dynamic light scattering (Malvern Zetasizer Nano ZS) experiments were performed at 25◦C for more than 24 h on all the fresh inks.
The inks containing different amounts of AquivionTM ionomer
provided similar particle size distributions. The mean, intensity-weighted, solvodynamic diameter of the prominent particles in the AquivionTM-based inks was similar to that of NF30 ink. The inks
pre-pared using various loadings of AquivionTMionomer appeared to
be stable for at least 24 h.
The morphology and cross-section of the prepared CCMs were examined using a scanning electron microscope (Hitachi S-3500N). The samples were prepared by fracturing the CCMs after immersion in liquid nitrogen. These fractured samples were then coated with gold by sputtering.
The peak pore size and pore size distribution (PSD) of the CCL were examined using a Hg porosimeter (Micromeritics, Auto Pore IV 9500). The applied pressure ranged from 177 to 3300 psi, cor-responding to pore sizes of 1 m to 5 nm in diameter. Detailed procedures are described in the supplementary material of Ref.[3].
2.3. MEAs and single cell
The CCM, which had a geometric area of 25 cm2, was inserted
between two 24BC-type gas diffusion layers (SGL Group) and assembled into a single cell possessing straight flow-through chan-nels. The uniformity of the cell compression was tested using pressure-sensitive films (Pressurex-Super Low, Sensor Products Inc.). The single cell was evaluated in a fuel cell test station (100 W, Scribner 850C, Scribner Associates, Inc.).
2.4. Fuel cell testing protocol
The MEAs were conditioned at 1.0 A cm−2, 100% RH, 80◦C for at
least 6 h and until the variation of the steady state potential was less than 1 mV. Air flowing at 5 SLPM and H2(purity 99.999%) flowing at
2 SLPM were used as the cathode and anode reactants, respectively. Electrochemical surface area (ECSA) was measured by cyclic voltammetry (CV) using a potentiostat (1287A, Solartron Analyti-cal). Humidified H2(0.5 SLPM, 80◦C) and N2(0.5 SLPM, 80◦C) were
purged for 30 min at the anode and cathode, respectively. The N2
flow was then set to zero, and the cell was stabilized for 20 min. Voltammograms were recorded under 0.5/0.0 SLPM H2/N2using a
50 mV s−1scan rate between 0.90 and 0.04 versus the anode. The
final cycle of a set of 10 cycles was used for data analysis. The ECSA of MEAs was calculated from the integrated charge correspond-ing to the Pt–H desorption and adsorption peaks. The double-layer capacitance of the CCLs was also obtained from cyclic voltammo-grams.
The H2cross-over current density (iHX) was measured by
poten-tial step voltammetry under constant 0.5/0.5 SLPM H2/N2at the
anode and cathode, respectively. The working electrode (cathode) potential was stepped from 0.2 to 0.5 V in 0.1 V increments and was equilibrated for 3 min.
In order to measure the ionic resistance in the CCL, electrochem-ical impedance spectroscopy (EIS) was performed using a Solartron 1287A potentiostat and a 1260 frequency analyzer. Flow condi-tions of 0.5/0.5 SLPM H2/N2were used once again. The amplitude
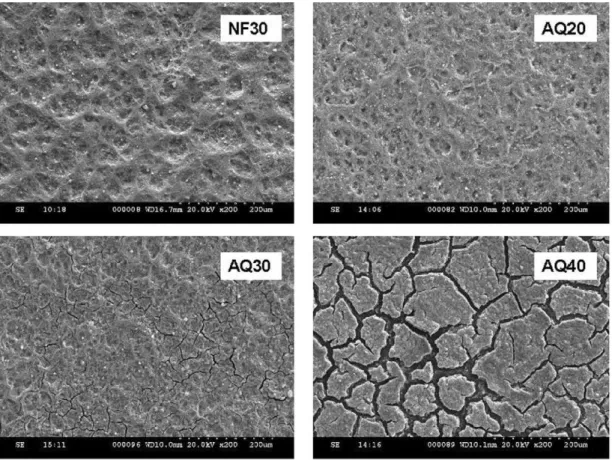
Fig. 1. SEM images of the top surface of CCLs under 200× magnification.
10 mV over a frequency range of 20 kHz to 0.1 Hz. EIS spectra were obtained under a DC bias potential of 0.45 V versus the anode.
The ORR kinetics of these CCLs were determined by acquiring H2/O2polarization curves at 100% and 70% RH using excessive gas
flow rates of 2 SLPM H2 and 5 SLPM O2. The current load
gradu-ally decreased in intervals from 1 A cm−2to 0.008 A cm−2and was
held for 15 min at each point. The cell potential at steady state was obtained by averaging the data recorded in the last 2 min. The cell potentials were plotted against the log of current density, and the Tafel slope was extracted.
Beginning of life (BOL) cell performance of these MEAs were evaluated at 80 and 95◦C under different relative humidities (100%,
70%, 50% and 30% for both anode and cathode) at ambient pressure. The H2/air polarization curve was obtained galvanostatically, and
the cell was held at each current load for 10 min to reach a steady state in which the potential variation was less than 1 mV. The cell potential was obtained by averaging the data in the last 2 min. EIS experiments were conducted by imposing a small sinusoidal (AC) voltage of known amplitude and frequency on the cell, while mon-itoring the cell’s amplitude and phase response. The perturbation amplitude for the AC impedance was 10% of the direct current over a frequency range of 10 kHz to 0.1 Hz.
3. Results and discussion
3.1. Morphology and thickness of the CCLs
Fig. 1 shows SEM images of the top surface of the various CCLs prepared. Sample AQ10 (not shown), AQ20 and the baseline CCL, NF30, all displayed a similar dense surface. As the content of AquivionTMin the CL was increased from 20 to 30 wt%, cracks
appeared in the catalyst layer. The cracks in AQ40 had widths up to 20 m and were large enough to separate the CLs into islands.
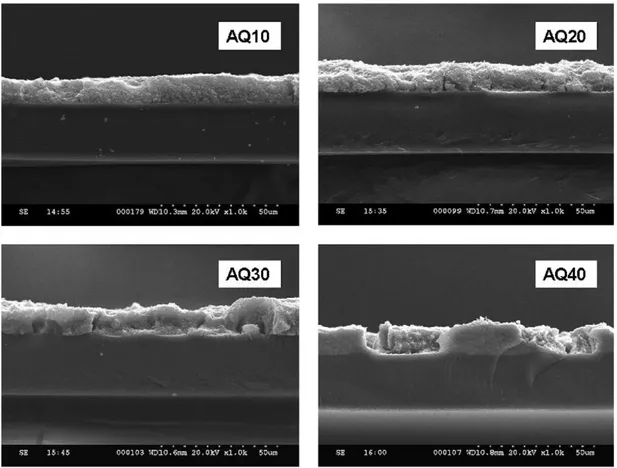
In fact, cross-sectional micrographs (Fig. 2) suggested that these cracks penetrated the entire thickness of the CL. The thickness of the different CL samples is summarized inTable 1. All the AquivionTM
-based CLs show a uniform thickness of about 11 ± 2 m.
It is noteworthy that, by using the same ink formulation and fabrication parameters, the formation of micro-cracks has not been observed in CLs containing high Nafion®contents of up to 40 and
50 wt% in our study. In an attempt to avoid the formation of cracks in the CLs containing the AquivionTMionomer, modifications to the
following fabrication parameters were evaluated: heating temper-ature and evaporation rates (increasing the substrate tempertemper-ature from 70 to 88◦C), catalyst materials (employing different types
of carbon supported Pt), and the substrates (depositing on mem-brane or Al foil). These parameters provided negligible change in the observed microstructure. This evaluation leads to a consider-ation that the formconsider-ation of micro-cracks in the AquivionTM-based
CLs may be due to the high hydrophilicity of low EW ionomers[17]
and the use of water-based ink formulations.
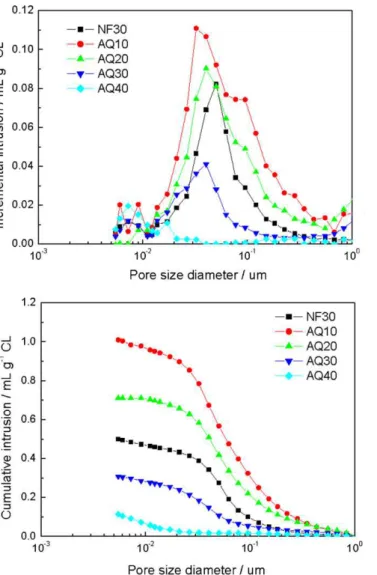
The peak pore size and PSD (Fig. 3) of the CLs were examined by Hg porosimetry. The porosities based on cumulative intrusion are listed inTable 1. In general, the PSD of the samples AQ20 and AQ30 ranged from 10 to 400 nm, and were similar to that of NF30. AQ40 displayed a very low pore volume with pore sizes in the range from 5 to 10 nm. Since the porosity results from a typical Hg porosime-ter only account for the pore volume associated with pore sizes
Table 1
Thickness and porosity of CCLs.
NF30 AQ10 AQ20 AQ30 AQ40 Thickness of CL (m) 10.5 11.0 11.0 11.5 11.0 Thickness deviation (m) ±2.0 ±1.0 ±2.0 ±2.0 ±1.0 Peak pore size (nm) ∼50 ∼35 ∼40 ∼40 / Porosity (%) ∼38 ∼47 ∼42 ∼21 ∼8
Author's personal copy
C. Lei et al. / Journal of Power Sources 196 (2011) 6168–6176 6171
Fig. 2. Cross sectional SEM images of CCLs under 1k× magnification. less than 1 m[3], the porosity of sample AQ30 may have been
underestimated due to its micro-cracks. As shown inFig. 1, some of these cracks have widths and lengths larger than 1 m, and, there-fore, they may not have been included in the calculated porosity. It was found that both the porosity and the range of PSD pro-file of AquivionTM-based CLs decreased as the AquivionTMcontent
increased. This trend indicates that the ionomer penetrated both meso- (2–50 nm diameter) and macro- (>50 nm diameter) pores. It was expected that the CL sample with extensive micro-cracks and low porosity may exhibit insufficient reproducibility and high acti-vation polarization losses during electrochemical characterization
[18,19]; therefore, AQ40 was not included for further systematic investigation.
3.2. Electrochemical fuel cell analysis and discussion
Cyclic voltammograms of different CCLs in MEAs at 80◦C and
100% RH are shown inFig. 4. The AquivionTM-based CCLs exhibit
characteristic features of hydrogen adsorption/desorption and oxide formation/reduction that are similar amongst themselves and when compared to the baseline CCL NF30. The ECSA data and double layer capacitances (Cdl) under the above-mentioned
condi-tions are summarized inTable 2. The ECSA and Cdlvalues for the
Table 2
Electrochemical performance at 80◦C and 100% RH of MEAs prepared with various
CCLs. ESA (H-des) (m2g−1) ESA (H-ads) (m2g−1) Cdl(mF cm−2) iHX(mA cm−2) NF30 40.7 42.9 19.3 2.07 AQ10 39.1 39.2 24.1 1.78 AQ20 41.5 41.7 18.7 1.92 AQ30 41.1 43.3 19.3 1.70
AquivionTM-based CCLs were close to those for NF30, indicating
that the surface area of Pt in contact with ionomer was similar for the Nafion®and AquivionTM-based samples analyzed.
H2cross-over currents for all the tested MEAs were found to be
less than 2.1 mA cm−2(Table 2), and accounted for less than 4% of
the current density of a fuel cell operating under practical condi-tions (0.8–0.3 V, 0.06–1.40 A cm−2, see polarization curves below).
Therefore, the loss of efficiency caused by H2cross-over could be
considered negligible.
The proton conductivities of the CLs were evaluated by EIS under an operating temperature of 80◦C and with RH values of 70% and
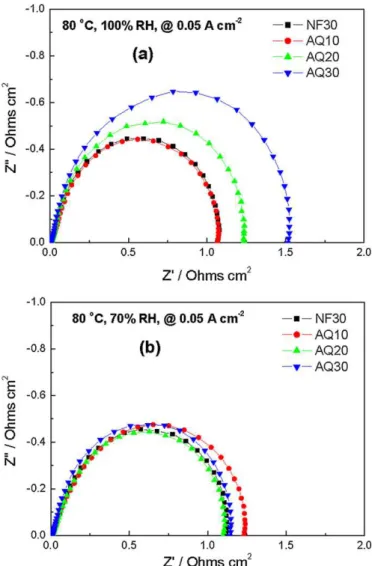
100%. Impedance spectra are presented as Nyquist plots inFig. 5. For clarity, the spectra are shifted to the origin by removing high frequency resistance from the real axis. As expected and under both operating conditions, the proton resistance (Rp) of the CL decreased
with the increasing content of AquivionTM, the proton conductor,
in the CCL. In comparison to NF30, AQ10 exhibited a higher pro-ton resistance of the CL, whereas AQ20 demonstrated a similar proton resistance of the CL despite its relatively lower ionomer con-tent. At the same ionomer loading, AQ30 exhibited a lower proton resistance of the CL than the baseline NF30. These results suggest that the low EW (high ion exchange capacity) ionomer reduces the required ionomer loading in the CLs, while maintaining adequate electrode proton conductivity.
H2/O2 polarization curves of MEAs were recorded using an
operating temperature of 80◦C, RH values of 70% and 100%, and
excessive gas flow rates. Tafel plots were constructed and are shown inFig. 6. In order to compare the results, the iR-corrected electrode potentials (defined as the measured potential plus the iRucompensation) were plotted against the compensated current
density (measured current density plus the cross-over current den-sity). In the kinetically controlled regime (E > 0.80 V) under fully humidified conditions, the Tafel slopes for AquivionTM-based MEAs
Fig. 3. Pore size distribution of the half-CCMs.
increased as the ionomer content is increased. AQ20 and AQ30 showed higher Tafel slopes (82–86 mV dec−1) than the baseline
NF30 CCL (63 mV dec−1); however, when the RH was decreased
to 70%, AQ20 and AQ30 MEAs displayed similar Tafel slopes
Fig. 4. Typical cyclic voltammograms of CCLs in MEAs at 80◦C and 100% RH.
Fig. 5. Nyquist plots of CCLs in MEAs under operating conditions of 80◦C and RH
values of (a) 100% and (b) 70%.
(61 ± 1 mV dec−1) to NF30 (65 mV dec−1). This similarity implied
that these different CCLs demonstrated the same inherent elec-trode kinetics towards ORR at 70% RH. The slightly higher Tafel slope of approximately 78 mV dec−1 for AQ10 at 70% RH can be
attributed to its higher proton resistance [seeFig. 5(b)]. It is com-monly observed that the Tafel slope for CCLs containing Nafion®
remains constant when the ionomer is sufficiently hydrated, i.e., at RH values above 60–70%[20,21]. This trend was also seen in this study, as the baseline NF30 sample’s Tafel slope remained almost constant as the RH was changed from 70% to 100%. Such a trend did not exist for the CCLs containing the AquivionTMionomer: AQ20
and AQ30 exhibited higher Tafel slopes at 100% RH, indicating that their ORR activities were reduced.
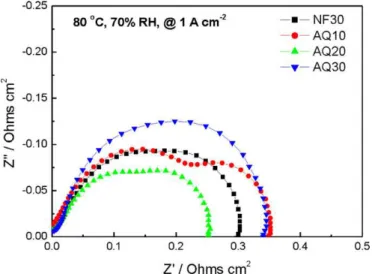
In order to further understand the different electrode kinetics, in situ EIS was performed at 0.05 A cm−2 and under H
2/air
oper-ating conditions. Impedance plots are shown inFig. 7. For clarity of comparison, the high frequency intercepts, which represent the uncompensated Ohmic resistances, are offset to zero. The low fre-quency intercept on the real impedance axis (Rlf), i.e., the diameter
of the semi-circle, corresponds to the sum of the effective charge transfer resistance (Rct) and mass transport resistance (Rmt). At very
low current densities, it was assumed that there are no significant losses associated with delivery of reactant gases to the electrode interface since the oxygen consumption rate is small; therefore, Rlf
Author's personal copy
C. Lei et al. / Journal of Power Sources 196 (2011) 6168–6176 6173
Fig. 6. Tafel plots of H2/O2polarization at 80◦C and RH values of (a) 100% and (b)
70%.
was mainly attributed to Rct. It was found that, as the RH changes
from 70% to 100%, the Rlffor NF30 remained nearly constant and
the Rlffor AQ10 decreased slightly. On the contrary, the Rlffor AQ20
and AQ30, which were similar at 70% RH, increased dramatically under fully humidified conditions. The observed trends for Rlfare
consistent with the Tafel slope analysis; thus indicating that the lowered ORR kinetics in AQ20 and AQ30 can be attributed to the larger resistance, Rlf. Given that the MEA fabrication and testing
protocols were the same for all the samples, the increase in Rlf(or
lowered ORR kinetics) for AQ20 and AQ30 under the fully humidi-fication condition may be related to the intrinsic properties of the SSC ionomer. We speculate that the higher hydrophilicity of the AquivionTM ionomer than Nafion® leads to a higher water
con-tent in the ionomer network. Under the fully humidified condition, this augmented water content could possibly have two deleterious effects: (i) dilution of the local proton concentration, and (ii) reduc-tion of the solubility of oxygen in the ionomer. Further detailed investigations are required to fully understand the observed phe-nomena.
The H2/air polarization curves obtained at 80◦C and 100% RH,
as well as the contribution from the Ohmic resistance, are plotted in Fig. 8. The high frequency resistance (HFR), which predom-inately consists of the membrane’s ionic resistance and other
Fig. 7. In situ electrochemical impedance spectra obtained at 80◦C, 0.05 A cm−2, and
RH values of (a) 100% and (b) 70%.
electronic/contact resistances, were very similar for all CCL sam-ples. In the kinetic region, the cell performances of AQ20 and AQ30 were lower than that of NF30, while the performance of AQ10 is similar to the baseline. These observations are consistent with the Tafel slope analysis and the EIS results presented inFigs. 6 and 7, respectively.
Fig. 9. In situ electrochemical impedance spectra obtained at 80◦C and 100% RH
while the cell is operated at (a) 1.0 A cm−2and (b) 1.4 A cm−2.
In the mass transport region (current densities >1.0 A cm−2),
the trend of the polarization curves was complex. AQ10 mimicked the performance behaviour of the NF30 baseline at current den-sities <1.4 A cm−2, but demonstrated slightly lower performance
at >1.4 A cm−2. AQ20 showed an improvement in the mass
trans-port region relative to AQ10 and exhibited a higher performance than the baseline at >1.4 A cm−2. In situ EIS data were recorded
at 100% RH while the cell was operated at two different current densities (Fig. 9). When the current density was raised from 1.0 to 1.4 A cm−2, the R
lffor NF30 increased from 0.350 to 0.525 cm−2. A
similarly large increase from 0.325 to 0.575 cm−2was exhibited
by the Rlf for AQ10. As seen for NF30 and AQ10, at high
cur-rent densities, Rlfis expected to increase with increasing current
density because of the exacerbated mass transport limitations. Sur-prisingly, only a small increase in Rlffrom 0.625 to 0.700 cm−2
was observed for AQ30, while the Rlf for AQ20 remains
essen-tially unchanged at 0.500 cm−2. The results of the EIS data were
consistent with performance behaviours demonstrated at current densities >1.0 A cm−2. The exceptional trends of Rlffor AQ20 and
AQ30 are speculated to be related to an envisioned reduction in catalyst layer flooding and warrant further investigation.
At 70% RH and 80◦C, the AquivionTM-based MEAs displayed
smooth polarization curves, as shown inFig. 10. At the low cur-rent densities of the kinetically controlled region, AQ20 and AQ30 achieved the same cell voltages as the baseline NF30, while AQ10
Fig. 10. H2/air polarization curves at 80◦C and 70% RH.
showed slightly lowered cell potentials. These results were also consistent with the ORR kinetic data reported inFig. 6. At higher current densities, each of the AquivionTM-based MEAs
demon-strated a different trend relative to NF30. The cell voltage of AQ10 remained slightly lower than NF30. The performance of AQ30 was quite similar to the baseline sample; for example, the dif-ference in potential at 1 A cm−2 was less than 10 mV. Moreover,
AQ20 exhibited a higher performance than NF30. The performance improvement of AQ20, in comparison to NF30, was more pro-nounced at higher current density; for example, the magnitude of the enhanced performance grew from 26 mV at 1.0 A cm−2to 52 mV
1.4 A cm−2.
In order to more fully understand the cell performance at 80◦C
and 70% RH, in situ EIS were obtained for the MEAs while at 1.0 A cm−2(Fig. 11). The spectrum for each MEA consisted of two
distinct impedance arcs, corresponding to Rctat high frequency and
Rmtat low frequency. As previously discussed, Rct, which is
deter-mined by ORR kinetics, was similar for AQ20, AQ30 and NF30 [see
Figs. 6(b) and 7(b)]. The difference in the impedance spectra of these three MEAs is attributed to Rmt. AQ20 displayed the smallest Rmt
and, thus, the lowest total cell resistance, which accounts for its superior performance. It is noteworthy that the trend of increas-ing Rmtof these three samples is consistent with their decreasing
porosity results (see Section3.1). AQ10 had the highest porosity
Fig. 11. In situ electrochemical impedance spectra obtained at 80◦C and 70% RH
Author's personal copy
C. Lei et al. / Journal of Power Sources 196 (2011) 6168–6176 6175
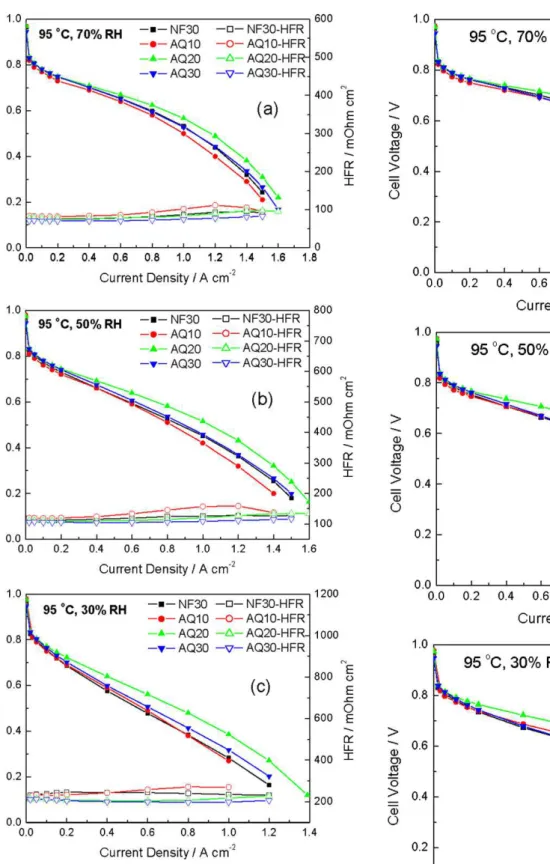
Fig. 12. H2/air polarization curves at 95◦C and RH values of (a) 70%, (b) 50% and (c)
30%.
(∼47%), and displayed a similar low frequency arc in the EIS as AQ20 (porosity ∼42%); however, AQ10 exhibited a larger high fre-quency arc (Rct) due to its high proton resistance inside the CL.
Therefore, the total cell resistance of AQ10 became greater than AQ20. In contrast, AQ30 achieved the highest proton conductiv-ity, but showed an even larger total cell resistance due to its small porosity. Overall, as the AquivionTMcontent was raised, the proton
conductance increased and the porosity of the CL decreased. It is
Fig. 13. iR compensated H2/air polarization curves at 95◦C and RH values of (a) 70%,
thus concluded that the higher performance of AQ20 is attributed to an optimal balance between protonic resistance and porosity in the AquivionTM-based MEAs.
H2/air polarization curves and HFR results for all these MEAs
were also obtained at an elevated temperature of 95◦C and at
vari-ous RHs (Fig. 12). In general, AQ10 demonstrated slightly lower cell voltages, especially at high current densities, which was probably due to its higher HFR. AQ30 showed a similar performance to NF30. Again, AQ20 displayed a superior cell performance amongst the tested MEAs at the increased temperature, with the improvement becoming more pronounced under drier conditions. For example, in comparison to NF30, the cell voltage enhancement of AQ20 at 1.0 A cm−2increased to 100 mV at 30% RH.
In order to eliminate the effect of the cell resistance on the polar-ization curves, the iR compensated H2/air polarization curves are
plotted inFig. 13. AQ10, AQ30 and the baseline sample NF30 exhib-ited very similar performances. The difference in the measured cell voltage at a given current density among these three MEAs is less than 10 mV. The results suggest that when the conventional Nafion®ionomer is replaced by a low EW ionomer, the ionomer
loading can be significantly reduced without sacrificing cell per-formances under dry conditions. The high hydrophilicity of the SSC ionomer, along with its low EW, may help to retain water and, thus, provide sufficient protonic conductivity under dry conditions, even at ionomer loadings as low as 10 wt%.
4. Conclusions
In summary, fuel cell CCLs containing different loadings of a low EW SSC PFSA ionomer, AquivionTM, were fabricated and
inves-tigated in terms of their fuel cell performance and morphology. The results were compared with baseline CCLs prepared using the conventional ionomer 1100 EW Nafion®.
ECSA and Cdlof all the SSC ionomer-based samples were similar
to those of the baseline. The ORR kinetics of AQ20 and AQ30 under 100% RH were significantly lower than the baseline; however, they were similar to NF30 at 70% RH. In situ EIS measurements suggested that the lowered ORR kinetics at 100% RH may be attributed to larger mass transport resistances in SSC-based CCLs compared to the baseline CCLs.
An increase in cell voltage was observed for CCLs containing 20 wt% AquivionTM. The cell performance in AQ20 demonstrated
further improvement under dry conditions at 95◦C. For example,
relative to the baseline sample, the cell voltage enhancement at 1.0 A cm−2of the AQ20 MEA reached 100 mV at 95◦C and 30% RH.
These results suggest that even for low ionomer loadings of only
10 wt%, CCLs containing low EW ionomer can achieve performances comparable to baseline CCLs when the cell is operated at 95◦C and
under dry conditions. The high hydrophilicity, low EW of these SSC ionomers and more effective use of pore space are believed to account for the improved fuel cell performance.
Acknowledgments
Thanks go to the NRC Technology Development Program for financial support and to Ballard and AFCC for financial and in-kind support. Mr. Paul Le Marquand is thanked for validation of the cata-lyst ink stability and for proofing this manuscript. Mr. Dave Edwards and Dr. Ken Shi are thanked for technical discussions.
References
[1] S. Litster, G. McLean, Journal of Power Sources 130 (2004) 61–76.
[2] Z. Xie, T. Navessin, K. Shi, R. Chow, Q.P. Wang, D.T. Song, B. Andreaus, M. Eik-erling, Z.S. Liu, S. Holdcroft, Journal of the Electrochemical Society 152 (2005) A1171–A1179.
[3] Z. Xie, X.S. Zhao, M. Adachi, Z.Q. Shi, T. Mashio, A. Ohma, K. Shinohara, S. Hold-croft, T. Navessin, Energy and Environmental Science 1 (2008) 184–193. [4] E. Passalacqua, F. Lufrano, G. Squadrito, A. Patti, L. Giorgi, Electrochimica Acta
46 (2001) 799–805.
[5] K.H. Kim, K.Y. Lee, H.J. Kim, E. Cho, S.Y. Lee, T.H. Lim, S.P. Yoon, I.C. Hwang, J.H. Jang, International Journal of Hydrogen Energy 35 (2010) 2119–2126. [6] E. Antolini, L. Giorgi, A. Pozio, E. Passalacqua, Journal of Power Sources 77 (1999)
136–142.
[7] J. Larminie, A. Dicks, Fuel Cell Systems Explained, John Wiley and Sons, Chich-ester, England, 2000.
[8] G.A. Eisman, Journal of Power Sources 29 (1990) 389–398.
[9] A. Ghielmi, P. Vaccarono, C. Troglia, V. Arcella, Journal of Power Sources 145 (2005) 108–115.
[10] L. Merlo, A. Ghielmi, L. Cirillo, M. Gebert, V. Arcella, Separation Science and Technology 42 (2007) 2891–2908.
[11] S.J. Paddison, J.A. Elliott, Solid State Ionics 178 (2007) 561–567.
[12] K.D. Kreuer, M. Schuster, B. Obliers, O. Diat, U. Traub, A. Fuchs, U. Klock, S.J. Paddison, J. Maier, Journal of Power Sources 178 (2008) 499–509.
[13] S.J. Paddison, J.A. Elliott, Solid State Ionics 177 (2006) 2385–2390.
[14] D.S. Wu, S.J. Paddison, J.A. Elliott, Energy and Environmental Science 1 (2008) 284–293.
[15] H. Xu, H.R. Kunz, L.J. Bonville, J.M. Fenton, Journal of Electrochemical Society 154 (2007) B271–B278.
[16] J. Peron, D. Edwards, M. Haldane, X.Y. Luo, Y.M. Zhang, S. Holdcroft, Z.Q. Shi, Journal of Power Sources 196 (2011) 179–181.
[17] V. Arcella, C. Troglia, A. Ghielmi, Industrial and Engineering Chemistry Research 44 (2005) 7646–7651.
[18] F.E. Hizir, S.O. Ural, E.C. Kumbur, M.M. Mench, Journal of Power Sources 195 (2010) 3463–3471.
[19] M.P. Manahan, S. Kim, E.C. Kumbur, M.M. Mench, ECS Transactions 25 (2009) 1745–1754.
[20] H. Xu, R. Kunz, J.M. Fenton, Electrochemical Solid State Letters 10 (2007) B1–B5. [21] K.C. Neyerlin, H.A. Gasteiger, C.K. Mittelsteadt, J. Jorne, W.B. Gu, Journal of