Alternative Fulfillment Operations and Vendor Analysis
ByTope Ogundele
B.S. Electrical Engineering, University of Pittsburgh, 2005
SUBMITTED TO THE MIT SLOAN SCHOOL OF MANAGEMENT AND THE ENGINEERING SYSTEMS DIVISION IN PARTIAL FULFILLMENT OF THE REQUIREMENTS FOR THE
DEGREES OF
MASTER OF BUSINESS ADMINISTRATION AND
MASTER OF SCIENCE IN ENGINEERING SYSTEMS
IN CONJUNCTION WITH THE LEADERS FOR GLOBAL OPERATIONS PROGRAM AT THE
MASSACHUSETTS INSTITUTE OF TECHNOLOGY MASAHUETS
MASSACHUSETTS INS
OF TECHNOLOGY JUNE 2013
MAY 3
0
2013
C 2013 Tope Ogundele. All Rights Reserved.
LIBRARIES
The author hereby grants to MIT permission to reproduce and to distribute publicly paper asnd e ectronic copies of this thesis document in whole or in part in any medium now known or hereafter created.
Signature of Author:
MIT Sloan School of Managn ent, Departmen of E gineering Systems May 10, 2013 Certified By:
Ro ipervisor
Professor of Statistics and Management Scie4 ems
Certified By:
E c , esis Supervisor
Executiv E Latin America
Accepted By:
Olivier de Weck, Chair, Engineering Systems Education Committee Associate Professor of Aeronautics and Astronautics and Engineering Systems Accepted By:
Maura Herson, Director of MIT Sloan MBA Program MIT Sloan School of Management
Alternative Fulfillment Operations and Vendor Analysis
By Tope Ogundele
Submitted to the MIT Department of Engineering Systems and to the MIT Sloan School of Management on May 10, 2013 in Partial Fulfilhnent of the Requirements for the Degrees of Master of Science in
Engineering Systems and Master of Business Administration
Abstract
This thesis describes the development of quantitative methods to strategically plan the SKU make-up and operational aspects of Amazon's Alternative Fulfillment Sites (AFS). AFSs are smaller Fulfillment Centers (FCs) that have a more focused set of SKUs. By focusing on a smaller subset, complexity and costs are reduced at these sites at the expense of the larger assortment of products seen at traditional FCs. Because of these tradeoffs, choosing what items to provide at each site is very important in the expansion of this program.
To determine the appropriate SKUs for AFSs, it was necessary to identify the relevant costs of fulfilling items through three fulfillment methods: Drop Shipping, Traditional Amazon Fulfillment Centers and Alternative Fulfillments sites. Understanding the relationship between the quantity fulfilled and the total costs for each fulfillment option provided guidance on which new products should be introduced to AFSs.
As for the operation of sites, analysis of the process takt time at current AFS sites was performed. By separating products into Size Categories, rates could be determined and used to estimate process rates for new products. With a given forecast, this information was used to determine the number of associates required to fulfill the demand at these sites. In addition, product dimensions and forecasts were used to determine the total square footage to hold inventory and provide enough work space for these sites.
Thesis Supervisor: Roy Welsch
Title: Professor of Statistics and Management Science and Engineering Systems Thesis Supervisor: Edgar Blanco
Acknowledgements
I would like to thank Amazon.com for their sponsorship of this project and their continued partnership with the Leaders for Global Operations (LGO) program. In particular I'd like to send a special thanks to my supervisor Kerry Person, his team, and the countless employees at Amazon headquarters and in the field who provided me the much needed support to make this project a success.
Thank you to my MIT advisors Roy Welsch and Edgar Blanco for your support during the internship and being a sounding board for all the work done in this research. I would also like to thank the LGO program, the MIT community and my summer team the Regul8tors for the opportunity, to learn with some of the best and brightest. This has been some of the best years of my life and I thank you for the life changing experience.
Finally and most importantly, I would like to thank my family and friends for all their love and support through the years. I love you all and thank you for being with me every step of the way.
Table of Contents
A b stra ct ... 3
Acknowledgem ents ... 5
Table of Contents ... 7
L ist o f T ab le s ... 8
1 Overview and Background ... 9
1.1 Am azon Background...9
1.2 Current State ... 9
1.3 Problem Statem ent ... 10
1.3.1 Fulfillm ent Decision M aking... 10
1.3.2 Total Landed Cost Analysis... 10
1.3.3 Alternative Fulfillment Site Setup ... 10
1 .4 T h e sis O u tlin e ... 1 1 2 Fulfillm ent Options Overview ... 11
2.1 Am azon Fulfillm ent Centers... 11
2.2 Drop Ship Fulfillment ... 15
2.3 Alternative Fulfillm ent Sites... 17
3 Literature Review ... 21
3.1 Current Industry Practices and Trends for Choosing Fulfillm ent Options ... 21
3.2 Current Industry Practices and Trends for Determining Staffing ... 22
4 Creation of Fulfillm ent Decision Tool... 23
4.1 M ethodology of Fulfillment Decision Tool Development... 23
4.2 Tool Findings... 24
5 Creation of Total Landed Cost Tool ... 31
5.1 M ethodology of Total Landed Cost Tool Developm ent ... 31
5.2 Tool Findings ... 32
6 Creation of Site Setup Tool... 36
6.1 Process Rate Analysis ... 36
6.2 M ethodology of Head Count Tool Developm ent... 38
6.3 M ethodology of Square Footage Tool ... 38
6 .4 T o o l R e su lts ... 4 1 7 Recom m endations for Further Research... 43
7 .1 S ea so n a l S ite s ... 4 3 7.2 Additional Factors for Total Landed Cost ... 43
7.3 Im provem ent of Data Collection at Alternative Fulfillm ent Sites ... 43 8 C o n c lu sio n ... 4 5 B ib lio g ra p h y ... 4 7 G lo ssary ... ,... 4 8
List of Tables
Table 1: Costs Analyzed for Fulfillment Decision Model... 23
Table 2: Costs Analyzed for Total Landed Cost Tool ... 31
Table 3: Inbound Rate Difference of AFS vs. FC... 36
Table 4 Outbound Rate Difference of AFS vs. FC... 37
Table 5: Entire Process Rate Difference AFS vs. FC ... 37
Table 6: Picking and Packing Efficiency Differences for AFS vs. FC...37
Table 7: Percent Difference of Head Count Hours of Modeled and Real Associate Work Hours ... 42
Table of Figures
Figure 1: Cost Analysis for Small Sized Items... 26Figure 2: Cost Analysis for Small Sized Items with No Fixed Costs ... 26
Figure 3: Cost Analysis for Medium Sized Items... 27
Figure 4: Cost Analysis for Medium Sized Items with No Fixed Costs... 27
Figure 5: Cost Analysis for Large Sized Items ... 28
Figure 6: Cost Analysis for Large Sized Items with No Fixed Costs ... 29
Figure 7: Cost Analysis for Heavy/Bulky Sized Items ... 30
Figure 8: Cost Analysis for Heavy/Bulky Sized Items no Fixed Costs ... 30
Figure 9: DS Outbound Cost Percent Difference... 33
Figure 10: FC Inbound Cost Percent Difference ... 33
Figure 11: FC Outbound Cost Percent Difference ... 34
1 Overview and Background
The purpose of this thesis and research is to help the future expansion of Amazon.com's Alternative Fulfillment Program in their Retail Organization. A strategy for the expansion and
improvement of the Alternative Fulfillment Program was created via the development of several tools that gave financial and operational analysis of current sites. With the analysis from these tools, Amazon is able to choose the optimal product mix for current and new Alternative Fulfillment Sites. The research work was performed during an internship with Amazon.com in collaboration with the Massachusetts Institute of Technology's Leaders for Global Operations Program.
1.1 Amazon Background
Amazon.com began in 1995 and has expanded rapidly in its quest to "to be Earth's most customer-centric company for four primary customer sets: consumers, sellers, enterprises, and content creators." 1 One key strategy used to improve the customer experience for their consumer segment is to
continually increase product offerings in its Retail Organization. This focus on the customer has been successful for Amazon and has fueled their growth.
1.2 Current State
With Retail being such a vital component of Amazon.com, there is a constant focus by the company to innovate and cut costs without sacrificing the experience for the customer. Amazon.com has shown continued innovation in its core network capabilities via large Fulfillment Centers (FCs). In addition to the FCs in their core network, Amazon.com uses fulfillment directly from the vendor, also known as Drop Shipping. In 2010, Amazon launched a new program, referred to as the Alternative Fulfillment Program, to investigate new fulfillment alternatives that could be more cost effective than
1
their traditional options. From this program, Alternative Fulfillment Sites (AFSs) were developed. AFSs are smaller FCs that focus on a limited subset of SKUs.
1.3 Problem Statement
With the financial success of a number of current Alternative Fulfillment Sites, Amazon has planned a larger roll out of AFSs for 2013. To properly make this transition from a number of pilot sites to a more comprehensive program, the Alternative Fulfillment Team is looking for more quantitative and
standardized ways to analyze and plan the launch and operation of new AFSs.
1.3.1 Fulfillment Decision Making
With such a large catalog of products currently fulfilled by Amazon.com, the Alternative Fulfillment Team needs a way to narrow down the SKUs to target for future AFSs. Due to the limited resources of the team, the method to find potential new SKUs must be thorough yet require minimal effort. In addition, with constant change in cost factors in the Retail industry, the tool will need to be able to accommodate any changes in fulfillment costs that may occur.
1.3.2 Total Landed Cost Analysis
The Alternative Fulfillment Team currently has financial information well summarized by the site, but getting a proper breakdown of historical costs by SKU is vital in optimizing the financial
performance of SKUs in all three fulfillment options (Drop Shipping, Traditional Fulfillment Centers and Alternative Fulfillment Sites). In addition, the team is seeking ways to estimate costs of particular items
in fulfillment modes from which they have never been fulfilled.
1.3.3 Alternative Fulfillment Site Setup
Once a set of SKUs is determined, a more standardized and comprehensive approach to planning the operational characteristics of the new site is needed. In particular, what must be determined are the
following: a). The square footage required to store inventory and process orders and b). The number of associates at the site needed to process and ship forecasted product demand.
1.4 Thesis Outline
The remainder of the thesis is organized as follows:
Chapter 2: Explores the three fulfillment options discussed in this thesis (AFS, Drop Ship, and FC), their costs, advantages and disadvantages
Chapter 3: Presents a literature review on the current practices of choosing fulfillment options and determining staffing
Chapter 4: Provides the approach and results of the tool used to determine the optimal fulfillment method based on product size and demand volume
Chapter 5: Provides the approach and results of the tool used for financial analysis of specific SKUs for the various fulfillment options
Chapter 6: Provides the approach and results of the Site Setup Tool used for planning new AFSs
2 Fulfillment Options Overview
Amazon utilizes various options for fulfilling customer orders. When choosing the best fulfillment option, a number of different costs are considered. These various costs must be evaluated along with a variety of different advantages and disadvantages that may have an effect on customer responsiveness and availability.
2.1 Amazon Fulfillment Centers
Amazon Fulfillment Centers are storage warehouses where inventory is prepared and shipped to Amazon customers. Amazon has placed a network of FCs in different locations all over the United States, in order to provide logistical outbound shipping advantages when fulfilling orders. Inventory for
FCs come from a variety of vendors and is owned either by Amazon or the vendor, depending on the agreement arranged upon beforehand. By holding this inventory, Amazon can ensure they have enough for their given forecast and in turn, provide the service level they see fit for the customer. A number of methods are utilized to optimize inventory placement, and from which FC a customer order is fulfilled.
Fulfillment Center Costs for Financial Tools
Fulfillment Centers have a cost structure that encompasses a number of fixed and variable costs. The two tools developed during this research were informed by the analysis of, the following cost types:
" Inbound Shipping Costs " Operating Storage Costs * Operating Throughput Costs " Capital Allocation Storage Costs e Capital Allocation Throughput Costs " Variable Labor Costs
e Inventory Holding Costs * Outbound Shipping Costs
Inbound Shipping Costs
The Inbound Shipping cost is derived by averaging the inbound costs for the last 90 days for a particular SKU. This cost is estimated when the particular item hasn't shipped via a Fulfillment Center in this time span,. To get this estimated cost, a query is used to find the average costs for inbound units
based on Product Category, Ship Mode, and Size Category. If the SKU's Size and Product Category are found on this table, the average cost is calculated via the equation
Inbound Shipping Cost of Units with the Same Size and Product Category
Z # of Units Received of Same Size and Product Category
Operating Storage Costs
Storage Costs are the costs incurred by an FC for holding and maintaining a piece of inventory. FC Costs that affect this include rent and discretionary costs. Amazon provided a table that includes the rates used to assess the cost for storing an item in the Traditional Amazon Fulfillment Network based on size. To determine what this cost is per unit, first the cubic inches of the SKU is derived. The inventory turns for the unit is also required to determine how long each unit shipped will spend in storage. The
final equation to derive this cost is as follows:
Cubic Inches per Unit * Storage Cost in Cubic inches/wk Weekly Inventory Turns Per Unit
If inventory turns information is unavailable due to the item not being recently shipped via a Fulfillment Center the average turns for SKUs of the same Size and Product Category is used.
Operating Throughput Costs
Operating Throughput costs are the costs for equipment and other FC costs that are required to process units at a Fulfillment Center. Amazon allocates this cost per unit during their annual financial planning. This model uses the average cost for sortable and non-sortable units, depending on the individual SKU's Size Category.
Capital Allocation Storage Costs
Amazon provides information for the cost of purchasing the storage equipment needed to store items within the Amazon network. Depending on the storage type, items have their own cost per cubic foot. To determine this cost on a weekly basis the recommended asset life is used to appropriately
depreciate the storage on a weekly basis. This methodology is summarized in the equation Cubic Ft per Unit * (Storage Cost in Cubic ft
Asset Life in Weeks Weekly Inventory Turns Per Unit
Capital Allocation Throughput Costs
Capital throughput costs are the costs for new equipment and other FC costs that are required to process units at a Fulfillment Center. Amazon allocates this cost per unit during annual financial planning. The models use the average cost for sortable and non-sortable units, depending on the individual SKUs Size Category.
Variable Labor Costs
Variable Labor Cost is pulled from historical data within Amazon's databases. In the event this data is unavailable for a particular SKU a query provides the allocated total cost and units by Product Category, Size, FC, and Process Step. To provide a fair comparison with Alternative Fulfillment Sites, Process Steps that aren't directly related with shipping items are excluded from this query. The average is then found at by Product Category and Size Category with the equation equtio,~Units Variable ProcessedtogtaCosto get an
expected variable labor cost per unit.
Inventory Holding Costs
Inventory Holding Costs refer to the opportunity cost due to Amazon purchasing inventory. The cost of capital rate can be altered in the model. With Cost of Goods Sold (COGS) and inventory turns information, the Holding Cost can be found using the equation, Cweeky Invent r Turs apital Rate
Outbound Shipping Costs
Using historical data within Amazon's databases, the average Outbound shipping cost for a given SKU for the previous 90 days is found. In the event the item hasn't shipped from a Fulfillment Center in the last 90 days the cost is estimated by using the output of a query that provides these shipping costs by Size Category and Product Category. From this query the average outbound shipping cost per unit from the FC Network for items of the same Size and Product Category is calculated. This average is found by the equation
Z Outbound Shipping Cost of Units with the Same Size and Product Category from FCs
Z # of Units Shipped of Same Size and Product Category from FCs
In the event that the item is from a Product Category that hasn't shipped via an FC in the last 90 days, the model will use information from all items of the same Size Category.
2.2 Drop Ship Fulfillment
There are instances where Amazon decides not to place items in their Fulfillment Center Network due to costs or constraints in-network. For items with these constraints that Amazon still wants customers to purchase through the Amazon.com website, Amazon may decide that a direct from vendor method is best. These vendors need to demonstrate the capability to fulfill direct to customer orders and are obligated to conform to a number of service level metrics to remain in the Drop Shipping Program. In addition, although Amazon doesn't own the inventory, the Drop Shipper must ensure that its product availability is up to date on Amazon.com. The Drop Shipper also decides inventory level which reduces the control Amazon has for ensuring proper service levels. Because the vendor handles a majority of the
Drop Ship Costs for Financial Models
For Drop Ship, since the inventory isn't owned by Amazon, there are fewer cost line items that are incurred by Amazon. The financial tool costs are:
" Variable Cost Per Unit
" Outbound Transportation Costs
Variable Cost per Unit
The method in which Drop Shippers charge Amazon for their services vary. Some Drop Shippers charge Amazon via a separate line item for the services they provide(Legacy Drop Shippers), others adjust the Cost of Goods Sold (COGS) to reflect the fee to Amazon for their partnership (Non-legacy Drop Shippers). Because the cost may not be known prior to establishing the relationship, a weighted average between these two scenarios was used to estimate what this cost might be for a given SKU, if the relationship was unknown.
For fulfillment fee costs, the data was obtained on the total costs incurred from legacy drop ship vendors for the first 6 months of 2012. Because each of these vendors has different methods for
determining the total fulfillment fee, the historical per unit cost is used to approximate these fees. The cost per unit is found by simply taking the total costs incurred and dividing by the units fulfilled via these methods.
To determine the average adjustment to COGs incurred by Drop Shippers, a query gathers data on the SKUs that have been fulfilled via Drop Ship for the last 90 Days. This query cross references these
SKUs with SKUs that have been fulfilled via traditional Amazon FCs. The average difference of COGS between each SKU is then output. From this query output the model finds the average COGS difference at the Product Category and Size level to get the expected COGS difference due to Drop Shipment. To
avoid incorporating extreme cases, COGS differences that were 2.5 times the Fulfillment Center's COGS were discarded. This criterion removed approximately 10% of the items for comparison.
With a known expected COGS difference from Non-Legacy Vendors and Per Unit Fulfillment Fee from Legacy Vendors, the current ratio of shipped units from Legacy Vendor to Non-Legacy Vendors is found for the last 90 days. This ratio is used to apply the weights for each type of fulfillment fee and provides a Variable Cost per Unit for use in the model. The equation,
Average COGS Difference * Drop Ship Units via Non-Legacy Vendor + Fulfillment Fee Per Unit * Total Drop Ship Units
# Drop Ship Units via Legacy Vendor summarizes the calculation of Drop Ship VCPU.
Outbound Transportation Cost
Historical data on the average Outbound shipping cost for a given SKU for the previous 90 days is queried from Amazon's database. In the event the item hasn't shipped via Drop Ship in the last 90 days the cost is estimated by using the output of a where the average outbound shipping cost per unit from Drop Ship for items of the same size and Product Category are calculated. This average is found by the equation
Z Outbound Shipping Cost of Units with the Same Size and Product Category from Drop Ship
E # of Units Shipped of Same Size and Product Category from Drop Ship
. In the event that the item is from a Product Category that hasn't shipped via Drop Ship in the last 90 days, the model will use information on all items of the same Size Category.
2.3 Alternative Fulfillment Sites
In 2010 Alternative Fulfillment Sites were launched to provide a new option for fulfilling customer orders from Amazon.com. Alternative Fulfillment Sites are smaller FCs that are normally geographically close to Amazon Vendors. In most cases Amazon has worked out an agreement where
inbound costs are not incurred by Amazon themselves, and thus are neglected during this research. Because of the small size of these sites normally products fulfilled from these sites are from one vendor, and are just a subset of the vendors catalog. Just like in an FC Amazon owns the inventory at these sites.
Alternative Fulfillment Site Costs for Financial Models
Alternative Fulfillment Sites have a cost structure that encompasses a number of fixed and variable costs which include:
* Rent Cost
* Additional Fixed Cost * Fixed Start Up Cost * Variable Labor Costs
* Inventory Holding Costs * Contra COGS
* Outbound Shipping Costs
Monthly Rent Cost
The Monthly Rent Cost is a user generated input. The total rent cost is allocated for each unit based on cubic dimensions with the equation Cubic dimensions of unit Shipped*Total Rent Cost Weekly
Total Cube Shipped at AFS
Monthly Additional Fixed Cost
Additional Fixed Cost refers to costs such as equipment rentals that are required for operating the Alternative Fulfillment site. Because these items are used to fulfill customer orders, this cost is allocated
evenly for each shipped unit as explained in the equation,
# of Units Shipped*TotalAdditional Fixed Cost Weekly
Total Units Shipped at AFS
Fixed Startup Cost
Fixed Startup Costs refers to the Capital Costs for the equipment and labor required to start a new Alternative Fulfillment site. The default setting is to depreciate the costs of 3 years, but this can be changed by the user. This cost is then allocated by unit shipped with the equation
# of Units Shipped*Total Capital Startup Cost Depreciated Weekly
Total Units Shipped at AFS
Variable Labor Costs
Alternative Fulfillment Sites currently do not have the ability to track the labor hours used to process orders at a per unit level. To estimate the labor costs, time studies were completed at a variety of Alternative Fulfillment Sites, to find the total amount of time required to fully process a unit. The steps timed were Receive, Stow, Pack and Ship. This data was then averaged for each Size Category. Because an associate does not utilize 100% of their time toward processing orders, the user has the ability to input the value added time an associate spends to fulfill orders. The total labor hours needed at the site for all SKUs is then calculated to determine the number of required associates. With their work schedule and pay rate, the total labor cost weekly at the site is determined. This cost then allocated at a unit level by the amount of time needed to process an individual unit (takt time) as explained in the equation
Total Weekly Associate Work Hours * Hourly Associate Rate * Time to Process 1 unit of SKU Total time at site spent processing-'
Because Alternative Fulfillment Sites require a minimum number of associates on site, for safety reasons, there is a minimum labor cost that will be incurred even if there isn't enough volume to keep the
inventory Holding Costs
Inventory Holding Costs refer to the opportunity cost due to Amazon purchasing inventory. The cost of capital rate can be altered in the models. With the COGS and inventory turns information, the Holding Cost can be found using the following equation: COweey Invento ost of pital Rate
Outbound Shipping Costs
Using data from Amazon's databases the average Outbound shipping cost for a given SKU for the previous 90 days is found. In the event the item hasn't shipped from an Alternative Fulfillment Site in the last 90 days the cost is estimated by using the output of a query. From this query the average
outbound shipping cost per unit for items of the same Size and Product Category shipped via an Alternative Fulfillment Site is calculated. This average is found by the equation
2 Outbound Shipping Cost of Units with the Same Size and Product Categoryfrom AFS
E # of Units Shipped of Same Size and Product Category from AFS
In the event that the item is from a Product Category that hasn't shipped via an Alternative Fulfillment Site in the last 90 days, the model will use information from all items of the same Size Category.
3 Literature Review
In this chapter is a review of research journals and papers that were studied to look at the topics that were relevant to this thesis. These topics include:
1. Current Industry Practices and Trends for Choosing Fulfillment Options -a review of the current methods used by companies to decide how to fulfill items to customers
2. Current Industry Practices and Trends for Determining Staffing - methods used to detennine how many individuals are needed in a process to reach a given throughput
3.1 Current Industry Practices and Trends for Choosing Fulfillment Options
In 2008 Rabinovich wrote an article which provides a very in-depth analysis of the advantages and disadvantages brought on by the use of drop-ship fulfillment, but didn't provide a direct comparison to the use of a fulfillment center network similar to Amazon's (Rabinovich, 2008). Rabinovich,
however, dives deeper into Internet retail in his 2011 book, which provides an in-depth analysis on the management of an online retail business; Amazon is used as one of many examples on how to do so
successfully (Rabinovich, 2011). In David Simchi-Levi's Operations Rules, the author points out how Amazon's strategy of product availability plays into how it operates differently from other retailers (Simichi-Levi, 2010). Because of this focus on availability Amazon strives to continually increase the scope of products it sells, but also keeps a careful eye on profitability. To maintain profitability, Amazon continues to evolve and former practices in these readings are augmented by new techniques, such as the Alternative Fulfillment Sites addressed in this thesis. The potential for increasing product scope drove this research to focus on attributes that segment Amazon's products on the factors that are theorized to have the largest effect on fulfillment costs, weight and size. Although there are many other factors for consideration, the research hopes to help Amazon drive to the correct fulfillment decision with little initial information, which is often the case when introducing new products.
3.2 Current Industry Practices and Trends for Determining Staffing
In 1999 Ravi Anupindi provides a great framework for determining process capacity in his book Managing Business Process Flows (Anupindi, 1999). Chapter 5 in particular, details how to utilize Unit Load to arrive at a capacity per worker. Prior research from MIT Leaders for Manufacturing Alumni
Shelia J. Bragg's Thesis' showed how pivotal product size is in the sorting step of the fulfillment process, but was focused on only that step of the fulfillment process (Bragg, 2003). With this in mind the research of this thesis found that size becomes a factor for not just sorting, but for the entire
fulfillment process, and because of this, drove to a method of finding processing rates for various size segmentations.
4 Creation of Fulfillment Decision Tool
The Fulfillment Decision tool is used to get an understanding of the most cost optimal fulfillment option (Drop Ship, FC, or AFS) for certain shipment volumes of items of various Size Categories. This analysis is done by gathering historical data on the performance of SKUs of varying Size Categories through different fulfillment options, and comparing the costs for varying weekly unit demand volumes.
4.1 Methodology of Fulfillment Decision Tool Development
This analysis focused on only operational costs, as those are the costs that drive the daily fulfillment decision making at Amazon. The costs considered are below in Table 1.
Drop Ship Fulfillment Center Alternative Fulfillment Site
Variable Cost Per Unit Inbound Transportation Cost Variable Labor Cost Per Unit Outbound Transportation Cost Variable Labor Cost Per Unit Site Rental Cost
Storage Costs Additional Fixed Costs
Throughput Costs Outbound Transportation Costs Outbound Transportation Costs
Table 1: Costs Analyzed for Fulfillment Decision Model
During tool development it was noted that there was high variability of fulfillment costs when only segmenting the data by product size. Because of this variability it was determined that in addition to using the mean, quartiles of the data could be used to look at the cost relationships. In the case of the analysis done for this thesis, data from the 3r' quartile (i.e. the value that is greater than 75 percent of the
data set) was compared amongst fulfillment options.
The key output of this model is to investigate how the cost relationships between the three options compare as quantity of items fulfilled increases. For most costs, multiplying the costs per unit with the
quantity accurately reflects these costs as quantity increases. Two costs that need a more sophisticated method of modeling are inbound transportation costs and variable labor costs for AFSs.
For inbound transportation, three inbound transportation modes were considered: Small Parcel (SP), Less than Truckload (LTL) and Truckload (TL). Amazon has particular weight requirements when choosing which transportation mode to use and the aggregated weight of the quantity of goods to be fulfilled determines which mode and thus which per unit rate to use for this tool.
As mentioned earlier, in Chapter 2, Alternative Fulfillment Sites require a minimum number of associates due to Amazon safety policies. Because of this minimum number, variable labor cost doesn't just mean the time spent on fulfillment tasks, but all the billed time an employee is on site. This means
that lower associate utilization will lead to a higher per unit costs. This cost shows a per unit reduction as associate utilization increases.
4.2 Tool Findings
Analysis is broken down by four Size Categories. Size categories are determined by the weight and physical dimensions of a product and can be broken down as either, Small, Medium, Large or Heavy Bulky, based on the proprietary standards used by Amazon.
Although fixed costs are an important cost to consider during Amazon's peak season, there is a good portion of time where space in an FC is not fully utilized. In periods of low utilization the fixed costs of the FC's storage facilities and equipment can be considered sunk, because the costs are incurred no matter the fulfillment option (i.e. FC's won't be closed because of a temporary period of low volume). Because of this, analysis is performed with and without FC fixed costs.
The cost vs. volume curves are essentially cumulative costs of each individual item being fulfilled, and therefore a certain amount of linearity is to be expected. Volume discounts for
transportation or with certain vendors can alter this linearity of the resulting cost relationships. It is also assumed for this analysis that each of the three fulfillment options has the capacity to meet the demand being analyzed.
Finally, sensitivity analysis of the costs for fulfilling via Alternative Fulfillment Sites was performed by applying a multiplier to the shipping costs, since shipping costs are the most variable factor in fulfillment for Amazon. The value of this multiplier was raised until AFS's were no longer a cost effective option no matter the volume of product being shipped.
Small Item Analysis
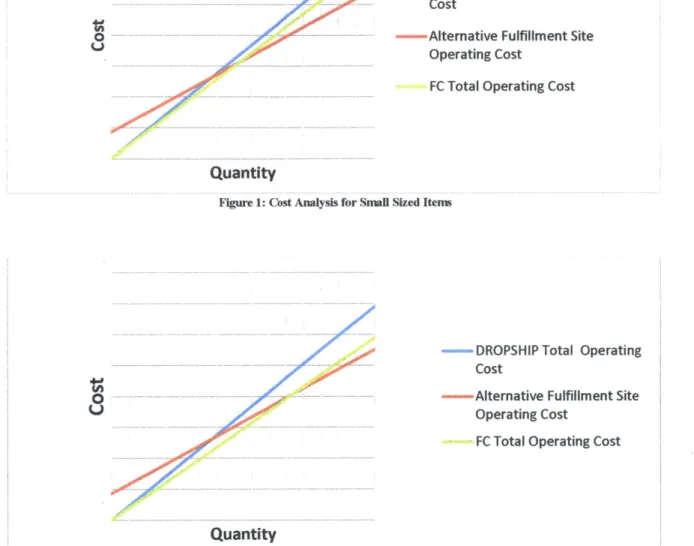
Items in the Small Size Category initially show a cost advantage via FC fulfillment (Figure 1), with Drop Ship costs slightly higher. The driver of this difference is due to transportation costs. Though FCs have both inbound and outbound costs, these costs combined are approximately 25% less than just the outbound costs of Drop Ship Sites. This is due to the less optimal inventory distribution at Drop Ship Sites in comparison to FCs. The labor costs in AFSs initially prove to be a disadvantage due to the requirement of having all of an associate's scheduled time billed, even when not fully utilized. This isn't the case for FCs, where associate can work on different products if a particular item doesn't have the demand necessary to keep an associate fully utilized,. As the quantity increases AFSs begin to become a more cost optimal fulfillment method, due to the processing efficiency that comes from a simpler
fulfillment process. Sensitivity analysis shows that in the case of small items, AFS are never cost optimal when its shipping costs are increased by 40%.
With fixed costs eliminated from consideration, FC fulfillment shows an even greater financial advantage initially (Figure 2). Eventually the labor efficiencies of Alternative Fulfillment Sites once again make it the best option, but the quantity required to do so increases by 40%.
- DROPSHIP Total Operating Cost
0 -Alternative Fulfillment Site
Operating Cost
FC Total Operating Cost
Quantity
Figure 1: Cost Analysis for Small Sized Items
DROPSHIP Total Operating
Cost
- -- Alternative Fulfillment Site
Operating Cost
FC Total Operating Cost
Quantity
Figure 2: Cost Analysis for Small Sized Items with No Fixed Costs
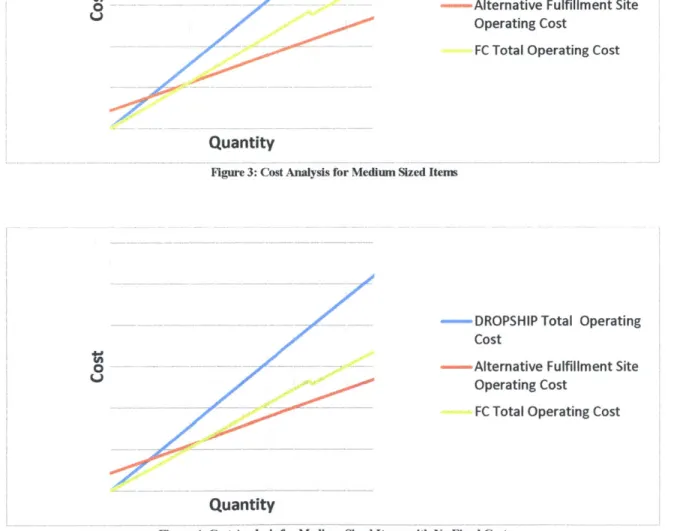
Medium Item Analysis
Similar to Small Sized Items, FCs show an initial cost advantage against both Drop Ship and Alternative Fulfillment Sites, when fulfilling Medium Sized Items (Figure 3). Once again transportation costs drive this cost advantage until Alternative Fulfillment Sites can reach a demand that leads to more labor utilization and thus increased cost efficiency. As inbound freight amounts increase enough to make a full truckload of product a viable option there is a slight drop in the FC costs as noted by the dip in the
FC line. Sensitivity analysis shows that increasing AFS shipping costs by 120% cause the option to no longer be viable in comparison to the other fulfillment options, no matter the volume of product.
Eliminating fixed costs from consideration means that a quantity 20% higher is required to make Alternative Fulfillment Sites the most cost effective option as shown in Figure 4.
-DROPSHIP Total Operating Cost
0 - Alternative Fulfillment Site
Operating Cost
FC Total Operating Cost
Quantity
Figure 3: Cost Analysis for Medium Sized Items
-- DROPSHIP Total Operating Cost
(- - Alternative Fulfillment Site
Operating Cost
FC Total Operating Cost
Quantity
Large Item Analysis
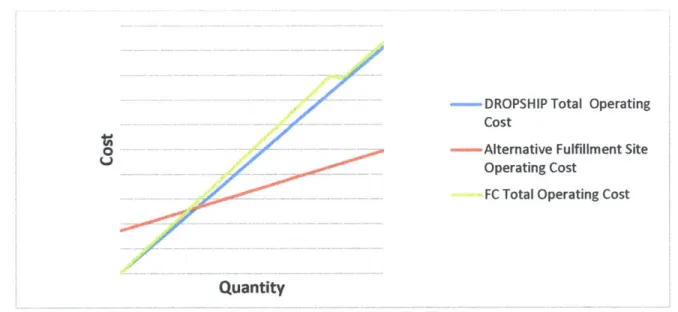
For Large Items Drop Shipment is the initial leader in cost, due to Fulfillment Centers losing their transportation cost advantage and the increase in fixed storage costs, as shown in Figure 5. As quantity increases however Alternative Fulfillment Sites once again overtake Drop Ship and become the more cost effective option, due to lower outbound transportation costs and lower variable costs at higher associate utilization. With sensitivity analysis, it was determined that a 160% increase in shipping costs for AFS sites make the option unviable financially.
Eliminating fixed costs gives Fulfillment Centers the advantage, because Drop Ship Variable Costs that are billed to Amazon outweigh the variable labor costs in an FC (Figure 6).
DROPSHIP Total Operating
Cost
-- Alternative Fulfillment Site Operating Cost
FC Total Operating Cost
Quantity
-- DROPSHIP Total Operating Cost
-- Alternative Fulfillment Site Operating Cost
FC Total Operating Cost
Quantity
Figure 6: Cost Analysis for Large Sized Itens with No Fxed Costs
Heavy Bulky Item Analysis
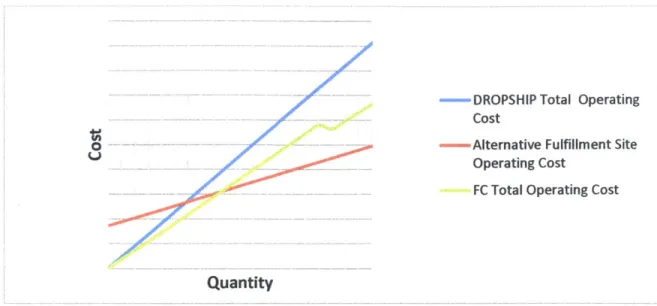
The Heavy/Bulky analysis may be skewed due to the recent addition of this Size Category to the Alternative Fulfillment Site Network. The few items that were being fulfilled via Alternative Fulfillment Sites during the time of this analysis were heavier items such as Big Screen TVs, which fall on the more expensive end for transportation. The FCs show a financial disadvantage due to fixed costs (figure 7), even though FC transportation costs (both inbound and outbound) are slightly lower than Drop Shipping. Once Alternative Fulfillment Sites reach higher labor utilization, they become more attractive than Fulfillment Centers but never outperform Drop Shipping. Sensitivity analysis of AFS for Heavy Bulky items show that a 40% increase in shipping costs causes them to no longer be viable against Fulfillment Centers.
Removing the FCs fixed costs makes it a far more attractive option financially, beating all other fulfillment options handily, as shown in Figure 8. Because of this it makes sense to fulfill items via FCs when site space isn't at a premium.
-- DROPSHIP Total Operating Cost
-- Alternative Fulfillment Site
0Operating Cost
FC Total Operating Cost
Quantity
H~gure 7: Cost Analysis for Heavy/Bulky Sized Items
DROPSHIP Total Operating Cost
0 - Alternative Fulfillment Site
Operating Cost
FC Total Operating Cost
Quantity
5
Creation of Total Landed Cost Tool
The Total Landed Cost Tool is used to analyze the historical costs of fulfilling a particular set of SKUs through three Fulfillment Options: Alternative Fulfillment Sites, The Amazon Fulfillment Center Network, and via the Drop Ship Network. With this tool the user can gain insight into what cost factors are the most pertinent to a particular set of SKUs and drive to make the most cost effective fulfillment decisions.
5.1 Methodology of Total Landed Cost Tool Development
This model investigates not only operating costs, but also the capital costs that come from each fulfillment option. Table 2 shows all the costs that are considered for this tool.
Fulfillment Center Alternative Fulfillment Site
Revenue Revenue Revenue
Cost of Goods Sold Cost of Goods Sold Cost of Goods Sold
Variable Cost Per Unit Inbound Transportation Cost Variable Labor Cost Per Unit Outbound Transportation Cost Variable Labor Cost Per Unit Site Rental Cost
Storage Costs Additional Fixed Costs
Throughput Costs Contra COGs
Capital Storage Costs Capital Start Up Costs Capital Throughput Costs Inventory Holding Costs
Inventory Holding Costs Outbound Transportation Costs Outbound Transportation Costs
Table 2: Costs Analyzed for Total Landed Cost Tool
Chapter 2 details how each of these costs are determined. As mentioned, in the case a SKU has not been fulfilled via a particular fulfillment mode the tool will estimate its performance based on the average performance of products of the same Size and Product Category.
5.2 Tool Findings
To analyze the effectiveness of using average Size and Product Category as a predictor of costs, 500 products were gathered and the actual costs were compared to the estimated costs from the tool. The
Forecasted Cost-Actual Cost
equation Actual Cost was used to find the Percent Difference for each modeled cost and measure the performance of the model predictors used.
With the Alternative Fulfillment Program being relatively young, the Product Categories to analyze were limited. The Book Category is a category with a lot of sales volume through all three fulfillment options and long history with the Alternative Fulfillment Program, for this reason it is the category that was used for this analysis.
DS Outbound Cost
Using the method defined, Drop Ship Outbound Transportation Costs showed an average Percent Difference between the modeled and actual costs of 113%, with a large number of extreme outliers driving this mean up. Analysis via the Shapiro-Wilk test showed that the distribution of these differences was not normal.
DS Outbound Percent Difference
70 -60 50 40 30 20 10 0Figure 9: DS Outbound Cost Percent Difference
FC Inbound Cost
Inbound Costs for Fulfillment Centers had an average Percent Difference of 45%. Despite a better fit analysis via the Shapiro-Wilk test showed that the distributions of these errors were not normal.
FC Inbound Percent Difference
120 100 80 60 40 20 0U
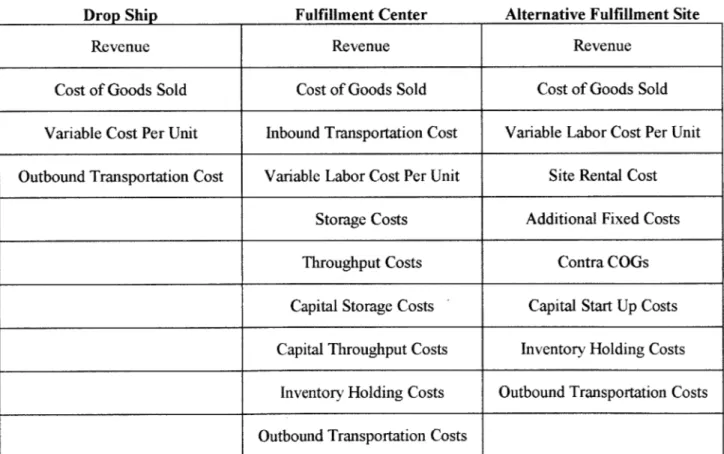
FC Outbound Cost
Outbound Transportation Costs for Fulfillment Centers had an average Percent Difference of 33%. Once again analysis via the Shapiro-Wilk test showed that the distribution of these differences were not normal.
FC Outbound Costs Percent Difference
120 100 80 60 40 20 0
Figure 11: FC Outbound Cost Percent Difference
AFS Outbound Cost
Outbound Alternative Fulfillment Center Costs using the method of this model showed an average Percent Difference of 34% again analysis via the Shapiro-Wilk test showed that the distribution of these errors were not normal.
AFS Outbound Costs Percent Difference
100 80 60 40
20
Summary
With the large number of outliers skewing the data it makes sense that many of these distributions of residuals were found to be non-normal. Because of this lack of normality, using the mean based on just the product size and category doesn't provide a strong fit for estimating cost data for items within the
same Size Category. For future analysis more factors, such as location of the AFS, should be added to the prediction portion of the tool to provide a better fit of the data.
6 Creation of Site Setup Tool
The purpose of the Site Setup Tool is to determine the square footage and head count required to run a new Alternative Fulfillment Site for peak and non-peak demand periods. The Site Setup Tool is broken into two distinct parts, a Head Count Model and a Square Footage Model. The main input of the model is a list of SKUs, their physical characteristics (weight and size), their historical peak and non-peak average units shipped weekly and their forecasted average weekly demand at peak and nonpeak.
6.1 Process Rate Analysis
Unlike FCs data on process step rates isn't automatically gathered due to minimal IT
infrastructure at Alternative Fulfillment Sites. To obtain the rates needed for development of the tool, AFS employees in the field helped gathered inbound and outbound rates at 3 sites.
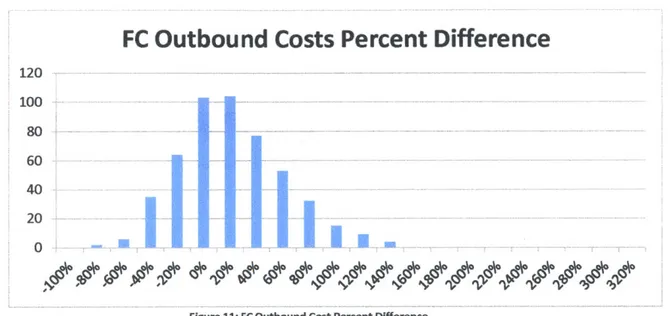
The tables below show how AFS rates fare against FC rates for three sites.
Because FCs have steps that can't be performed at AFSs, only the applicable steps are compared between the two options. Table 3 shows the difference in efficiency found at these sites compared to the FC
network average using the equ Average AFS Rate-Average FC Rate . In all cases the Alternative
Fulfillment Site showed higher efficiencies.
SITE A 212.31%
SITE B 26.35%
SITE C 52.76%
Table 3: Inbound Rate Difference of AFS vs. FC
For the outbound rates the processes pick, pack and ship are the rates used. The FC pack takt times are discounted 90% for items that can be shipped within their original box, to ensure a fair comparison. Table 4 and 5 show the difference in efficiency for outbound and of the entire fulfillment process.
SITE A 27.04%
SITE B 66.05%
SITE C 60.23%
Table 4 Outbound Rate Difference of AFS vs. FC
SITE A 34.03%
SITE B 65.75%
SITE C 56.33%
Table 5: Entire Process Rate Difference AFS vs. FC
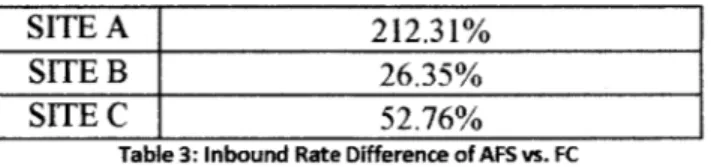
To get better insight into what causes these differences and provide better rates for use in the model, a short visit was taken to do time studies at the sites. Due to very few opportunities to see the inbound process little data was gathered, but there was substantial amount of data gathered on the outbound steps. The Table 5 below highlights the findings.
% Pick AFS Efficiency Difference
% Single Item Pack Efficiency Difference
% Multi Item Pack AFS Efficiency Difference
AFS Small 61.96% -11.09% 11.10%
Items
AFS Large 308.01% Not Applicable 36.08%
Items
Table 6: Picking and Packing Efficiency Differences for AFS vs. FC
From observations at the sites the key reason for the difference in efficiency for outbound is found in the picking step. Due to the smaller square footage, picking rates are drastically higher,
especially for the large non-sortable items, where multiple trips maybe required for a group of orders. In addition the smaller SKU selection seemed to produce familiarity with how to handle items due to the much higher likelihood of seeing similar SKU.
Packing rates do not see as much of an advantage due to the lack of technology at these sites in comparison to normal FCs. No conveyor system, and no previous identification of boxes needed to pack proved to slow the associates down a bit. There were a number of instances noted where an associate had to change the box for an order, because they wrongly predicted the box to use. The outbound rates more
than made up for the packing inefficiencies, which makes most AFS sites more efficient than their FC counterparts overall.
6.2 Methodology of Head Count Tool Development
Due to the large variety of SKUs the physical characteristics were used to bucket the SKUs into Size Categories (Small/Medium/Large/Bulky). Each Size Category was given its own rate, based on the average rates found during the time studies at these sites, for the various processes. With a known rate, this information is translated to takt time. The user has inputs to control the percentage of shipments that
will be Singles, which are customer orders ofjust one item, and percentage of additional preparation that may be required per SKU. The total time to process one unit is as follows:
Recieve Time + Stow Time + (%Single Pack * Single Pack Time) + (% Multi Pack *
Multi Pack Time) + (% Additional Preparation * Additional Prep Time) + Ship Time
Depending on the user input of direct hours per day, a units per day rate is found. With this daily rate the number of associates needed per SKU is then found, and aggregated across all SKUs to get the head count for the whole site. Associate numbers were rounded up, if there was a "partial worker". For example, if the model required 2.12 associates to process the demanded quantity, then 3 was the
suggested number of associates required. This rounding was done to be biased towards over staffing, because of Amazon's focus on meeting customer demand.
6.3 Methodology of Square Footage Tool
The Square Footage tool uses the physical dimensions to determine the cubic dimensions for each unit. Based on a given replenishment schedule, the inventory needed on hand to meet the expected weekly demand is determined. For example, if a site is replenished every 2 weeks, then inventory on hand would have to be enough to cover those two weeks. With the cubic dimension of the units known,
the items were then bucketed into their Size Categories. With the Size Category and inventory required determined, the model decides the rules for how items are stowed (on pallets or stowed in bins). All this information is aggregated for every SKU to determine the total square footage needed for storage. The user then has the option to determine what arrangement the pallets and bins will be arranged in. Items that require two or more pallets worth of storage can be stored back to back in what is referred to as deep pallet spots. Based on the arrangement, aisle space is also determined. In addition based on the demand of the site, the number of pallets for storage of boxes, supplies, and number of work stations is predicted.
Storage Square Footage
The total cubic feet of product shipped is found via the dimensions of each SKU, and aggregating these volumes. With the total storage volume found the user must ensure the appropriate number of days of inventory cover are entered into the model. This is dependent on the delivery schedule of inventory at the site. With days of inventory cover known, the inventory cubic footage for a particular SKU can be found with the formula,
# of Units Shipped * Cubic dimensions per Unit * # of Days of Inventory Cover# of Work Days
Items defined as Sortable by Amazon standards, are placed in Storage Bins unless they have enough cubic volume to fit % of the volume of a Pallet. Non-Sortable large items are placed on pallets. The model allows the user to determine the cubic dimensions of the storage devices (Bins and Pallets) as well as the expected utilization rate. With the cubic dimensions per storage device known, the number of required
Total Required Inventory Cube for SKU
storage devices can be found via the formula Cube of Storage Device . This data is then aggregated across all SKUs to provide the total number of storage devices required at the site. With the floor square footage known for each device type the square footage for inventory storage can be determined.
Work Station Square Footage
To determine the amount of square footage needed for workstations, the amount of time spent on outbound processes is aggregated by Size Category. This time is then translated to # of associates needed for each Size Category. The user then determines how many associates can work at a Work Station for a particular Size Category, which in turn determines the total number of work stations required. Size
Categories that have less than one associate are aggregated to determine the amount of additional stations needed.
Aisle way Square Footage
To find the square footage for Aisle ways the user determines the configuration used to store Sortable Storage Bins and Non-Sortable Pallets. This information places the storage devices in groups with an Aisle way diameter of space around them. The equation,
Storage Space with surrounding Aisle Ways - Inventory Storage Space, provides the amount of square footage due to Aisle ways.
In-Bound Staging Square Footage
The In-bound staging area is the area required to store items prior to receiving into the storage area. This area is determined in the same manner as Storage Square Footage, but has its own days of coverage input. In most cases associates should be able to receive items in this area within 24 hours; therefore Days of Staging Cover has a default value of 1.
Box Storage Square Footage
To get the number of Box Pallets required, at a site the number of boxes needed per SKU is determined. The box size for the SKU is determined by comparing the cubic dimensions of the SKU and finding the box with dimensions higher than the cubic dimensions of that SKU, from a list of Boxes. Because there is the possibility of orders of more than one product, the box required for multi-item orders is found by finding the box with a cubic dimensions higher than double of the cubic dimensions of the particular SKU. With the Box type known, the number of boxes per SKU can be found with the equation
(%Single Pack * Units Shipped) for the single box type and (%Mulit Pack * Units Shipped) for the multi box type. This is aggregated for all SKUs to determine the number of each box type required. Data was obtained from the procurement organization on how many boxes can fit on a Pallet and thus the # of pallet square footage can be determined.
Inbound Processing Carts
To estimate the # of processing carts required, the amount of associate time spent on inbound processes is aggregated across all SKUs. With the given associate schedule the number of associates that should be dedicated to inbound is derived. For every associate dedicated, there is an inbound cart for them, and one extra cart is added to this number as a spare. The square footage for storing each cart is the same square footage as a pallet.
6.4 Tool Results
To validate the results of the associate Headcount portion of the Site Setup Tool, the appropriate model inputs were placed in the model for 3 different sites and compared to the actual hours worked at these sites. Because the hours reported by the weekly reports used for comparison included hours that may not be value added, the model input for value added hours work was adjusted with the assumption that out of eight hours of work, one hour would be utilized for these non-order processing activities.
Table 6 shows the average Percent Differences found from comparing the modeled head count hours to actual hours of work performed at these sites in the equation Forecastec urs-Actual Hours
Site A 2.64%
Site B 3.18%
Site C 9.98%
7
Recommendations for Further Research
7.1 Seasonal Sites
With the tools developed from this research Amazon has the opportunity to further its Alternative Fulfillment Program substantially. One area of caution with implementation that will need further research is the seasonality of demand that is common with many of the products in Amazon's catalog. With such a wide array of products one can easily envision a subgroup of SKUs being financially advantageous in different times of the year. This could create an excellent opportunity for Amazon to create seasonal Alternative Fulfillment Sites that take advantage of the savings advantage during times of high demand, and then are shutdown once the financial advantage of Alternative Fulfillment is lost. Though the tools developed provide inputs for the opening of these sites, costs that may be incurred due to closing should be added as a part of this analysis to ensure a comprehensive understanding of the financials. By adapting their supply chain more frequently through the year, Amazon can drive to substantial savings if executed properly.
7.2 Additional Factors for Total Landed Cost
As shown by the results of the Analysis of the estimation portion of the Total Landed Cost model, more factors than product size and product category are necessary to provide a more accurate estimate of
costs for new products to Amazon. The complexity that customer demand places on modeling is one of many components that would need to be tackled to drive toward further accuracy.
7.3 Improvement of Data Collection at Alternative Fulfillment Sites
As noted earlier in this research, AFSs do not have the same automated methods to provide real-time fulfillment process information as their FC Counterparts. Although information on overall inbound
and outbound rates per day can be estimated, the lack of granularity can be a hindrance to process standardization and improvement as this program expands. The limited IT structure of these sites means
that new methods and systems would need to be developed, but the increased transparency will allow far better management of the Alternative Fulfillment Program.
8 Conclusion
The purpose of this research was to help use simple quantitative methods to strategically advance a new fulfillment program at Amazon. What becomes apparent in this research is how varying degrees of complexity are required for the various pieces of order fulfillment to drive to model accuracy.
The Site Setup Tool was able to use the simplicity of product size to drive to accurate modeling of process rates and will help Amazon staff their sites with little worry of over or underutilization of personnel. It can be theorized that the standardization of their fulfillment process no matter the location or product allows this simplicity in modeling. By having a system with little variation, estimating the outcome of given inputs becomes a far easier task.
On the other hand the Total Landed Cost Tool showed that segmenting simply by product size and category doesn't always drive to the desired accuracy. With the complexity of customers in an innumerable number of locations, a wide array of shipment methods, and numerous other factors, cost prediction becomes a much more difficult task. Though simple segmentation can drive to simple yes or no decisions of fulfilling through a certain method or not, it becomes difficult to estimate a more precise understanding of the quantitative benefits of a particular decision. Nonetheless this simplicity can still be useful, as these methods have provided Amazon characteristics of product mixes to begin expansion of the Alternative Fulfillment Program. Work from this research has the potential to double the size of this program, adding substantial savings for Amazon.
Clearly the dichotomy between complete simplicity and accuracy is a consideration in modeling. Though striving for ease of use is key in ensuring future use, one most make sure that the tool still leads the user in the right direction. With the drive to continually introduce new products, even more
complexity is in store for the future for fulfillment. This complexity will drive Amazon to continue searching for new ways to protect profitably while enabling growth. Whether it is new payment terms with suppliers or new methods of fulfillment like the Alternative Fulfillment Program, a great deal of innovation will be required. As research continues to advance in this field getting an understanding of
how far modeling needs to move towards simplicity or accuracy will be an ever moving target, but will be key to Amazon's continued success as the company continues its growth.
Bibliography
Rabinovich, E., Rungtusanatham, M., & Laseter, T. M. (2008). Physical distribution service performance and internet retailer margins: The drop-shipping context. Journal of Operations Management, 26(6), 767-780.
Rabinovich, E. (2011). Internet retail operations integrating theory and practice
for
managers. Location: Taylor & Francis.Simchi-Levi, D. (20 10). Operations rules: Delivering customer value through flexible operations. Cambridge, Massachusetts: The MIT Press.
Anupindi, R. (2005). Managing business process flows (2nd ed.). Location: Pearson Education Inc. Bragg, S. (2003). Analysis ofsorting techniques in customerfiulfillment centers. Location: Massachusetts
Glossary
AFS -Alternative Fulfillment Site COGS- Cost of Goods Sold DS -Drop Ship/Drop Shipper FC- Fulfillment Center
Size Category -The grouping of products based on the weight and physical dimensions of the product. The four categories are: Small, Medium, Large and Heavy Bulky.