Publisher’s version / Version de l'éditeur:
Construction Technology Update, 2014-02-01
READ THESE TERMS AND CONDITIONS CAREFULLY BEFORE USING THIS WEBSITE. https://nrc-publications.canada.ca/eng/copyright
Vous avez des questions? Nous pouvons vous aider. Pour communiquer directement avec un auteur, consultez la première page de la revue dans laquelle son article a été publié afin de trouver ses coordonnées. Si vous n’arrivez pas à les repérer, communiquez avec nous à [email protected].
Questions? Contact the NRC Publications Archive team at
[email protected]. If you wish to email the authors directly, please see the first page of the publication for their contact information.
NRC Publications Archive
Archives des publications du CNRC
For the publisher’s version, please access the DOI link below./ Pour consulter la version de l’éditeur, utilisez le lien DOI ci-dessous.
https://doi.org/10.4224/21274784
Access and use of this website and the material on it are subject to the Terms and Conditions set forth at
Demand-responsive commercial buildings
Newsham, Guy; Piette, Mary Ann
https://publications-cnrc.canada.ca/fra/droits
L’accès à ce site Web et l’utilisation de son contenu sont assujettis aux conditions présentées dans le site LISEZ CES CONDITIONS ATTENTIVEMENT AVANT D’UTILISER CE SITE WEB.
NRC Publications Record / Notice d'Archives des publications de CNRC:
https://nrc-publications.canada.ca/eng/view/object/?id=c52b4228-e3e2-4b91-986d-dbba8ba72946 https://publications-cnrc.canada.ca/fra/voir/objet/?id=c52b4228-e3e2-4b91-986d-dbba8ba72946NRC Construction
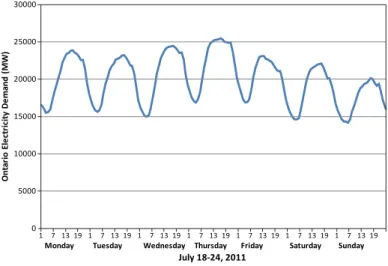
Demand for electricity varies dramatically by time of day, day of week (Figure 1), and season. Utilities must be able to meet this demand continuously and instantaneously. In particular, they must meet peak demand on the very highest usage days, even though such levels of demand occur for only a few hours per year. If the utility fails to meet this demand, then a blackout or brownout will occur, with damaging economic and societal con-sequences.
Meeting demand at peak times is traditionally done by start-ing generators designed only for use at such times (so-called
“peaker plants”) and by buying power from neighbouring elec-tricity providers. Both of these approaches may be ineffi cient and expensive. An alternative is to deploy policies and mechanisms to lower demand during peak periods. One example is the intro-duction of time-of-use pricing, whereby higher electricity prices are charged during periods of higher demand to encourage cus-tomers to use less electricity during these periods. These tariff structures are usually applied over whole seasons but may not be effective enough on the highest-use days.
Demand-Responsive
Commercial Buildings
To reduce the electrical generation required to meet peak demands and maintain grid stability, utilities are implementing
policies and mechanisms to lower usage during peak periods. This Update discusses one strategy known as demand
response, whereby customers get direct requests from the utility to temporarily lower usage during periods of very high
demand.
NRC CONSTRUCTION
TECHNOLOGY UPDATE
No. 81, February 2014
By Guy Newsham and Mary Ann Piette
0 5000 10000 15000 20000 25000 30000 1 7 13 19 1 7 13 19 1 7 13 19 1 7 13 19 1 7 13 191 7 13 19 1 7 13 19 Ont a ri o Ele ct ric it y De ma nd ( M W )
Monday Tuesday Wednesday Thursday Friday Saturday Sunday July 18-24, 2011
Figure 1. Hourly total demand for electricity in Ontario for a week in July
2011. On each day of the week, demand was lowest overnight (around 5 a.m.) and highest in the afternoon (around 4 p.m.). For any given hour of the day, demand also tended to be higher in the middle of the working week, and lower on the weekend. In this particular week, the highest usage hour was 4 p.m. on Thursday July 21 (25450 MW) and the lowest usage hour was 6 a.m. on Sunday July 24 (14177 MW).
Summer peaks vs. winter peaks
Most research and application has been conducted in the context of summer peaks, which occur in late afternoon as cooling load rises. During the last decade, peak load concerns came to prominence in California following the 2001 blackouts. Most DR automation development originated in California, including that led by Lawrence Berkeley National Laboratory. In Canada, only Ontario has peak demand during the summer, and it faces similar problems to California. Other regions in Canada have peak demand during the winter.
NRC’s work has focused on conditions in Ontario, where summer peak loads had been growing faster than base loads. Summer peaks in Ontario tend to occur in the afternoon when air conditioning loads dominate. Winter peaks tend to occur in early morning or evening, as lighting loads overlap with the highest use of electricity related to heating. Most of the information presented here is in the context of summer peaks, but many of the same principles can be applied to winter peaks.
Construction Technology Update No.81
Another strategy is known as demand response (DR), whereby customers get direct requests from the utility to temporarily lower demand during specifi c very-high-demand days and hours. This approach has been in place for many years for large industrial customers, but over the past decade there has been growing interest in implementing DR in commercial buildings. In commercial buildings, the principal electric loads during peak periods are HVAC (heating, ventilating and air conditioning) systems and lighting. As a result, these are the main targets for DR.
How much can peak loads be reduced?
HVAC and lighting in buildings are usually designed and operated to deliver optimal comfort conditions for occupants. In its simplest form, DR requires that service be curtailed. Curtailment may only be temporary and only last for a few hours, but during those few hours, conditions may move outside traditional comfort zones. In more advanced systems, HVAC service curtailment may be avoided by the use of active or passive storage systems, or by providing “over-service” prior to an event (e.g., pre-ventilating to create indoor air with low levels of pollutants, allowing for a reduction of ventilation during DR). However, these approaches are not yet mature.
It would be preferable to meet DR load reduction goals with minimum hardship to occupants, but until recently there was little human factors data to indicate the extent of service reduction that could be tolerated. NRC embarked on a series of studies to defi ne reasonable limits for service curtailment.
Initially, NRC conducted controlled laboratory experiments in simulated offi ce environments. Research participants engaged in offi ce work were exposed to changes in environmental conditions representative of DR service curtailments. Researchers looked for evidence of hardship through responses to questionnaires, task performance, and control interventions. Results suggested that:
1. Electric lighting can be dimmed without hardship by:
• 40%+ introduced smoothly over a span of 10 seconds in areas with daylight;
• 20% introduced smoothly over a
• 40%+ introduced smoothly over a span of 30 minutes in areas with no daylight.
2. Temperature can increase without hardship by
• 1.5°C introduced smoothly over a span of 2½ hours. Next, NRC tested these lighting DR strategies in real buildings in Ontario—a government offi ce building and a college campus. Building occupants knew that these trials would take place on some summer days, but they were not told which days. As an in-dication of hardship, researchers recorded whether there was any increase in complaints about lighting to the facility manager. On the college campus they also looked at whether there was an in-crease in the use of manual dimmers mounted on the wall in each room, indicating attempts to override the lighting reductions. In the offi ce building, two afternoon DR trials were conducted, which dimmed lights by up to 35% over a period of 15-30 minutes. The power reduction achieved was 5.2 kW (23% of total lighting power), and 5.3 kW (24%), respectively. At the campus site, three afternoon DR trials were conducted which dimmed lights by up to 40% over a period of 1-30 minutes. The power reduction achieved was 15.2 kW (18%), 7.7 kW (14%), and 11.3 kW (15%), as shown in Figure 2. There was no indication of occupant hardship from these events.
Figure 2: Lighting power for the campus lighting system, for the 71 weekdays of the study
(excluding public holidays). On each day, lighting use was lowest around 6 a.m. (10 to 25 MW depending on the day) and highest around 11 a.m. (70 to 90 MW depending on the day). Dimming lighting was deployed as a demand response strategy on three days. On June 4, dim-ming was initiated at 2:30 p.m. over a 30-minute period and the power reduction achieved was 15.2 kW (18%). On June 27, dimming was initiated at 2:15 p.m. over a 15-minute period and
0: 00 1: 00 2: 00 3: 00 4: 00 5: 00 6: 00 7: 00 8: 00 9: 00 10: 0 0 11 :0 0 12: 0 0 13: 0 0 14: 0 0 15: 0 0 16: 0 0 17: 0 0 18: 0 0 19: 0 0 20: 0 0 21: 0 0 22: 0 0 23: 0 0 Time 0 10 20 30 40 50 60 70 80 90 100 Pow e r, kW 04/06/2008 27/06/2008 17/07/2008
NRC Construction
Widespread implementation
Over a similar timeframe, researchers at Lawrence Berkeley Na-tional Laboratory (LBNL) were thinking about how to facilitate commercial building DR on a grand scale. They developed a communication standard called OpenADR (Open Automated De-mand Response), which enables building operators to pre-design DR strategies that are triggered automatically by a price or similar signal from the utility and distributed via the internet. Different levels of DR can be implemented depending on the severity of the signal. For example, if the price is high—suggesting mild grid stress—temperature setpoints would be increased by 1.5°C; but if the price is extremely high—compatible with a potential grid emergency—temperature setpoints would be increased by 3°C. LBNL began trials of early versions of OpenADR in 2003 and by the end of 2012, over 250 MW of DR were expected to be automated in California with this technology, which is now commercialized.
Over 40 companies have joined the OpenADR Alliance (http:// www.openadr.org/) which launched OpenADR version 2.0 in early 2012. Over half of this load reduction is from large indus-trial process facilities such as compressed air, steel recycling, and food processing.
The original efforts in OpenADR focused on summertime HVAC strategies (setpoint changes, ventilation reduction) because light-ing systems with the required level of control fl exibility are less common. This work has consistently shown that large load reduc-tions may be realized over several hours, with little evidence that occupants suffered hardship.
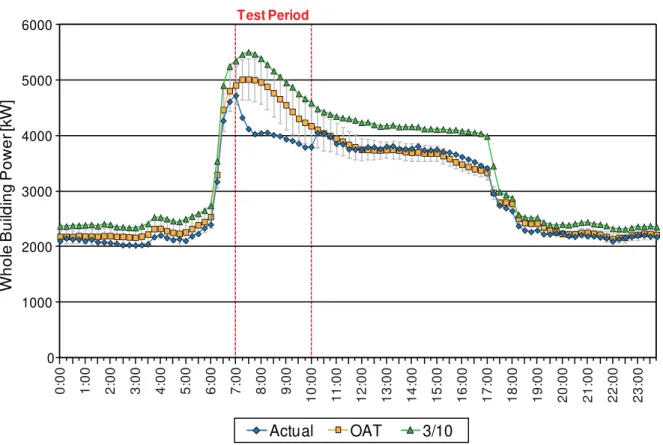
Recently, LBNL expanded its work to look at DR strategies to re-duce winter morning electric peak demand in commercial build-ings in cooler climates. Lighting demand was reduced in ways similar to the summer scenarios. Figure 3 shows the electric load shape for a winter morning DR event. This was a three-hour test in
0 1000 2000 3000 4000 5000 6000 0: 00 1: 00 2: 00 3: 00 4: 00 5: 00 6: 00 7: 00 8: 00 9: 00 10: 00 11 :0 0 12: 00 13: 00 14: 00 15: 00 16: 00 17: 00 18: 00 19: 00 20: 00 21: 00 22: 00 23: 00 W h o le B u ild in g P o w e r [k W ]
Seattle Municipal Tower, 3/5/2009 (Min OAT: 36 °F)
Actual
OAT
3/10
Test Period
OAT and 3/10 are two different (baseline) methods of estimating what the power draw would have been on this day in the absence of the demand response event. OAT is a model based on outside air temperature, and 3/10 is a model based on the 3 highest loads of the last 10 days.
Figure 3: Whole building power draw for a large offi ce building in the northwest United States. On a typical winter day
without demand response, power draw was lowest overnight (around 2000 kW) and highest around 7:30 a.m. (around 5000 to 5500 kW). On the demand response test day, the thermostat for the electric heating system was lowered from 22.2 to 20.0°C for three hours and the power reduction was about 600 kW.
Construction Technology Update No.81
a 111,500 m2 building. The DR control strategy involved resetting
the electric heating systems from 22.2 to 20.0°C (72 to 68°F) on 24 of 62 fl oors. With variable air volume HVAC, both the electric load and the fan load were lowered, resulting in a reduction of about 600 kW; there were no occupant complaints. (Even build-ings with gas heating could realize savbuild-ings by reducing fan usage.) As is common with DR, this project involved programming a re-covery strategy that reduced a rebound peak, in which additional power is required to return to normal operating conditions. At the conclusion of the DR period, the setpoint was increased slowly every 15 minutes and brought only ¼ of the equipment on every fi ve minutes.
A return to normal operations is important. While this work shows that occupants can tolerate sub-standard conditions dur-ing a relatively short period of grid stress, there are several other studies that indicate that conditions conforming to traditional recommended practice are appropriate to secure comfort in the long term.
Recommended practice documents
The need to respect absolute and fi xed indoor environment re-quirements was once a barrier to demand response, but attitudes are changing. LEED is now piloting a credit for DR, and there is an allowance for deviating from recommended lighting condi-tions for the purpose of DR in the new Illuminating Engineering Society of North America (IES) Recommended Practice for Offi ce Lighting (RP1). In addition, there are existing features and new proposed elements of building codes in California that improve DR capabilities in new buildings, which might be considered by other jurisdictions in the future.
Future direction
The DR strategies described here were implemented on the basis of infrequent implementation during rare periods of very high grid stress. There is now increasing interest—as part of the Smart Grid concept—of doing DR continuously. In this scenario, the changes in indoor environment conditions would not be nearly as extreme,
A guide to implementing demand response
There are many types of demand response (DR) programs available in North America. Program requirements are the fi rst thing a building owner should consider in implementing a de-mand response program. These requirements include features such as fi nancial incentives, duration of DR events, and how often and when the program might request DR events. Some programs offer DR audits, technical-fi nancial incentives, and automation systems. It is important to understand the build-ing’s historic electric load shape and the baseline calculations that may be used to evaluate DR performance.
In developing a plan for evaluating DR capabilities, it is useful to consider the control systems that are present in a build-ing. The more centralized a system is, the easier it will be to develop a DR strategy. The simplest response is a fully manual response in which a building operator switches off lights or equipment. A manual response may also involve a setpoint change to an HVAC control system. This is easy to do but re-quires the building operator to have a clear set of instructions on how to respond to an event.
The second level of sophistication is a semi-automated re-sponse, which involves the use of pre-programmed controls for DR, with a person initiating the execution of the pre-pro-grammed strategy. Such an example may involve program-ming a zone temperature reset schedule for all or some zones in a building.
The fi nal, most sophisticated level would be a fully automated
standard and basic internet communications. This technology uses software at the building that listens to signals sent by the electricity utility or grid operator. OpenADR is becoming avail-able through embedded software and all of the large control companies will be offering it. Most of today’s automation us-ing OpenADR is installed usus-ing gateway boxes that link the control system to the Internet. OpenADR version 1.0 has been in use since 2009 and version 2.0 was released in 2012 (http:// www.openadr.org/).
A number of private sector companies serve as aggregators for DR programs. These companies recruit the buildings, develop the DR strategies and procedures, and aggregate their load to participate in wholesale DR programs. Many of these compa-nies install electric meters and web portals to allow building owners to track the performance of their DR control strategy in real time during DR events. Aggregators provide payment to the participants after the site performs in a certain number of DR events.
DR programs may also be available from retail electric utilities. Some electric utilities offer incentive payments that building owners earn for participating in DR programs. These may in-clude reservation or capacity payments to make the electric load available for a program and participation payments based on how much power (kW) the load shape is changed relative to a baseline. Some utility programs are based on dynamic-, critical peak-, or peak day-pricing. In such cases, the owner
NRC Construction
Construction Technology Updates: a series of technical articles containing practical
information distilled from recent construction research.
For more information, contact NRC Construction, Ottawa K1A 0R6 Tel: (613) 993-2607; Email: [email protected];
Web: www.nrc-cnrc.gc.ca/ctu
but the power used by building systems might be modulated by a few percent at short timescales every day. This would boost overall grid effi ciency and would help accommodate more renewables on the grid, so that DR would balance fl uctuations in electricity supply.
Conclusions
All indications are that, in the future, buildings will have a much more dynamic relationship with the electrical grid. Many build-ings already have systems in place to allow them to participate in this interaction manually, and automated systems are relatively inexpensive to implement with modern building management systems. Utility incentives may be available to make a better busi-ness case for doing this. Years of research across North America shows that substantial DR may be achieved using HVAC and lighting systems, and has provided guidelines for the deviations from recommended indoor environment conditions that may be undertaken without causing substantial hardship to occupants.
Acknowledgments
NRC research was sponsored by National Research Council Canada (NRC), the Program on Energy Research & Develop-ment (administered by Natural Resources Canada), Public Works & Government Services Canada (PWGSC), and by the Lighting Research Offi ce, Electric Power Research Institute (EPRI) with the support of the J.H. McClung Lighting Research Foundation. The work from LBNL was supported by the Assistant Secretary for Energy Effi ciency and Renewable Energy, Building Technolo-gies Program, of the U.S. Department of Energy under Contract No. DE-AC02-05CH11231. We are also thankful for support from the California Energy Commission’s Public Interest Energy Research Program, the Pacifi c Gas and Electric Program, and the Bonneville Power Administration.
References
Newsham, G.R.; Mancini, S. 2006. The potential for demand responsive
lighting in non-daylit offi ces. Leukos, 3 (2), pp. 105-120.
URL: http://nparc.cisti-icist.nrc-cnrc.gc.ca/npsi/ctrl?action=shwart&index=
an&req=20377200&lang=en
Newsham, G.R.; Mancini, S.; Marchand, R.G. 2008. Detection and
acceptance of demand-responsive lighting in offi ces with and without daylight. Leukos, 4 (3), pp. 130-156. URL: http://nparc.cisti-icist.nrc-cnrc. gc.ca/npsi/ctrl?action=shwart&index=an&req=20377318&lang=en#shr
Newsham, G.R.; Mancini, S.; Veitch, J.A.; Marchand, R.G.; Lei, W.; Charles, K.E.; Arsenault, C.D. 2009. Control strategies for lighting and
ventilation in offi ces: effects on energy and occupants. Intelligent Buildings International, 1 (2), pp. 101-121. URL: http://nparc.cisti-icist.nrc-cnrc. gc.ca/npsi/ctrl?action=shwart&index=an&req=20377136&lang=en
Kiliccote, S.; M.A. Piette; J.H. Dudley. 2009. Northwest Open
Automated Demand Response Technology Demonstration Project. Lawrence Berkeley National Laboratory Report LBNL-2573E.
URL: http://drrc.lbl.gov/sites/drrc.lbl.gov/fi les/lbnl-2573e_0.pdf Newsham, G.R.; Birt, B. 2010. Demand-responsive lighting: a fi eld
study. Leukos, 6 (3), pp. 203-225. URL: http://nparc.cisti-icist.nrc-cnrc. gc.ca/npsi/ctrl?action=shwart&index=an&req=20393373&lang=en
Hamachi LaCommare, K.; Eto, J. 2004. Understanding the Cost of
Power Interruptions to U.S. Electricity Consumers. Lawrence Berkeley National Laboratory Report LBNL-55718. URL: http://certs.lbl.gov/ pdf/55718.pdf
Motegi, N.; M. A. Piette; D. Watson; Sezgen, O. 2004. Measurement
and Evaluation Techniques for Automated Demand Response Demonstration. ACEEE Summer Study on Energy Effi ciency in Buildings, (Pacifi c Grove, USA). LBNL-55086. URL: http://drrc.lbl.gov/sites/drrc.lbl.gov/fi les/lbnl-55086.pdf
Piette, M.A.; Watson, D.; Motegi, N.; Kiliccote, S.. 2007.
Automated Critical Peak Pricing Field Tests: 2006 Pilot Program Description and Results. Lawrence Berkeley National Laboratory Report
LBNL-62218. URL: http://drrc.lbl.gov/sites/drrc.lbl.gov/fi les/62218.pdf
Piette, M.A.; Ghatikar, G.; Kiliccote, S.; Koch, E.; Hennage, D.; Palinsky, P.; McParland, C. 2009. Open Automated Demand Response
Communications Specifi cation (Version 1.0), Lawrence Berkeley National Laboratory Report LBNL-1779E. URL: http://eetd.lbl.gov/sites/all/fi les/cec-500-2009-063.pdf
Dr. Guy Newsham is a Group Leader with Intelligent Building Operations,
National Research Council–Construction.
Mary Ann Piette is Head of the Building Technology and Urban Systems
Department and Director of the Demand Response Research Center, Lawrence Berkeley National Laboratory (LBNL).