Case Studies of Naturally Ventilated Commercial Buildings in the United States
by Jui-Chen Chang
S.B., Mechanical Engineering (2000) Massachusetts Institute of Technology
Submitted to the Department of Mechanical Engineering In Partial Fulfillment of the Requirements for the Degree of
Master of Science in Mechanical Engineering at the
Massachusetts Institute of Technology June 2002 RARKER MASSA is 1 ET SRrs W OW..E OF TECHNOLOGY
SOCT 2 5 2002
LIBRARIESD 2002 Massachusetts Institute of Technology All rights reserved
Signature of Author... ... ... jepartment of Mechanical Engineering
May 10, 2002
C ertified by ... ...
Leon R. Glicksman Professor of Building Technology and Mechanical Engineering Thesis Supervisor
A ccep ted b y ...
Case Studies of Naturally Ventilated Commercial Buildings in the United States
by
Jui-Chen Chang
Submitted to the Department of Mechanical Engineering
on May 10, 2002 in partial fulfillment of the
requirements for the Degree of Master of Science in Mechanical Engineering
ABSTRACT
During the fall of 2000, an extensive search for purpose-built, naturally ventilated non-residential buildings, in the eastern United States, was conducted. This search revealed very few buildings suitable for field monitoring. Out of a very narrow field, two buildings were selected.
The smaller of the two buildings selected is the Broadmoor Wildlife Sanctuary's nature center. The building is a retrofitted barn in the town of Natick, Massachusetts, located 15 miles west of Boston. The architect leading the 1983 retrofit was Gerard Ives, known for promoting passive solar concepts in his work. The building features two occupied floors of approximately 5,600 square feet of total area. The building is wholly naturally ventilated, coupled with the use of passive solar heating during the winter. The second of the two buildings is the Chesapeake Bay Foundation's Philip Merrill Environmental Center, located in Annapolis, MD. The building, designed by the Washington DC branch of SmithGroup, opened in December of 2000. It was the first building to receive a Leadership in Energy and Environmental Design (LEED) Platinum rating. Approximately 80 full-time workers occupy two floors over approximately 32,000 square feet of area. Natural ventilation was specified for usage approximately
9% of the year and is available through a mixture of automated and manually operated windows.
Portable temperature and humidity loggers were placed in each building. Outdoor weather conditions, including wind speed and direction, were recorded from on-site weather stations. During weekly to monthly site visits, air velocities, surface temperatures, and other parameters were also measured. To determine thermal comfort, occupants were asked to rate their thermal sensation in daily surveys.
Data collected from both buildings was compared to a basic single-zone thermal and airflow model. It was originally hypothesized that the results might not be very accurate; yet, the results show no more than
10% error for the data analyzed. It is hoped that architects can use this basic model for pre-design
evaluation of natural ventilation usage, with an understanding of the benefits, as well as the limitations. Natural ventilation turns out to be used effectively in both buildings studied, both in maintaining thermal comfort and lowering overall energy consumption. A discussion of Simmons Hall, a new MIT undergraduate dormitory scheduled for opening in the fall of 2002, is also included.
Thesis Supervisor: Leon R. Glicksman
Table of Contents
C hapter 1 Background Inform ation ... 18
1. 1 Introduction ... 18
1.2 Description of N atural Ventilation ... 19
1.2.1 Cross V entilation ... 19
1.2.2 Stack V entilation... 19
1.2.3 Single-sided N atural Ventilation... 20
1.2.4 D ouble-skin Fa ade ... 21
1.3 Benefits and D isadvantages of N atural Ventilation ... 22
1.3.1 Energy and the Environm ent... 22
1.3.2 Controllability and Reliability ... 23
1.3.3 Occupant Com fort... 24
1.3.4 Equipm ent Requirem ents... 25
1.4 European N atural Ventilation... 26
1.4.1 D ansk M agisterforening - Copenhagen, Denm ark... 28
1.4.2 Roskilde University - Copenhagen Suburbs, D enm ark... 29
1.4.3 Sofiendal School- Copenhagen Suburbs, Denm ark ... 32
1.4.4 M ain Tower - Frankfurt, Germ any... 36
1.4.5 V ictoria Insurance Tower- Dusseldorf, Germ any ... 37
1.4.6 RW E - Essen, Germ any ... 40
1.4.7 Stadttor D usseldorf - Dusseldorf... 46
1.4.8 European Patent Office - Rijswik, Netherlands ... 51
1.4.9 Inland Revenue Castle M eadows - N ottingham , England... 53
1.4.10 University of Nottingham Jubilee Campus - Nottingham, England... 56
1.4.11 Queens Building - Leicester, England... 59
1.4.12 Edinburgh Gate - Harlow , England... 62
1.4.13 BRE Environm ental Building - Garston, England ... 65
1.4.14 Europe Trip Sum m ary and Conclusion... 67
1.5 State of N atural V entilation in the United States ... 70
1.5.1 Building Search... 70
1.5.2 Regulations and Guidelines ... 70
1.5.3 European Research and Organizations ... 71
1.5.4 United States Research and Organizations ... 73
1.5.5 Research M otivation ... 73
1.5.6 Research Im plem entation... 74
Chapter 2 Broadmoor Wildlife Sanctuary Nature Center Description... 75
2.1 Introduction ... 75
2.2 Building D etails... 76
2.2.1 Lighting, Building M aterials, and Heat Loads... 76
2.3 Long Term Instrum entation... 80
2.3.1 D etailed Logger D escription... 81
2.4 Building D iagram s and Pictures... 84
2.5 Sensor M ounting Pictures ... 94
2.6 Short-Term Site M easurem ents... 96
2.6.1 Tracer Gas... 96
2.6.2 Surface Tem perature ... 97
2.6.3 A ir V elocity ... 98
2.6.4 Therm al Com fort and Building Status M easurem ents... 98
Chapter 3 Philip M errill Environm ental Center Description ... 99
3.2 Building Site... 99
3.3 Building Description ... 100
3.3.1 Lighting and Internal Loads... 103
3.4 Long-Term Instrumentation ... 104
3.4.1 Temperature ... 104
3.4.2 W eather Conditions ... 106
3.4.4 Video M onitoring... 110
3.5 Short-Term M easurem ents... 111
3.6 Therm al Comfort Surveying ... 112
3.7 Buildinmg Im ages ... 114
3.7.1 Exterior Im ages... 114
3.7.2 Interior Im ages ... 118
3.7.3 Instrumentation Im ages... 122
Chapter 4 Sim m ons Hall ... 126
4.1 Description ... 126 4.2 Ventilation Strategies ... 126 4.2.1 Cross Ventilation ... 126 4.2.2 Single-sided Ventilation... 127 4.2.3 Stack Ventilation... 128 4.2.4 Night Cooling... 129
4.2.5 Alternate Cross Ventilation Strategy ... 130
4.3 Cross Ventilation M odeling ... 130
4.3.1 Calculation Using Loss Coefficients... 131
4.3.2 Calculation of Resultant Room Temperature... 132
4.4 Discussion ... 133
Chapter 5 M odel Fundam entals... 135
5.1 Pressure Distribution ... 135
5. 1.1 W ind Pressure ... 135
5.1.2 Thermal Buoyancy... 137
5.1.3 Overall Pressure Difference ... 137
5.2 Air Flow ... 137
5.2.1 Overall M odeling ... 137
5.2.2 ASHRAE M odel... 138
5.2.3 British Standard M ethod ... 139
5.3 Therm al M odel... 141
5.3.1 General Theory ... 141
5.3.2 Determination of internal heat gains ... 143
5.3.3 Building heat transm ission... 144
5.3.4 Solar Radiation... 145
5.4 Fenestration ... 148
5.4.1 External Shading ... 149
5.5 Therm al Com fort... 150
5.5.1 Fanger M odel... 150
5.5.2 ASHRAE Com fort Zone... 152
5 .5 .3 D raft ... 15 3 5.5.4 Thermal Radiation Asymmetry and Vertical Air Temperature Gradient ... 154
Chapter 6 Broadm oor Results and Discussion... 156
6.1 Broadm oor Summ ary ... 156
6.2 Data Analysis ... 157
6.2.1 Sum m ary of Natural Ventilation Use... 157
6.2.3 Tem perature... 160
6.2.4 A ir change rates ... 168
6.3 Therm al Com fort... 169
6.3.1 D etailed Therm al Com fort Questionnaires... 171
6.3.1 Outdoor Relative H um idity... 172
6.3.2 Indoor Relative H um idity ... 175
6.3.3 M ean Radiant Tem perature... 175
6.3.4 Other Therm al Com fort Param eters... 179
6.3.5 Therm al Com fort D iscussion... 179
6.4 Therm al M odel... 181
6.4.1 Internal Loads ... 181
6.5 Recom m endations and Observations ... 185
Chapter 7 Phillip Merrill Environmental Center Results and Discussion... 187
7.1 Introduction ... 187
7.2 Design M ethodology ... 187
7.3 D ata Sum m ary... 187
7.4 Energy Analysis ... 190
7.5 N atural Ventilation Period Data Analysis ... 191
7.5.1 Tem perature ... 191
7.5.2 M ean Radiant Tem perature... 200
7.5.3 Relative Hum idity ... 201
7.6 Air-Conditioning D ata Analysis... 202
7.7 A ir Change Rate ... 204
7.8 Therm al Com fort... 205
7.8.1 Other Therm al Com fort Param eters... 212
7.8.2 D etailed Therm al Com fort Surveys ... 212
7.8.3 Therm al Com fort D iscussion... 213
7.9 Therm al M odel... 214
7.10 M onitoring Issues... 217
7.11 Recom m endations and Observations ... 218
C hapter 8 Conclusion and Recom m endations... 221
A ppendix A : M ATLA B Code... 223
A . 1 Broadm oor W ildlife Sanctuary Scripts... 223
A .1.1 Therm al M odel... 223
A .1.2 Solar Radiation M odel ... 226
A .1.3 Energy M odel... 229
A .2 Chesapeake Bay Foundation Scripts ... 229
A .2.1 Therm al M odel... 229
A .2.2 Solar Radiation M odel ... 232
A .2.3 Energy M odel... 235
A ppendix B: Experim ental Data... 236
A ppendix C : O n-Site Visit Data... 237
C. 1 Broadm oor V isit Sum m aries ... ... 238
C.1.1 April 24,2001 ... 238 C.1.2 June 12, 2001... 238 C.1.3 June 20, 2001... 238 C.1.4 June 30, 2001... 238 C.1. 5 July 27, 2001 ... 239 C. 1.6 A ugust 3, 2001 ... 242 C. 1.7 A ugust 16, 2001 ... 244 C.1. 8 A ugust 24, 2001 ... 245
C.1.9 Septem ber 11, 2001... ... 246 C.1.10 Septem ber 27, 2001... 246 C.1.11 October 23, 2001... 247 C.1.12 Decem ber 18, 2001 ... 248 C.2 CBF Sum m aries... 248 C.2.1 Novem ber 23, 2000... 248 C.2.2 M arch 23, 2001 ... 248 C.2.3 June 1, 2001... 248 C.2.4 July 9, 2001 ... 248 C.2.5 July 12, 2001 ... 249 C.2.6 August 8, 2001 ... 250 C.2.7 August 10, 2001 ... 250 C.2.8 Septem ber 17, 2001... 250 C.2.9 October 11, 2001... 250 C.2.10 October 12, 2001... 252 C.2. 11 N ovem ber 20, 2001... 253 C.2.12 D ecem ber 31, 2001 ... 253
C.3 Broadm oor Vent and W indow Operation... 253
A ppendix D: Therm al Com fort Surveys and Data... 256
D .1 Broadm oor W ildlife Sanctuary... 256
D .2 Chesapeake Bay Foundation Phillip M errill Environm ental Center ... 259
D .2.1 CBF Therm al Sensation Data... 262
D .2.2 CBF A ir V elocity Sensation... 265
A ppendix E: Building Data... 266
E. 1 Broadm oor W ildlife Sanctuary Nature Center... 266
E.2 Phillip M errill Environm ental Center ... 267
A ppendix F: O ther Naturally Ventilated Buildings... 268
A ppendix G : W ind Pressure Coefficients ... 272
Table of Figures
Background
Figure 1 I D iagram of cross ventilation ... 19
Figure 2 D iagram of therm ally driven natural ventilation ... 20
Figure 3 D iagram of single-sided natural ventilation ... 21
Figure 4 General schem atic of double-skin fagade ... 22
Danish Magister Union Figure 5 Partial view of the front fagade... 28
Figure 6 M anually operated transom window ... 28
Figure 7 Sem i-transparent shading device on exterior... 29
Roskilde University Figure 8 Partial view of floor plan... 30
Figure 9 Partial exterior building view ... 30
Figure 10 Exterior building detail view ... 31
Figure 11 Transom window ... 31
Figure 12 Shading and window controls ... 31
Sofiendal School Figure 13 Schem atic of airflow path... 32
Figure 14 Front of building... 33
Figure 15 A close-up view window m otor... 33
Figure 16 Roof view ... 34
Figure 17 Circular vent in typical classroom ... 34
Figure 18 Ventilation ductwork to the roof ... 35
Main Tower Figure 19 Exterior view ... 37
Figure 20 Operable window ... 37
Victoria Insurance Tower Figure 21 Exterior view ... 38
Figure 22 Schem atic of double-skin ... 39
Figure 23 Exterior view of double-skin ... 39
Figure 25 Close-up view of fa ade ... 40
Figure 26 Fa ade transparency ... 40
RWE Tower Figure 27 N ighttim e exterior view ... 43
Figure 28 Typical floor plan ... 43
Figure 29 Isom etric view of fagade elem ent... ... ... ... 43
Figure 30 Actual view of fagade elem ent ... 43
Figure 31 Cross-section view of "Fish-M outh" fagade assem bly... 44
Figure 32 "Surfboard" chilled ceiling ... 44
Figure 33 Final ceiling covering ... 44
Figure 34 Schem atic of top five floors ... 45
Figure 35 General engineering requirem ents specified during design... 45
Figure 36 Individual office control panel ... 46
Figure 37 Roof-top weather station ... 46
Stadttor Dusseldorf Figure 38 Exterior view ... 48
Figure 40 Double-skin cavity ... 49
Figure 41 View of double-skin fagade from the inside of a typical office... 49
Figure 42 Typical floor layout for levels 1-13... 50
Figure 43 Lower m otorized atrium windows... 50
European Patent Office Figure 44 Schem atic of typical floor ... 51
Figure 45 Tower building ... 52
Figure 46 Typical office window unit ... 52
Inland Revenue Castle Meadows Figure 47 M ap of building site ... 53
Figure 48 Typical building exterior ... 54
Figure 49 Office interior ... 54
Figure 50 "M ushroom " tower... 55
Figure 51 Representative faqade... 55
Figure 52 D iagram of airflow path through building... 56
Jubilee Campus Figure 53 Site m ap... 57
Figure 54 M ain building exterior... 57
Figure 55 M ain building operable shutters ... 57
Figure 56 M an-m ade lake... 58
Figure 57 Library exterior... 58
Figure 58 Backside of m ain cam pus building... 58
Queens Building Figure 59 Building exterior... 59
Figure 60 View of typical fagade in electrical engineering laboratories... 60
Figure 61 Openings to lecture hall vent stacks ... ... ... 60
Figure 62 Ornam ented ventilation grill... 61
Figure 63 M echatronics lab ... 61
Figure 64 Lecture hall seating ... 61
Figure 65 M echanical engineering lab... 61
Edinburgh Gate Figure 66 Exterior view ... 63
Figure 67 O uter fa ade ... 63
Figure 68 Partial view of interior atrium fagade ... 64
Figure 69 General view of office space ... 64
Figure 70 Office fa ade to atrium... 64
Figure 71 Office fa ade to outside... 64
Figure 72 Top-level atrium fa ade... 65
Figure 73 Schem atic of floor plan ... 65
BRE Environmental Building Figure 74 South facade ... 66
Figure 75 Ceiling view ... 67
Broadmoor Wildlife Santuary Nature Center Figure 76 Monthly average mean, average maximum, and average minimum temperature for Boston, Massachusetts ... 7 7 Figure 77 M onthly degree-day data... 78
Figure 78 Average m onthly m orning and afternoon relative hum idity... 78
Figure 79 Average and m axim um wind speed and average wind direction... 79
Figure 81 HOBO Tem p/External Logger ... 81
Figure 82 HOBO Logger for RH/Tem p/2x External ... 81
Figure 83 HOBO Pro RH/Tem perature Logger... 82
Figure 84 H igh-accuracy tem perature sensor ... 83
Figure 85 W ide-range tem perature sensor... 83
Figure 86 M ain floor plan... 84
Figure 87 Building airflow diagram ... 84
Figure 88 Cross-section ... 85
Figure 89 Cooling diagram ... 85
Figure 90 Sunspace solar system s... 86
Figure 91 South fa ade ... 87
Figure 92 Interior of sunspace ... 87
Figure 93 Sunspace fan housing ... 87
Figure 94 Basem ent com m on area... 88
Figure 95 W est faqade from open field... 88
Figure 96 W est entryway... 88
Figure 97 East louvered door... 88
Figure 98 North fa ade ... 89
Figure 99 Assem bly room ... 89
Figure 100 Southeast corner ... 89
Figure 101 Art exhibit... 90
Figure 102 Corridor from assem bly room ... 90
Figure 103 Conference room ... 90
Figure 104 W all cross-section ... 90
Figure 105 Stack vent ... 91
Figure 106 Attic door... 91
Figure 107 Attic space ... 92
Figure 108 Open field ... 92
Figure 109 W ind m onitoring instrum ents... 93
Figure 110 Open field ... 93
Figure 1 11 Reflective light pan ... 93
Figure 112 Basem ent office... 93
Figure 113 Instrum entation... 94
Figure 114 W eather station equipm ent ... 95
Figure 115 Laptop com puter... 95
Figure 116 Tracer gas equipm ent ... 97
Figure 117 Raytek non-contact therm om eter... 97
Chesapeake Bay Foundation Phillip Merrill Environmental Center Figure 118 Diagram of intended airflow through building... 99
Figure 119 Illustration of building cross-section. ... 99
Figure 120 Site m ap ... 100
Figure 121 North elevation ... 102
Figure 122 South elevation ... 102
Figure 123 W est elevation ... 102
Figure 124 East elevation ... 103
Figure 125 First floor sensor placem ent ... 105
Figure 126 Second floor sensor placem ent ... 106
Figure 127 Annapolis average mean, average maximum, and average minimum monthly temperature... 106
Figure 128 Annapolis heating and cooling degree hours... 107
Figure 129 Annapolis average and maximum monthly wind speed and average wind direction ... 107
Figure 130 Annapolis m onthly cloud and sunshine ... 108
Figure 131 Annapolis average m onthly m orning and afternoon relative hum idity. ... 108
Figure 132 Thom as Point Lighthouse... 111
Figure 135 First floor therm al com fort survey participant locations. ... 112
Figure 137 North fa eade ... 114
Figure 138 South fa ade ... 114
Figure 139 Another view of the north fagade ... ... ... 114
Figure 140 Conference center... 115
Figure 141 Bank of windows... 115
Figure 142 Clerestory windows ... 115
Figure 143 North fa ade ... 116
Figure 144 Beach... 116
Figure 145 Parking lot ... 116
Figure 146 Solar shading device... 117
Figure 147 South fa ade ... 117
Figure 148 Upper south fagade window ... 117
Figure 149 South fa wade window ... 117
Figure 150 Atrium ... 118
Figure 151 Atrium ... 118
Figure 152 View of south fagade from first floor east office area ... 118
Figure 153 First floor east office area... 118
Figure 154 Second floor ... 119
Figure 155 W orkstation occupancy sensor ... 119
Figure 156 Lighting sensor ... 119
Figure 157 Open windows sign ... 120
Figure 158 Second floor ... 120
Figure 159 Second floor ... 120
Figure 160 Sm oke beam detector ... 121
Figure 161 First floor corridor ... 121
Figure 162 Air vent... 121
Figure 163 W ireless cam era ... 122
Figure 164 First floor west temperature sensor... 122
Figure 165 Atrium tem perature sensor ... 122
Figure 166 First floor east sensor... 123
Figure 167 Ledge tem perature sensor... 123
Figure 168 Outdoor temperature sensor... 123
Figure 169 Clerestory tem perature sensor ... 124
Figure 170 Second floor east tem perature sensor ... 124
Figure 171 Fan temperature sensor... 124
Figure 172 W indow state logger... 125
Figure 173 Outdoor wireless cam era ... 125
Figure 174 Second floor west tem perature sensor ... 125
Simmons Hall Figure 175 Exterior m odel view ... 126
Figure 176 D iagram of cross ventilation strategy... 127
Figure 177 D iagram of single-sided ventilation strategy ... 128
Figure 178 Interior view of windows in a double room ... 128
Figure 179 M odel of interior building layout, including prelim inary locations of atrium s ... 129
Figure 180 Exterior view of unfinished fagade... ... ... ... 129
Figure 181 Recom m ended open plenum cross ventilation layout ... 133
Figure 182 Overhead schematic of open plenum transfer system for cross ventilation... 134
Model Fundamentals Figure 183 D iagram of wind pressures on a sam ple building... 136
Figure 184 D iagram of British Standard M ethod param eters, for cross ventilation ... 140
Figure 185 D iagram of key param eters included in therm al m odel... 141
Figure 186 D iagram of param eters related to solar radiation... 146
Thermal Comfort
Figure 188 Predicted percentage of dissatisfied (PPD) as function of predicted mean vote... 152
Figure 189 Air temperature and mean radiant temperature necessary for comfort (PMV = 0) of sedentary persons in sum m er clothing at 50% relative hum idity ... 152
Figure 190 ASHRAE summer and winter comfort zones based on acceptable ranges of operative temperature humidity for people in typical summer and winter clothing during primarily sedentary activity ... 153
Figure 191 Draft conditions dissatisfying 15% of the population ... 154
Figure 192 Percentage of people dissatisfied as function of mean air velocity ... 154
Figure 193 Percentage of people dissatisfied as function of vertical air temperature difference between head and an k le s ... 15 4 Figure 194 Percentage of people expressing discomfort due to asymmetric radiation... 154
Figure 195 Percentage of people dissatisfied as function of floor temperature ... 155
Broadmoor Wildlife Sanctuary Results Figure 196 Outdoor temperature histogram during occupied hours between June 12 and September 25, 2001 ... 158
Figure 197 Net cooling requirement between June 12, 2001 and September 27, 2001, during occupied hours... 159
Figure 198 Outdoor versus assembly room temperature with linear trendline ... 160
Figure 199 Outdoor versus basement temperature with linear trendline ... 161
Figure 200 W ind speed versus assembly room temperature... 162
Figure 201 W ind direction versus assembly room temperature... 163
Figure 202 Average indoor temperature versus wind speed for outdoor temperature between 24 and 25'C... 164
Figure 203 Assembly room versus basement temperature ... 164
Figure 204 Typical week of outdoor and indoor temperatures ... 165
Figure 205 Typical day of outdoor and indoor temperatures... 166
Figure 206 Standard deviation of all measured ground floor zone temperatures... 167
Figure 207 Standard deviation of all ground floor zone temperatures versus outdoor wind speed ... 167
Figure 208 Diagram of visualized airflow using smoke with a westerly wind ... 169
Figure 209 Comparison between Fanger model and surveyed thermal comfort data for various indoor air velocities. ... 170
Figure 210 H istogram of indoor relative hum idity ... 172
Figure 211 Histogram of percentage difference between outdoor and indoor relative humidity... 173
Figure 212 Histogram of percentage difference between outdoor and indoor humidity ratio ... 173
Figure 213 Outdoor wind speed versus difference between indoor and outdoor relative humidity... 174
Figure 214 Comparison between Fanger model and surveyed thermal comfort data for various levels of relative h u m id ity ... 17 5 Figure 215 Comparison of mean radiant temperature versus indoor air temperature for July 27, 2001... 176
Figure 216 Comparison of mean radiant temperature versus indoor air temperature for August 3, 2001... 176
Figure 217 Comparison of mean radiant temperature versus indoor air temperature for August 16, 2001... 177
Figure 218 Comparison of Fanger model with surveyed thermal comfort data for various mean radiant temperatures ... 178
Figure 219 Comparison of experimental data with extended PMV model... 180
Figure 220 Comparison of model predication with actual temperature data for the first week of September 2001 183 Figure 221 Comparison of model predication to actual temperature data for the fourth week of August 2000 ... 184
Figure 222 Comparison of model predication to actual indoor temperature data for the third week of August 2001 ... 1 8 5 Phillip Merrill Environmental Center Results Figure 223 Net cooling requirement between May 16, 2001 and December 31, 2001... 190
Figure 224 Histogram of outdoor temperature between May 16, 2001 and December 31, 2001, when natural ventilation w as used during occupied hours... 191
Figure 225 Plots of outdoor temperature versus interior zone temperature for times when natural ventilation was used during occupied hours, between May 16, 2001 and December 31, 2001... 192
Figure 226 Outdoor temperature versus averaged indoor temperature when natural ventilation was in use... 193
Figure 227 Average indoor temperature versus wind direction when natural ventilation was in use... 193
Figure 228 Average indoor temperature versus wind speed when natural ventilation was in use... 194
Figure 230 Outdoor temperature versus second floor fan temperature... 195
Figure 231 Histogram of temperature difference between second floor desk sensor and second floor clerestory sensor during natural ventilation usage... 196
Figure 232 Plot of temperatures on July 12, 2001, when natural ventilation was in use ... 197
Figure 233 Plot of temperatures on October 11, 2001, when natural ventilation was in use ... 198
Figure 234 Plot of temperatures on August 31, 2001, when natural ventilation was in use ... 199
Figure 235 Comparison of mean radiant temperature versus air temperature for each building zone on October 11, 2 0 0 1... 2 0 0 Figure 236 Histogram of indoor relative humidity between May 16, 2001 and December 31, 2001 for natural ventilation use during occupied hours... 201
Figure 237 Outdoor temperature versus zone temperature when air-conditioning was in use during occupied hours between M ay 16, 2001 and D ecem ber 31, 2001 ... 202
Figure 238 Daily average zone temperatures when air-conditioning was in use between May 16, 2001 and D ecem ber 3 1, 200 1 ... 203
Figure 239 Plots of morning zone temperatures versus thermal comfort survey thermal sensation (TS) indices and Fanger m odel predicted m ean votes... 206
Figure 240 Plots of afternoon zone temperatures versus thermal comfort survey thermal sensation (TS) indices and Fanger m odel predicted m ean votes... 207
Figure 241 Plot of average morning indoor temperature versus averaged thermal comfort survey thermal sensation indices and Fanger m odel predicted m ean votes ... 208
Figure 242 Plot of average afternoon indoor temperature versus averaged thermal comfort survey thermal sensation indices and Fanger m odel predicted m ean votes ... 208
Figure 243 Plot of average morning indoor temperature versus thermal comfort survey thermal sensation indices and Fanger model predicted mean votes for various indoor air speeds (0, 0.2, and 0.5 m/s)... 209
Figure 244 Plot of average morning indoor temperature versus thermal comfort survey thermal sensation indices and Fanger model predicted mean votes for various clothing insulation levels. ... 210
Figure 245 Analysis of thermal comfort during use of air-conditioning between September 15, 2001 and November 2 0 , 2 0 0 1... 2 1 1 Figure 246 Comparison of average indoor temperature to optimum comfort temperature during occupied hours natural ventilation usage between May 16 and December 20, 2001 ... 214 Figure 247 Comparison between indoor temperature predicted by model and actual indoor temperature, on October 1 1 , 2 0 0 1 ... 2 15
Figure 248 Comparison between indoor temperature predicted by model and actual indoor temperature, on
S eptem ber 18, 200 1... 2 16
Figure 249 Comparison between indoor temperature predicted by model and actual indoor temperature, on
List of Tables
Background
Table 1 Summary of naturally ventilated buildings visited in August 2000... 27
Broadmoor Wildlife Sanctuary Nature Center T able 2 L ighting sum m ary... 76
T able 3 L ogger placem ent ... 80
Table 4 HOBO Temp/External logger specifications. ... 81
Table 5 HOBO Logger for RH/Temp/2x External specifications... 82
Table 6 HOBO Pro RH/Temperature Logger specifications ... 82
Table 7 High-accuracy temperature sensor specifications... 83
Table 8 Wide-range temperature sensor specifications ... 83
Table 9 Tracer gas monitoring equipment specifications ... 96
Table 10 Raytek non-contact thermometer specifications ... 97
Table 11 A nem om eter specifications... 98
Chesapeake Bay Foundation Phillip Merrill Environmental Center Table 12 Summary of building operation setpoints and standards. ... 101
Table 13 Summary of lighting and internal loads... 104
Table 14 Summary of instrumentation placement ... 105
Table 15 Thomas Point Lighthouse specifications ... 109
Simmons Hall Table 16 Table of resistance coefficients... 131
Table 17 Resultant room temperature for various air change rate. ... 133
Model Fundamentals Table 18 Wind coefficients for various types of terrain. ... 135
Table 19 Average monthly values for determining solar radiation... 148
Table 20 Values for calculating solar heat gain factors for DSA... 148
Broadmoor Wildlife Sanctuary Results Table 21 Summary of average indoor temperatures from June 12, 2001-September 25, 2001 ... 157
Table 22 Required outdoor temperature and humidity conditions for various air change rates per hour ... 157
Table 23 Comparison of measured inlet and outlet air speed to outdoor wind speed... 168
Table 24 Evaluation of asymmetric thermal radiation, vertical air temperature difference, and warm or cold floors, for therm al com fort. ... 179
Table 25 Analysis of optimum comfort temperatures for occupied hours between June 12, 2001 and September 25, 2 0 0 1 ... 1 8 0 Table 26 Sum m ary of internal heat loads. ... 181
Table 27 Summary of convective and radiative split for heat loads ... 182
Table 28 Summary of radiant time series percentages for light and medium construction buildings... 182
Phillip Merrill Environmental Center Results Table 29 Internal and external heat loads based on survey done on a typical day ... 188
Table 30 Required outdoor temperature and relative humidity required for given interior temperature, relative hum idity, heat load, and air change rate... 189
Table 31 Comparison of mean radiant temperature to air temperature on July 12, 2001 ... 200
Table 32 Comparison of measured inlet and outlet air speed to outdoor wind speed... 204
Table 33 Physical distribution of surveyed occupants by gender ... 205
Table 34 Evaluation of asymmetric thermal radiation, vertical air temperature difference, and warm or cold floors, for therm al com fort ... 2 12
Appendix
Table 35 Description of Broadmoor data files... 236
Table 36 Description of Chesapeake Bay Foundation data files ... 236
Table 37 Summary of Broadmoor site visits ... 237
Table 38 Summary of Chesapeake Bay Foundation site visits. ... 237
Table 39 Broadmoor surface temperature readings for June 12, 2001 ... 238
Table 40 Broadmoor air velocity readings for June 30, 2001... 238
Table 41 Broadmoor surface temperature readings for June 30, 2001 ... 239
Table 42 Table of first Broadmoor tracer gas experiment on July 27, 2001... 239
Table 43 Table of second Broadmoor tracer gas experiment on July 27, 2001... 239
Table 44 Table of third Broadmoor tracer gas experiment on July 27, 2001... 240
Table 45 Broadmoor smoke visualization results for July 27, 2001... 240
Table 46 Broadmoor surface temperature readings for July 27, 2001 ... 241
Table 47 Broadmoor air velocity readings for July 27, 2001... 242
Table 48 Broadmoor air velocity readings for August 3, 2001... 243
Table 49 Broadmoor surface temperature readings for August 3, 2001 ... 244
Table 50 Broadmoor air velocity readings for August 16, 2001... 244
Table 51 Broadmoor surface temperature readings for August 16, 2001 ... 245
Table 52 Broadmoor surface temperature readings for August 24, 2001 ... 246
Table 53 Broadmoor surface temperature readings for September 11, 2001... 246
Table 54 September 27, 2001 Broadmoor tracer gas bottle numbering... 246
Table 55 Broadmoor surface temperature readings for September 27, 2001... 247
Table 56 Broadmoor air velocity readings for September 27, 2001 ... 247
Table 57 Broadmoor weather station air velocity readings for September 27, 2001... 247
Table 58 CBF air velocity data for March 23, 2001 ... 248
Table 59 CBF window status data for July 12, 2001... 249
Table 60 CBF air velocity data for July 12, 2001... 249
Table 61 CBF surface temperature data for July 12, 2001... 250
Table 62 CBF window operation data for October 11, 2001... 250
Table 63 CBF surface temperature data for October 11, 2001 ... 251
Table 64 CBF air velocity data for October 11, 2001... 252
Table 65 CBF window status data for October 12, 2001... 252
Table 66 CBF air velocity data for October 12, 2001... 252
T able 67 B roadm oor vent operation ... 253
Table 68 Broadmoor west window operation ... 255
Table 69 CBF morning thermal sensation data for September 17 through October 11, 2001 ... 262
Table 70 CBF afternoon thermal sensation data for September 17 through October 11, 2001 ... 262
Table 71 CBF morning thermal sensation data for October 15 through November 20, 2001 ... 263
Table 72 CBF afternoon thermal sensation data for October 15 through November 20, 200... 264
Table 73 CBF air velocity sensation for September 17 to October 11, 2001... 265
T able 74 B roadm oor w indow data... 266
Table 75 CBF window schedule as given by SmithGroup architectural plans ... 267
Table 76 Broadmoor wind pressure coefficients ... 272
Acknowledgerments
I would like to thank my parents and my sister for their unwavering support of my education. As I prepare to move onto another phase of my life, reflections on the past reaffirm the importance of my family in my successes. Mom, Dad, and Connie, I dedicate this thesis to you.
I would also like to thank the friends that have supported me throughout my years at MIT. Special thanks go to Jonathan Wang and Ruth Perlmutter for always finding time for me, even when things were busy in their own lives.
It has also been a pleasure to work among a dedicated and caring group of individuals in the Building Technology lab. In particular, Camille Allocca, Rogelio Palomera-Arias, Henry Spindler, and Jae-Hyeok Choi, have made my experience especially enjoyable.
Many thanks go to Leon Glicksman for his mentoring and supervision on this enriching project. He has contributed greatly to my growth as a human being and as a professional in building technology. Without him, I would not have discovered such a satisfying research topic.
Kathleen Ross and Dorrit Schuchter, the secretaries of the Building Technology program, also deserve hearty thanks for the advice and support they have provided me over the last four years. I would also like to thank those that contributed to this project. Without the help of the following individuals and groups, this project would not have been possible:
Elissa Landre, Director of the Broadmoor Wildlife Sanctuary Nature Center Staff of the Broadmoor Wildlife Sanctuary Nature Center
Roger Perry, Building Manager of the Phillip Merrill Environmental Center Charles Foster, Director of Fleet and Facilities, Chesapeake Bay Foundation Staff of the Philip Merrill Environmental Center
Cynthia Cogil and Gregory Mella, SmithGroup, Washington DC Andrew Persily, National Institute of Standards and Technology Ove Arup and Partners, Boston and San Francisco
WindowMaster, Copenhagen, Denmark
Lastly, I would like to thank the Kann-Rasmussen Foundation for generously sponsoring this research project.
Chapter 1 Background Information
1.1 Introduction
Commercial buildings play a major role in society. They are buildings that house businesses of all types, whether they are research organizations, financial powerhouses, or consulting firms. Vital to the success of these organizations is the ability of their buildings to provide a
comfortable and healthy working environment. Before the 1950s, natural ventilation and daylighting were used to achieve this, sometimes in innovative ways based purely on common knowledge and sense. Eventually, artificial lighting and ventilation gained dominance to the point where they are now the norm in the United States [Arnold, 1999].
A similar trend occurred in Europe, but not to the same degree as in the United States. This happened for many reasons, including a more widespread cultural concern for increased electricity consumption, coupled with a desire for a connection to the natural environment. Research on this topic over the past decade has blossomed, in part due to a significant number of architecturally recognized buildings developed by the European design community [Allard,
1996; Kukadia, 1998; Liddament, 1998; Santamouris, Argiriou, & Deschamps, 1996; Santmouris & Asimakopoulous, 1996]. These buildings attempt to go beyond what was done decades ago, in an effort to create low-energy buildings that set benchmarks for future building construction
[Allard, 1998; BRE, 1999; CIBSE, 1998; Perera, 1998]. The majority of these buildings have been constructed in central and northern Europe, where the climate is very similar to the climates of several regions in the United States [Axley, 2001]. This leaves the question of why natural ventilation is so rare in the United States.
The research presented in this thesis hopes to shed some light on natural ventilation in the United States. Beforehand, we present information on what natural ventilation is and the known
advantages and disadvantages. A discussion of European buildings visited in 2000 will also be presented.
1.2 Description of Natural Ventilation
Natural ventilation can be used for several purposes. The first is to control the air quality of a space, by exchanging stale air with fresh outdoor air. The second is to provide direct cooling to a particular space, by replacing warm indoor air with cooler outdoor air without chillers, thus reducing overall energy consumption. Lastly, natural ventilation can provide indirect night cooling to a building's thermal mass.
1.2.1 Cross Ventilation
Cross ventilation relies on wind pressure to force air through a building, usually through vents and windows located on opposite sides of the building. Cross ventilation thus requires that a building's plan be open to allow air to flow unrestricted. The depth of the building must also be contained, so that ventilation is able to remove heat and pollutants. A building should be sited according to predominant winds, with attention paid to surrounding features, such as trees, bodies of water, other buildings, and other objects that may influence airflow [ASHRAE, 1997].
Predominant wind direction
U
I
I
I
U
I
SCorrior
UI
H
Figure 1 Diagram of cross ventilation.
1.2.2 Stack Ventilation
Stack ventilation relies on density differences to move air from a location of low temperature to a location of higher temperature. As temperature increases, the density of air decreases, typically forcing air to move upwards. A chimney or atrium is often used to generate sufficient pressure, through the stack effect, to force air through a building's envelope. Slight wind pressure can also induce airflow as shown in the diagram below. Stack ventilation is particularly well suited for cases when there is little or no wind.
Wind direction
W
Figure 2 Diagram of thermally-driven natural ventilation.
1.2.3 Single-sided Natural Ventilation
Single-sided ventilation is typically used when cross ventilation is not possible, due to the desire to isolate various rooms for privacy or to satisfy fire regulations. Single-sided ventilation relies on smaller-scale buoyancy effects that are dictated by a difference in indoor and outdoor temperature. Air will enter through a low opening in a room, heat up and rise due to internal loads, and then exit through openings high in the room. It should be noted that single-sided ventilation is not the ideal natural ventilation strategy. Typically, the highest air change rates are achieved with cross ventilation.
Atrium
Closed
.~~ door
Figure 3 Diagram of single-sided natural ventilation.
1.2.4 Double-skin Fagade
In a variety of skyscrapers in Germany, skin facades have gained prominence. A double-skin fagade, as its name implies, is a fagade with two glass layers. The two layers are separated
by a gap anywhere from 20 to 120 mm wide. In between the layers, there is typically integrated
shading. The shading is designed to heat up due to solar radiation, with the effect of inducing buoyancy driven flow in between the two fagade layers; vents on the outer layer allow air to
enter and exit. This induced flow takes away most of the heat gain that would otherwise enter
into the occupied space. The result is a fagade with a very high overall resistive value.
The double-skin fagade also allows for natural ventilation. The inner layer can be opened like a normal operable window. Typically, natural ventilation with a single fagade is difficult to
implement in a skyscraper, because of street noise, rain entry, paper displacement, excessive
force on interior doors, and so on. The outer layer reduces the impact of all of these, while still allowing for fresh air to enter the occupied space. The main caveat with using a double-skin is cost.
Solar radiation
acade layer
-Aluinu
blnd
Operable windowFigure 4 General schematic of double-skin fagade.
1.3 Benefits and Disadvantages of Natural Ventilation
On the surface, natural ventilation appears to be a very simple ventilation strategy to implement. At its most basic application, all a building needs for natural ventilation is operable windows. Yet, the scope of this research hopes to cover much more than this simple example. The issues facing the use of natural ventilation are many; they run the gamut of disciplines, including politics, economics, psychology, engineering, and science.
1.3.1 Energy and the Environment
Natural ventilation is seen as a ventilation strategy that has the potential to reduce energy consumption and its associated economic and environmental costs. In the United Kingdom, research has been done on many naturally ventilated buildings to quantify the energy that can be saved in using a passive cooling strategy. Naturally ventilated buildings use between 14 to 41 kWh/M2 less cooling energy than their air-conditioned counterparts [BRECSU, 2000]. This depends on the particular climate, as well as the level of internal and external heat gains on the building. ce Space Exterior I Operable window 000 000 0.0 000 000 0110 0-40 000 Airflow path 0.00 0-0 0000 000 '00, 7 ..0
In the United States, buildings are often overlooked as a major source of energy consumption and producer of greenhouse gases. In fact, one-third of both of these are a result of the building sector [SBIC, 1999]. Innovation in this sector would go a long way towards maintaining and improving the quality of life for future generations.
There is sometimes confusion over whether using an economizer cycle counts as natural ventilation; it does not. Although the air brought into a building by such a cycle has not been heated or cooled, a significant amount of energy is still necessary to run pumps and fans. An economizer cycle forces outdoor air to run through the standard ductwork used for active mechanical ventilation. This contrasts to the use of fan-assisted natural ventilation. In this case, roof or window ventilators pull or push air through the open spaces of a building. The pressure
drop the fans have to contend with is significantly less than the pressure drop encountered in a full-blown duct network. Again, in the United Kingdom, naturally ventilated buildings offset between 20 to 60 kWh/m2 of annual fan energy consumption used for cooling, compared to their mechanically ventilated counterparts [BRECSU, 2000]. Although individual HVAC
components, such as chillers and compressors, are becoming increasingly efficient, lack of space for ductwork make it more and more critical to consider fan energy consumption.
One drawback in using natural ventilation is the lack of heat recovery during the heating season. During the winter, a significant amount of energy can be recovered from heated exhaust air through use of various types of heat exchangers. In a particularly cold climate, most of the energy used will be to heat air. In this case, fan energy consumption becomes a much smaller concern.
In summary, for cooling alone, 10% of a typical commercial building's energy costs can be saved with natural ventilation, while another 15% can be saved by the elimination of fan power consumption, when compared to a building with an all-air system [Kavanaugh, 2000].
1.3.2 Controllability and Reliability
With a mechanical ventilation system, one can assume reliable controllability. An occupant sets a thermostat and a computer or other controller operates the system to achieve a certain
ventilation rate, temperature, and in some cases, indoor humidity. With natural ventilation, a greater level of uncertainty exists because of constantly changing outdoor weather conditions. At times, the system may under-ventilate a space, resulting in overheating or poor air quality. At other times, it may over-ventilate the space and result in the need for heating. With natural ventilation, there may also be problems with air distribution. Occupants may feel localized problems with air quality or temperature. With mechanical ventilation, there can be similar problems attaining uniform conditions throughout a building, though.
To many, mechanical ventilation appears to have the upper hand. In many ways it does, but one must also note that although the temperature in a space may be well regulated, air quality may not. Most prevailing ventilation standards are based on a fixed air volume allowance per person, depending on the function of a particular building.
To address the issues of reliability and controllability, advanced automated windows and vents have been developed [Axley, 2001; Windowmaster, 2002], along with predictive whole building control strategies [Knoll & Phaff, 1998] and systems. On a final note though, even with
advanced developments, natural ventilation will not work if natural driving forces are not available in the first place. This has led to a trend to adopt fan-assisted natural ventilation or mixed-mode ventilation, where active mechanical ventilation is used as necessary. This trend was particularly visible in many of the buildings discussed in the European tour section of this thesis.
1.3.3 Occupant Comfort
It appears to be the experience of many that mechanical ventilation fails to provide an acceptable environment in many situations [Fisk & Rosenfeld, 1997; Fergus & Kessler, 1998; Oseland, 1998]. In the United States, in particular, many are familiar with working in a cubicle situated in the middle of a large office building, without the view of a window or any natural daylight. Yet, natural ventilation and daylighting has been shown to improve the comfort, health, and
productivity of office workers. In comparisons of health of office workers in European buildings of all types, the naturally ventilated buildings reported less prevalence of negative conditions in comparison to mechanically ventilated buildings [Mendell, 1996]. These findings are supported by everyday stories from ordinary people around the world, yet the exact scientific basis for this is not completely certain.
With mechanical ventilation systems, a lot of attention has also been paid to sick-building syndrome (SBS). Indicators of SBS include complaints of symptoms associated with acute discomfort, such as headaches; eye, nose, or throat irritation; dry cough; dry or itchy skin;
dizziness and nausea; and fatigue [EPA, 1991]. The cause of the symptoms is not exactly known, although four causes of SBS itself are often cited: inadequate ventilation, chemical contaminants from indoor source, chemical contaminants from outdoor sources, and biological contaminants [EPA, 1991].
Because of the 1973 oil embargo in the United States, national energy conservation measures specified reducing the amount of outdoor air provided for ventilation from 15 cfm to 5 cfm per person [EPA, 1991]. In the late 1980s, these standards were raised back to 15 cfm, when it was found that 5 cfm was not enough to maintain acceptable indoor air quality, health, and occupant comfort. Yet, even 15 cfm may not be enough to counteract the effect of indoor chemical contaminants. These contaminants include volatile organic compounds (VOCs), such as formaldehyde. Adhesives, carpeting, furniture, and cleaning agents emit VOCs. Usually, the levels of VOCs will be highest when a building is first opened, due to the prevalence of new materials.
Another often talked about cause of SBS is the prevalence of biological contaminants in unkempt ductwork. Bacteria, molds, and viruses may breed in stagnant water that has accumulated in ducts and other HVAC components. With natural ventilation, problems such as this can be eliminated. In addition, since all air moving through the building is from the outside, the air change rate achieved with natural ventilation is typically much higher than that achieved with mechanical ventilation. The caveat with natural ventilation is that because air is brought in from outside with no filtration, outdoor air quality levels are still important.
1.3.4 Equipment Requirements
Mechanical heating, ventilating, and air conditioning equipment can account for a significant portion of a building's initial capital costs. In some buildings, these costs can be as high as a third of the construction cost [Chang, 2000]. The potential of reducing a building's construction cost is high with the use of natural ventilation. Equipment can be eliminated or at least sized down.
Equipment costs are not the only consideration. With the complexity of mechanical systems today, space becomes a major issue. Filters, heating and cooling coils, noise attenuators, ducts, heat exchangers, fans, and other components all vie for precious space. For a common
commercial building ceiling height of 3.7 m, the combined requirements of fans, vertical distribution, and horizontal distribution systems consume 0.68 to 1.36 m3 per 3.7 m3 of useful
space in the building; this is equivalent to 18 to 37% of the total volume of the building [Axley, 2001]. By eliminating equipment, buildings can be opened up to provide more natural daylight. In addition, the floor-to-ceiling height can possibly be reduced, for further savings in the cost of building materials or the possibility of the addition of another floor.
1.4 European Natural Ventilation
In August of 2000, a three-week tour of European naturally ventilated commercial buildings was taken. Over twenty-five buildings of various sizes and uses were visited in the following
countries: Denmark, Germany, The Netherlands, Belgium, and the United Kingdom. The following criteria were looked at in evaluating each building:
Faeade Design - Some buildings feature double-skin facades, while others feature traditional manually operated windows. The goal was to assess how much control a user has over his environment by personal interaction with the faqade.
Lighting - In many buildings in the United States, a strong tint is required to control solar heat gain. Because of the reduction in daylight, artificial lighting must be used. On the tour, systems that maximized the use of daylight and minimized the use of artificial lighting were noted with particular interest. The use of daylighting can reduce internal heat loads, increasing the potential effectiveness of natural ventilation.
Building and Systems Layout - The floor layout of a building plays an important role in how well ventilation can work. Buildings can use various types of natural ventilation, as described before: stack, cross, fan-assisted, and single-sided.
Engineering and Architectural Integration - Some architects may not be willing to embrace natural ventilation because of its perceived interference with architectural design freedom. Some buildings visited on the trip showed that natural ventilation can still be effectively incorporated into the design of a building without compromising the integrity of an architects' design style. A growing group of architectural firms are now embracing the challenge of combining form with function.
Shading - Proper shading is a key component in all buildings. Shades from building to building varied in both their style and mounting location, as well as in their control.
Control Systems - Several aspects of building management systems were looked at. They included: temperature setpoints, lighting control, weather monitoring, occupancy sensing, fagade, window, and shading control.
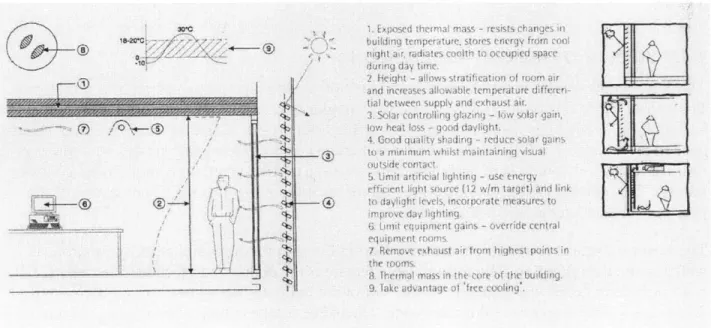
Exposed Thermal Mass - Naturally ventilated buildings perform better when there is a sufficient amount of exposed thermal mass such as concrete and brick. These materials can be used to soak up heat during the day and then cooled down during the night, through intensive ventilation. Particular attention was paid to novel approaches of exposing thermal mass. Cultural and User Perceptions - The success of natural ventilation depends on how willing occupants are to tolerating occasional discomfort due to high temperatures. Interviews focused on finding out how people in a particular region view natural ventilation. Also, information on office building regulations and fire codes was sought after. While technical data provides a good picture of whether a natural ventilation design is successful or not, the satisfaction of the users in a particular building is the ultimate concern.
A table summary of some of the buildings visited in each country is provided as follows:
Name Location Cross Stack Fan assisted Double- Night
ventilation ventilation natural skin cooling ventilation facade Dansk Magisterforening Roskilde University Sofiendal School Main Tower Victoria Insurance Tower RWE Tower Stadttor Dusseldorf European Patent Office Inland Revenue Castle Meadows University of Nottingham Jubilee Campus Queens Building Edinburgh Gate BRE Environmental Building Copenhagen, Denmark Roskilde, Denmark Copenhagen Suburbs, Denmark Frankfurt, Germany Dusseldorf, Germany Essen, Germany Dusseldorf, Germany Rijswik, Netherlands Nottingham, England Nottingham, England Leicester, England Harlow, England Garston, England I/ */ / '1~ / '7 / / / / / V
1.4.1 Dansk Magisterforening - Copenhagen, Denmark
The Dansk Magisterforening (Danish Magister Union) is located in Copenhagen. The project is a retrofit of an older building. The architect was Byens Tegnestue and the engineering was done by Wissenberg. The building is a five-floor commercial building featuring cross ventilation as the dominant natural ventilation strategy. The building retrofit was completed in July of 2000. A tour of the building was given by WindowMaster.
The overall building footprint is shallow, making cross ventilation effective. The floor-to-ceiling height is 3.5 meters, higher than in most commercial buildings. Larger, lower windows can be tilt inwards or manually swung open to the side. Smaller, upper windows are motorized and are controlled by the WindowMaster NV control system. Black, motorized, exterior shades provide protection from solar radiation. Exterior windows are tinted light gray to offer further reduction of solar heat gains.
Manually operated transom windows allow flow from one side of the building to the other. Some stack ventilation is possible through three separate stairwells; each with motorized windows and fans near the top. This method of ventilation appears not to be effective due to the small size of the stairwell openings, though.
Figure 5 Front faqade. Note the tilt windows that are open. The smaller top windows are motorized, while the larger ones are operated manually. The ground floor, which has not been retrofit, is not considered part of the union.
Figure 6 Manually operated transom
window. The window allows for cross ventilation through offices and interior corridors. Some objections have been raised over having manual control instead of automatic control for these critical windows.
If they are shut, only single-sided
ventilation, which is not as effective, is available.
Figure 7 Semi-transparent shading device on exterior. These blinds are motorized. Also, note the motorized
windows at the top. Controls for the blinds and windows are located on a panel below the window. The larger manually operated windows can either be tilt inward or opened to the side.
1.4.2 Roskilde University - Copenhagen Suburbs, Denmark
In August of 1998, a new building at Roskilde University was opened. The architect on the project was Henning Larsen, with engineering done by Crone and Koch. A tour of the building was given by WindowMaster.
The building is five stories tall. This fairly large building features fan-assisted stack ventilation, as well as cross ventilation. With stack ventilation, air passes through motor operated windows located in each office, into double-loaded corridors, and then into small atriums spaced
throughout the building complex. Fans pull building air through these atriums and subsequently discharge the air to the outside. Small lecture halls feature displacement ventilation. A walk-through of the building revealed fairly stale air, most likely because the ventilation systems were not functioning. Because corridor doors close in the evening for security reasons, stack
Ventilation Fan Located at Top of Atrium
Classroom or
Office
4,
~e~y Aru Atixm(DaWlDt
not shown)
Office Doot Hal
Thre e-story Fire Door
Attium Close4 at night
Air Flow Path
Figure 8 Partial schematic of floor plan. The arrow indicates a typical airflow path. Air is
hallway into three-story atriums. Fans located at the top of each atrium assist the process. brought through the
We observed several problems with this building. The main problem is that the exhaust vents in the atriums appear much too small to economically handle the volume flow rate of air required to ventilate each section of the building. The vents were approximately 10 cm in height. Also, although each atrium has a roof skylight that could aid stack ventilation, they are only opened if there is a fire.
Figure 9 Exterior view. Exterior shading is automatically lowered during non-academic times for security and
energy saving reasons. The windows above each shade can be operated by motor.
StHirs
Figure 10 Exterior detail view. The shaded windows
open into offices. The airflow path in the building is through the small windows above the shading, through transom windows into the hallway, and then into atriums like the one seen on the right side of the picture.
Figure 11 Transom window. These windows allow
for airflow movement through interior corridors into three-story atriums. These atriums exhaust air using high-volume fans.
Figure 12 Shading and window controls. These controls were placed on a panel one foot above the ground, making
them awkward to use. Also, the building managers made it a requirement that the window buttons be pushed down continuously for operation. Opening the window requires a lengthy one minute of push time.