Publisher’s version / Version de l'éditeur:
Vous avez des questions? Nous pouvons vous aider. Pour communiquer directement avec un auteur, consultez la première page de la revue dans laquelle son article a été publié afin de trouver ses coordonnées. Si vous n’arrivez pas à les repérer, communiquez avec nous à PublicationsArchive-ArchivesPublications@nrc-cnrc.gc.ca. Questions? Contact the NRC Publications Archive team at
PublicationsArchive-ArchivesPublications@nrc-cnrc.gc.ca. If you wish to email the authors directly, please see the first page of the publication for their contact information.
https://publications-cnrc.canada.ca/fra/droits
L’accès à ce site Web et l’utilisation de son contenu sont assujettis aux conditions présentées dans le site LISEZ CES CONDITIONS ATTENTIVEMENT AVANT D’UTILISER CE SITE WEB.
7th International Conference and Exhibition on Performance of Ships and
Structures in Ice [Proceedings], 2006
READ THESE TERMS AND CONDITIONS CAREFULLY BEFORE USING THIS WEBSITE. https://nrc-publications.canada.ca/eng/copyright
NRC Publications Archive Record / Notice des Archives des publications du CNRC :
https://nrc-publications.canada.ca/eng/view/object/?id=8757704c-2313-4b3c-91c3-cc981b9419b7
https://publications-cnrc.canada.ca/fra/voir/objet/?id=8757704c-2313-4b3c-91c3-cc981b9419b7
NRC Publications Archive
Archives des publications du CNRC
This publication could be one of several versions: author’s original, accepted manuscript or the publisher’s version. / La version de cette publication peut être l’une des suivantes : la version prépublication de l’auteur, la version acceptée du manuscrit ou la version de l’éditeur.
Access and use of this website and the material on it are subject to the Terms and Conditions set forth at
Performance of survival craft in ice environments
Performance of Survival Craft in Ice Environments
Michael LauInstitute for Ocean Technology, National Research Council of Canada St. John’s, NL, Canada
E-mail: Michael.Lau@nrc.gc.ca Antonio Simões Ré
Institute for Ocean Technology, National Research Council of Canada St. John’s, NL, Canada
E-mail: Antonio.Simoes_re@nrc-cnrc.gc.ca
ABSTRACT
The Institute for Ocean Technology (IOT, formerly the Institute for Marine Dynamics) of the National Research Council of Canada (http://iot-ito.nrc-cnrc.gc.ca/) has conducted physical and numerical simulations of a TEMPSC (Totally Enclosed Motor Propelled Survival Craft) design in ice environments as an integral part of a broader research program that seeks to develop performance standards for Escape, Evacuation, and Rescue (EER) systems in harsh environments. The main objectives of this work are to define practical performance measures for the TEMPSC design in ice covered waters by experimentally investigating the hull’s ice transiting resistance and its motions, and to validate a numerical model of lifeboat sail away. This paper reports on the physical model experiments and their comparison with numerical modeling.
KEY WORDS: lifeboat; ice floes; ice load; experiment; numerical.
INTRODUCTION
Oil production and marine transportation off the east coast and in the northern regions of Canada are affected by the presence of ice. Ice is seasonally present at east coast sites and in the event of an emergency it may hamper evacuation. Furthermore, ice is generally present in the north and evacuation systems must be equipped to deal with it. In either case there is very little information related to the performance of survival craft deployed in ice that would allow the development of performance measures or specifications.
The Institute for Ocean Technology (IOT, formerly the Institute for Marine Dynamics) of the National Research Council of Canada (http://iot-ito.nrc-cnrc.gc.ca/) has conducted physical and numerical simulations of a TEMPSC (Totally Enclosed Motor Propelled Survival Craft) design in ice environments as an integral part of a broader research program that seeks to develop performance standards for Escape, Evacuation, and Rescue (EER) systems in harsh environments. The main objectives of this work are to define practical performance measures for the TEMPSC design in ice covered waters by experimentally investigating the hull’s ice transiting resistance and its motions, and to validate a numerical model of lifeboat sail away. This paper report s on the physical model experiments and their comparison with numerical modeling.
Three series of model tests were performed in the IOT Ice Tank:
These tests were conducted using a 1:13 scale model of the TEMPSC survival craft. The results of the launching and over-powered sail-away tests are published in Simões Ré & Veitch (2003). The present paper documents the results of the resistance tests with the TEMPSC hull design towed at several speeds in open water and in pack ice. The thickness, percentage surface concentration, and floe diameter were varied.
The numerical analysis described in this paper was carried out using DECICE3D, a commercial discrete element code. The discrete element formulation was benchmarked and verified using the experimental data. This paper presents comparative results showing the effects of various configuration variables on performance, extending from light ice conditions up to extreme ice coverage through numerical simulations and physical model tests. Comparisons between the numerical results and experimental data provide a validation of the numerical model. The work provides a unique, valuable numerical tool to supplement future study of survival craft performance in ice conditions and to provide open water and ice performance profiles of the TEMPSC hull design.
MODEL TESTS
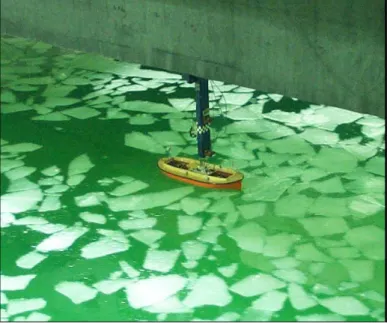
The resistance tests were performed using a specially instrumented lifeboat model (M545) that was attached to the ice tank carriage with a tow post (See Figure 1). The model was constructed of glass-reinforced plastic and was outfitted with a 32mm four-bladed propeller and a steering nozzle. The hydrostatic properties and hull data are summarized in Table 1. The vertical centre of gravity (VCG) and radii of gyration were obtained by swinging the TEMPSC model hull on a frame in air. The free-floating TEMPSC was oscillated in heave, pitch and roll to determine its natural periods and damping coefficients, which are summarized in Table 2.
The tow post was attached at the model’s center of gravity and restricted model motion in the yaw and sway directions. These tests were performed such that the lifeboat model was towed at various speeds through enough distance to provide 20 seconds of continuous data. Tests were performed in open water and in ice conditions of varying concentration, floe diameter, and thickness. Determining the resistance versus speed characteristics of open water allowed resistance due solely to ice interactions to be determined. The resistance tests were done following the power tests in the same ice sheets - one at 25 mm nominal ice thickness and one at 50 mm nominal ice thickness. These values correspond to full-scale nominal ice thicknesses of about 0.325 m and 0.650 m, respectively.
Paper No. ICETECH06-133-RF Lau 2 Fig. 1. Resistance test of TEMPSC design in pack ice using a tow pole
Table 1. Hydrostatic and mass properties of the Totally Enclosed Motor Propelled Survival Craft (TEMPSC) – M545
Property Full-Scale 1:13 Scale
Length Overall [m] 10.0 0.769
Beam at Mid-Ship [m] 3.30 0.259
Displacement [kg] 11800 5.38
Longitudinal Centre of Gravity [m] 4.98 0.383 Vertical Centre of Gravity [m] 1.34 0.103 Draft at Mid-Ship [m] 0.897 0.069
Table 2. Summary of data obtained for the decay simulations Experimental
Values
Final Values from Simulations Test ωn [rad/s] ζ [kg/s] ωn [rad/s] ζ [kg/s] Roll 2.15 0.027 2.15 0.027 Pitch 2.43 0.169 2.53 0.162 Heave 3.01 0.167 3.14 0.169
The experiments were carried out using columnar-grained corrected density EG/AD/S ice (Spencer and Timco, 1990). Ice densities were 881 kg/m3 and 868 kg/m3 for the 25 mm and 50 mm ice sheets respectively. The pack ice was modeled by initially cutting the level ice in the test area into strips. These strips were then broken apart into ice floes of target size. Removing level ice from the test area border, thereby increasing the water surface area, controlled pack ice concentration. The average flow diameter was computed over selected number of floes assuming circular floe geometry.
Flexural strength of the ice sheet was not a major concern during these experiments as there was no interest in the lifeboat’s capability as an icebreaker. However some tempering of the ice was performed to reduce the ice sheet strength to a nominal value of 40 kPa prior to testing.
A total of thirty-two resistance tests were performed: eight open water tests, five in ice at a thickness of 25 mm and 5/10ths concentration, six in ice at a thickness of 25 mm and 6/10ths concentration, five in ice at a thickness of 25 mm and 7/10ths concentration, four in ice at a thickness of 50 mm and 6/10ths concentration, and four in ice at a thickness of 50 mm and 7/10ths concentration.
TEST RESULTS AND DISCUSSIONS
The average resistance for each test run is shown in Figure 2. The total resistance in pack ice is considerably higher than the corresponding resistance in open water. It is clear that the major contributor to the increase in resistance is the ice thickness and floe diameter. Although the ice thickness was confounded with the ice floe diameter, further analysis as shown in this section had suggested large effect of floe diameter on ice resistance. Pack ice concentration appears to be a secondary effect, most noticeable at speeds above 0.5 m/s in the thinner ice. As expected, resistance increased with speed.
0 2 4 6 8 10 12 0.0 0.5 1.0 1.5 Velocity (m/s) R e s is ta n c e ( N ) Open Water H25_C5 H25_C6 H25_C7 H50_C6 H50_C7
Fig. 2. Model scale total average pack ice resistance vs. velocity (H refers to the thickness, C floe concentration, and B floe diameter)
Results of the resistance tests have been translated to full-scale values for salt water and have been re-analyzed to provide detailed statistical results. In the tests reported here, there was no breaking or significant submergence. Hence, for the calculation of resistance of the TEMPSC through the ice floes, the resistance was divided up into two different components:
ow c t R R
R = + (1) where: Rc is the resistance due to clearing of ice and Row is the resistance due to open water.
The clearing component due to pack ice was computed by subtracting the viscous drag on the model (calculating Cfaccording to the ITTC 1957 Ship Model correlation line). This force component was then non-dimensionalized into an Ice Resistance Coefficient, Cc, and plotted against a non-dimensional speed or Ice Froude Number Fni after Colbourne (2000), who developed a Froude Number based non-dimensional methodology for scaling and analyzing tests of moored
ship shaped vessels subject to ice loads from pack ice or icebergs. His analysis shows that the method provides reasonable data collapse to single curves based on the measured variables. The non-dimensional coefficients are defined as:
3 2 C V Bh R C i i c c ρ = 1 (2) ghC V Fni= (3) where:
i= density of the ice
B = maximum beam of the model h = ice thickness (m)
V = TEMPSC velocity (m/s)
g = gravitational acceleration (9.81 m/s2)
C = pack ice concentration (fraction between 0.5 and 1.0)
Using a viscosity of 1.7866x10⁻⁶ m2/s for fresh water at 0°C, and a wetted surface of 190 mm2 to estimate the viscous drag, the data is plotted as shown in Figure 3 with the following non-dimensional relationship: 1.29 16.1 i c n C = F − (4) This mean line derived from a squares fit to the data points can be used to scale the model data to full scale as shown in Figure 4.
y = 16.071x-1.2941 R2 = 0.7515 0 20 40 60 80 100 120 140 160 180 200 0.0 1.0 2.0 3.0 4.0
Ice Froude Number, Fni
R e s is ta n c e C o e ff ic ie n t, C c H=25cm, B=2.21m H=50cm, B=5.57m
Fig. 3. Data showing pack ice resistance coefficient versus Ice Froude Number (H refers to the thickness and B floe diameter)
Colbourne’s formulation does not include effects of floe size. One may expect that clearing of larger floes will be less effective than that of the smaller floes, and hence, it results in a larger clearing force. To examine this hypothesis, the data were grouped into two floe sizes using different symbols in Figure 3.
Within the data scattering the data do not suggest a larger influence of
1
Based on the data for ice transiting vessels, Colbourne’s analysis (2000) suggested that a cubic relationship between ice concentration and measured force provides the best data collapse to a mean line.
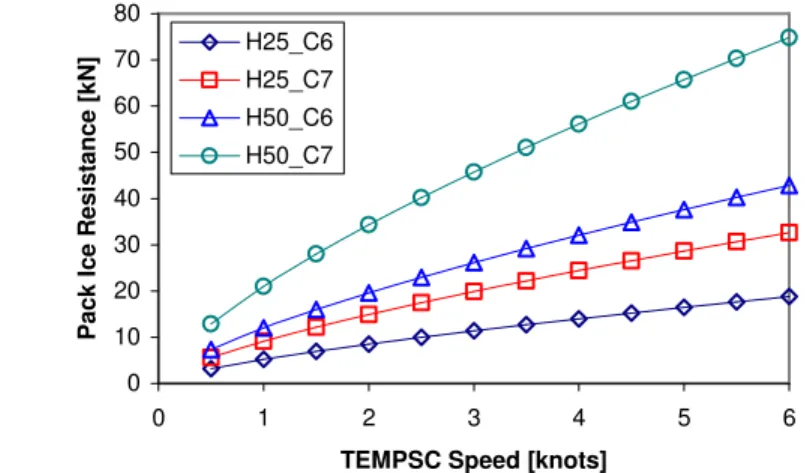
floe size on the non-dimensional force coefficient (see Figure 3); however, there was not enough floe size variation to allow a firm conclusion. 0 10 20 30 40 50 60 70 80 0 1 2 3 4 5 6
TEMPSC Speed [knots]
P a c k I c e R e s is ta n c e [ k N ] H25_C6 H25_C7 H50_C6 H50_C7
Fig. 4. Full scale pack ice load prediction (H refers to the thickness and C floe concentration)
NUMERICAL MODELING
We are in the process of developing a numerical model using a three-dimensional version of the discrete element code DECICE (Hocking et al., 1987) to investigate the various aspects of the interaction process between a ship and various ice features, including pack ice, level ice, and ice ridges. Various simulation techniques have been developed to closely represent these interactions numerically (Lau and Henley, 2004; Lau and Quinton, 2006). Such analysis is particularly useful to obtain detailed information, i.e. load distribution, energy, and stress states, which cannot be obtained experimentally.
The model presented in this paper was developed for a survival craft transiting in pack ice. The discrete element formulation was first benchmarked and verified using the resistance data of the TEMPSC in open water and in pack ice. We then used the numerical model to study the interaction processes in detail.
The computer program was developed for solving complex solid mechanics problems involving multiple interacting bodies undergoing fracturing. It is presently owned by Oceanic Consulting Corporation and is commercially available. The DECICE computer code is based upon a dynamic equilibrium explicit time stepping formulation and centres around a sophisticated housekeeping logic. The logic is specially designed to track the behaviour and response of a large number of deformable bodies efficiently. The bodies may be in contact with each other while undergoing large non-linear deformation and discrete fracturing. The algorithmic detail of DECICE is described in Hocking et al. (1987). The versatility of DECICE in modelling ice-related problems has been demonstrated in a number of recent works by the first author and his colleagues, including ice interactions with a bridge pier (Lau, 2001), jamming of floes at bridge piers (Lau, 1994), pack ice forces on structures from discrete floes (Lau et al., 1996), modelling of rubble shear properties and rubble loads exerted on multifaceted cones (Lau, 1999), ridge keel resistance during ice scouring (Lau et al., 2000), and ship manoeuvring in level ice (Lau, 2006).
Paper No. ICETECH06-133-RF Lau 4
The Numerical Model
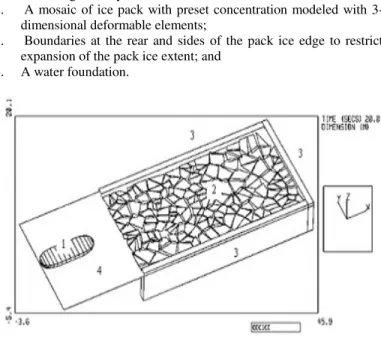
The DECICE simulation was performed at full-scale. The methodology and modeling assumptions used in the interaction model are described with a typical geometrical idealization shown in Figure 5. The discrete element model consists of the following components:
1. A ship model representing the TEMPSC with a prescribed advancing velocity;
2. A mosaic of ice pack with preset concentration modeled with 3-dimensional deformable elements;
3. Boundaries at the rear and sides of the pack ice edge to restrict expansion of the pack ice extent; and
4. A water foundation.
Fig. 5. Geometrical idealization of lifeboat in pack ice model used in DECICE simulation: (1-Rigid moving ship; 2-Free-floating pack ice; 3-Rigid Boundary; 4-Water Foundation)
Total run distance for each simulation was set to ten times the ship length to allow sufficient time for the development of a statistically significant ice resistance. The distance was estimated based on experience from previous model tests, and proved to be sufficient.
The TEMPSC Model
The TEMPSC was numerically modeled by a rigid motion element (ME) that allows motion in six degrees of freedom. The vessel was modeled without the canopy as only the hull was expected to have contact with the ice/water, and aerodynamic effects were not within the scope of this study. Numerical ballast, trim, decay, and open water resistance tests were performed to ensure that the numerical model results compared favourably with those measured in the model tests. A series of numerical ballast tests were run in order to verify and fine-tune the draft and trim of the conventional lifeboat numerical model. The mass of the vessel was reduced from 11820 kg to 11220 kg. Additionally, to eliminate the trim of the vessel, the LCG of the vessel was displaced from 4.979 m to 5.157 m.
The second series of hydrostatic tests involved running a number of decay simulations, and attempting to match the simulation results to those obtained in the experimental decay tests. The model’s natural frequencies and damping coefficients were re-produced to within 3.5% of the measured values. A detailed procedure for the above hydrostatic matching is given in Lau and Henley (2004).
Pack Ice Model
Pack ice sheets of varying concentration, floe area, and thickness were created using irregular 2D tessellations of 3- and 4-sided convex polygons. For each sheet, the polygons were generated randomly with average polygon (ice floe) area being the controlling parameter. The sum of the areas of these polygons divided by an encompassing rectangular area gives the desired concentration of pack ice. Implementing floe thickness was a simple matter of adding z-direction coordinates to the polygon vertices. Details of the pack ice model are given in Lau and Quinton, 2006.
The pack ice floes were resting on a water foundation. The buoyancy forces and moments acting on each element were calculated by integrating over the wetted surface of each element. The ice floes were modeled using simply deformable finite elements (SDFE’s) that allow deformation and fracture. In this model, the element is not allowed to fracture. The friction coefficient between ice floes was set to 0.2 as it was the average friction coefficient measured during the physical experiments
Open Water Resistance
To model the open water resistance, a fifth-degree polynomial least squares fit of the resistance vs. speed data collected from the open water resistance tests was performed resulting in the following equation to represent the hydrodynamic resistance of the model:
V V V V V Row 21.5 154 440 418 217 2 3 4 5 + − + − = (5)
The coefficients were entered directly into DECICE to compute open water resistance as a function of velocity. The wave making drag is expected to be proportional to V4, the smaller constant for V5 is consistent with this expectation.
Table 3 shows a comparison of the model predictions and the measurements for the open water runs. As shown in the table, the forces measured from the open water tests corresponded rather well to those found in the simulations, especially at higher speeds. The discrepancy found in the run with 0.52 m/s was due to the fact that the trend line used to calculate the values inputted into the numerical model was forced to intercept the origin. Therefore, any small experimental error in the testing would greatly affect the accuracy of values close to origin.
Table 3. Comparison of experimental to simulation tow force in water
Speed [m/s] Experimental Tow Force [N] Simulation Tow Force [N] Error |(Fs-Fe)/Fe| [%] 0.519 32 52 60 1.028 116 112 3 1.543 316 271 14 2.055 496 541 9 2.567 874 955 9 3.079 1724 1658 4 3.595 2858 3008 5 4.010 5446 5577 2
EFFECTS OF DRAG AND SPRING STIFFNESS ON ICE RESISTANCE
When the lifeboat impacts an ice floe, work is done to the ice floe to accelerate it. This work will result in a resistance on the lifeboat of an inertial origin. At the same time, the water drag on the moving ice will impose additional resistance to the lifeboat during the contact. For the inertial component of the ice resistance, the stiffness at the impact interface and the impact velocity are relevant variables, while the ice drag coefficient is important to model the drag force.
The discrete element modeling requires contact springs to transfer loads between elements. The effective normal and tangential spring stiffness of 1x10⁷ N/m2 was chosen for the present simulation. This value is consistent with those used in Babic´ et al. (1990), Savage (1992), and Løset (1994).
For small ice floes, most of the drag results from unbalanced pressure forces with negligible contribution from fluid friction; hence, only form drag was considered in this simulation with the water drag force and moment being defined, respectively, by:
2 2 v w e D D A V C F = ρ (6) 2 2 ω
ρ
ω
A C P D w D = (7) where:CD = the drag coefficient Ve = the velocity of the element
= the angular velocity of the element w = the density of water
Avand A = element projected “areas” for the vessel element
A value of 1.3 was selected from White (1986) for the drag coefficient. This value is for a rectangular floe with an aspect ratio of 1:10, i.e., for a 0.32 to 0.65 thick floe with a floe size of 2.5 to 5.3 m. To quantify the effect of the drag coefficient and the spring constant on ship resistance, a series of preliminary runs were conducted with these values systematically varied.
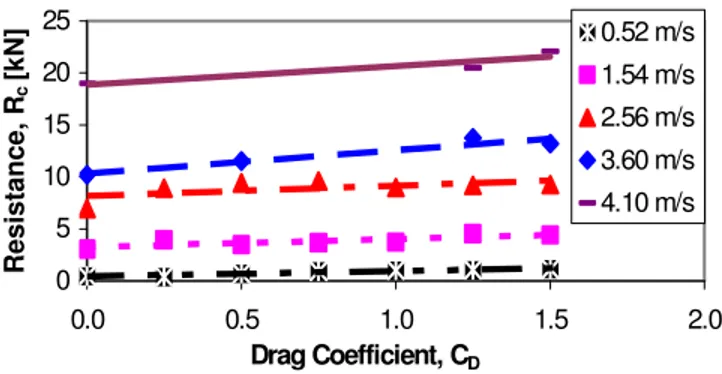
Figure 6 shows the effect of drag coefficient on ship resistance for the lifeboat transiting in 50 cm thick pack ice with 6/10ths concentration at various advancing speeds. The numerical predictions correspond to a run distance of 3 lifeboat lengths and a spring constant of 1x10⁷ N/m2. The computation shows a linear dependency of ice resistance on the drag coefficient and a higher order dependency on ship velocity, consistent with Eqs. 6 and 7. Furthermore, the drag coefficient has negligible influence on lifeboat resistance for these runs. The trend was expected, as the transfer of drag force to the lifeboat would only be possible during initial impact.
Figure 7 shows the effect of spring constant on ship resistance for the lifeboat transiting in 50 cm thick pack ice with 6/10ths concentration at various advancing speed. The numerical predictions correspond to a run distance of 3 lifeboat lengths with a spring stiffness ranging from 1x10⁶ N/m2 to 1x10⁸ N/m2. For these runs, the drag coefficient was set to zero. The result showed a negligible influence of spring stiffness on the resistance within the range of stiffness variation, despite some data scattering. This gives freedom to select a lower spring constant within the examined range of stiffness for computation efficiency.
0 5 10 15 20 25 0.0 0.5 1.0 1.5 2.0 Drag Coefficient, CD R e s is ta n c e , Rc [k N ] 0.52 m/s 1.54 m/s 2.56 m/s 3.60 m/s 4.10 m/s
Fig. 6. The influence of drag coefficient on pack ice
0 1 2 3 4 5 6 7 8 9 10
1.0E+05 1.0E+06 1.0E+07 1.0E+08 1.0E+09 Spring Stiffness, k R e s is ta n c e , Rc [ k N ] 0.52 m/s 1.54 m/s 2.56 m/s 3.60 m/s
Fig. 7. The influence of contact spring stiffness on pack ice resistance
EFFECT OF WALL CONSTRAINT ON ICE RESISTANCE
A proper modeling of the boundary condition at the pack ice edge is important for modeling of the pack ice extent. For a practical reason, a finite pack ice extent was modeled. A series of lifeboat transit runs were conducted to assess the effect of wall constraint on lifeboat resistance for the pack ice configuration selected for these simulations. In this series, the sidewalls were progressively relocated away from the pack ice edge to give various degrees of wall constraint. Two 50 cm thick pack ice concentrations of 6/10ths and 7/10ths were used and the lifeboat velocity was 2.56 m/s. Figure 8 shows the effect of the wall constraint on ship resistance. The computation shows a negligible effect of wall constraint on ice resistance for the lower concentration of 6/10ths. It can be shown that this trend is also representative of the thinner ice. This is because the lower concentration allows the lifeboat to push the pack ice around without a significant pack ice build up in front of the lifeboat as shown in Figure 9a. For a higher concentration of 7/10ths, the wall constraint became important as shown by a higher resistance associated with a wall offset of less than 0.25 m. (refer to the first two points in Figure 8.) For these runs, the wall constraint prevented the pack ice to clear from the lifeboat so a large amount of pack ice accumulated in front of and was pushed by the lifeboat as shown in Figure 9b. This accumulation, which was not observed in the model test, was a result of the inaccurate simulation of the pack ice boundary condition. This can be remedied by slightly increasing the wall offset by 50 cm to allow the expansion of the pack ice extent to prevent the ice build up in front of the lifeboat.
Paper No. ICETECH06-133-RF Lau 6 0 5 10 15 20 25 30 35 40 45 0 1 2 3 4 Wall Offset [m] R e s is ta n c e , Rc [ k N ] H50_C7 H50_C6 H25_C6
Fig. 8. The influence of ice pack boundary condition on pack ice resistance (V = 2.56 [m/s])
Fig. 9. Small floes with low concentration (a) and large floes with high concentration and accumulation (b)
SIMULATION RESULTS AND DISCUSSIONS
A total of 24 simulations were set up according to the mechanical properties of the ice and the preset TEMPSC velocity for each test run. Details of the simulation are not given here, but some general trends are discussed in the following section.
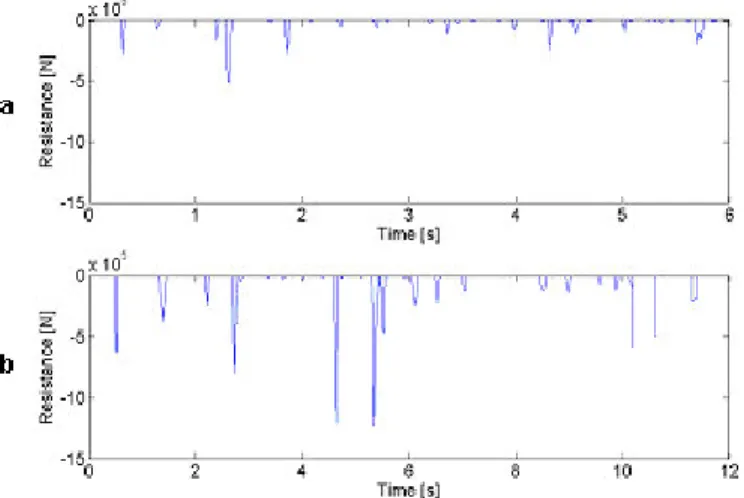
Figure 10 shows snapshots of a typical simulation for smaller floes with lower ice concentration, and Figure 11 for larger floes with higher ice concentration. Most interaction consisted of a series of discrete ice impact events. During the impact, the pack ice was pushed aside. Some smaller floes may have slid under the hull as shown in Figure 10b. For larger floes, more head-on impact events were observed with a higher chance for the ice to be pushed ahead as shown in Figure 11b. Larger floes and higher concentrations increased the chance for accumulation ahead of the lifeboat with a larger and more intense loading event as shown in Figure 12.
Fig. 10. Small floes with low concentration at start time (a), mid run (b), and end time (c)
Fig. 11. Large floes with high concentration at start time (a), mid run (b), and end time (c)
Fig. 12. Time histories of pack ice clearing resistance for small floes of low concentration (a) and for large floes of high concentration (b)
A plot of predicted versus measured resistance is shown in Figure 13. Despite the discrepancy between the simulated ice configuration and that observed in the model test, a good agreement exists between the computed resistance and the experimental measurements. On average, the numerical model slightly underestimates the resistance.
0 5 10 15 20 25 30 0 5 10 15 20 25 30 Measured Resistance (kN) S im u la te d R e s is ta n c e ( k N ) M13_H25_C5 M13_H25_C6 M13_H25_C7 M13_H50_C6 M13_H50_C7 1:1 Fit Fig. 13. Comparison of DECICE simulation and model test resistance results
The simulation result for the 4 m/s run with 50 mm ice thickness and 7/10th floe concentration was not included. The numerical prediction for this run was 50kN, while 18 kN was measured from model test. The last discrepancy for this simulation condition may be due to the set-up of the numerical problem, in which the floes were not allowed to fracture. Such condition may not be realistically modelled the test condition, as one would expect ice breaking at this high impacting speed. If the floes were allowed fracturing, the load would be substantially lower.
CONCLUSIONS
This paper reports results of physical model experiments on a conventional TEMPSC model in pack ice and subsequent numerical modeling. The experimental data was non-dimensionalized to provide reasonable data collapse to a single curve. This mean line derived from a squares fit to the data points can be used to scale the model data to full scale. A numerical formulation was developed, benchmarked, and verified using the experimental data. This paper presents comparative results showing the effects of various configuration variables on performance, extending from light ice conditions up to extreme ice coverage through numerical simulations and physical model tests. Despite a limited amount of experimental data, the numerical analysis gave a favorable prediction. The work has shown that DECICE may be a valuable numerical tool to supplement future study of survival craft performance in pack ice conditions. Future work will include a refinement of the numerical model to include various boat forms, maneuvers, ice features and wave actions,as well asan extensive series of numerical and physical experiments with the aim of defining practical performance measures for the survival craft design in ice covered waters
ACKNOWLEDGMENTS
The authors would like to acknowledge the financial support of the Program of Energy Research and Development (PERD) through the Marine Transportation and Safety POL, and the Atlantic Canada Opportunities Agency (ACOA) through its Atlantic Innovation Fund. Bruce Quinton assisted in the numerical simulation. Their assistance is gladly acknowledged.
REFERENCES
Babic´, M., Shen, H. T., and H. Bjedov, 1990. "Discrete Element Simulations of River Ice Transport," Proc. IAHR Ice Sym. Espoo, pp.564-574.
Colbourne, D. B., 2000. “Scaling Pack Ice and Iceberg Loads on Moored Ship Shapes,” Oceanic Engineering International, 4 (1): 39-45.
Hocking, G., Mustoe, G.G.W., and J.R. Williams, 1987. “Dynamic Analysis for Generalized Three-Dimensional Contact and Fracturing of Multiple Bodies,” NUMETA, Balkema Publications, Swansea, UK, 1989.
International Towing Tank Conference (ITTC), 1957. Proceedings of the 8th ITTC, Madrid, Spain, published by Canal de Experiencias Hidrodinamicas, El Pardo, Madrid.
Løset, S., 1994. "Discrete Element Modeling of a Broken Ice Field - Part I: Model Development," Cold Regions Science and Technology, Vol. 22, pp.339-347.
Lau, M., 2001. “A Three Dimensional Discrete Element Simulation of Ice Sheet Impacting a 60-Degree Conical Structure,” Proceedings of the 16th International Conference on Port and Ocean Engineering under Arctic Conditions, POAC’01, Ottawa, Ontario, Vol. 1, pp. 431-440.
Lau, M., 1999. “Ice Forces on a Faceted Cone due to the Passage of a Level Ice Field,” Ph.D. Thesis, Memorial University of Newfoundland, St. John’s, NL, Canada.
Paper No. ICETECH06-133-RF Lau 8 Lau, M., 1994. “Pack Ice Jamming Simulation: DECICE2D,” National
Research Council of Canada, Institute for Marine Dynamics, St. John's, NL, Canada.
Lau, M., and Henley, S., 2004. “DECICE Implementation of Ship Resistance in Ice: Part 1 - Hydrodynamic Modeling,” Report LM-2004-16, Institute for Ocean Technology, St. John's, NL, Canada. Lau, M. and Quinton, B., 2006. “DECICE Implementation of Ship
Resistance in Ice: Part II – Ship in Pack Ice Modeling,” Institute for Ocean Technology, St. John's, NL, Canada.
Lau, M., 2006. “Discrete Element Modeling of Ship Maneuvering in Ice,” 18th International Symposium on Ice, Sapporo, JAPAN (IAHR Ice Symposium 2006), Aug. 28 – Sept. 01, 2006, in preparation. Lau, M., McKenna, R.F., Spencer, D., Walker, D. and G.B. Crocker,
1996. “Modelling Pack Ice Forces on Structures from Discrete Floes,” Marineering Ltd., St. John's, NL, Canada.
Lau, M, Phillips, R., McKenna, R.F., and S.J. Jones, 2000. “Discrete Element Simulation of Ridge Keel Resistance during Scouring: A Preliminary Study,” Proc. 2nd Ice Scour & Arctic Marine Pipelines Workshop, Mombetsu, Hokkaido, Japan.
Simões Ré, A. and Veitch, B., 2003. “Performance Limits for Evacuation Systems in Ice,” Proc. of the 17th international conference on port and ocean engineering under arctic conditions, POAC ’03, Vol. 2, pp. 807-817, Trondheim, Norway.
Savage, S. B., 1992. “Marginal Ice Zone Dynamics Modelled by Computer Simulation Involving Floe Collisions,” Rep. to the Institute for Mechanical Engineering, National Research Council Canada.
Spencer, D.S., and Timco, G.W., 1999. “CD Model Ice – a Process to Produce Correct Density (CD) Model Ice,” Proc.10th International IAHR Symp. on Ice, Vol. 2, Espoo, Finland, pp. 745-755.
White, F. M., 1986. Fluid Mechanics, 2nd ed., McGraw-Hill, New York.
![Fig. 8. The influence of ice pack boundary condition on pack ice resistance (V = 2.56 [m/s])](https://thumb-eu.123doks.com/thumbv2/123doknet/14180805.476223/7.918.479.858.53.431/fig-influence-ice-pack-boundary-condition-pack-resistance.webp)