HAL Id: inserm-00849274
https://www.hal.inserm.fr/inserm-00849274
Submitted on 5 Oct 2013
HAL is a multi-disciplinary open access
archive for the deposit and dissemination of
sci-entific research documents, whether they are
pub-lished or not. The documents may come from
teaching and research institutions in France or
abroad, or from public or private research centers.
L’archive ouverte pluridisciplinaire HAL, est
destinée au dépôt et à la diffusion de documents
scientifiques de niveau recherche, publiés ou non,
émanant des établissements d’enseignement et de
recherche français ou étrangers, des laboratoires
publics ou privés.
Angular Resolution Diffusion MRI
Aymeric Stamm, Olivier Commowick, Patrick Pérez, Christian Barillot
To cite this version:
Aymeric Stamm, Olivier Commowick, Patrick Pérez, Christian Barillot. Tracking the Cortico-Spinal
Tract from Low Spatial and Angular Resolution Diffusion MRI. MICCAI 2013 DTI Tractography
Chal-lenge on Peritumoral White Matter Anatomy for Neurosurgical Decision-Making, Sep 2013, Japan.
pp.43-53. �inserm-00849274�
Spatial and Angular Resolution Diffusion MRI
Aymeric Stamm1, Olivier Commowick1, Patrick P´erez2, and Christian Barillot1
1 VISAGES: INSERM U746 - CNRS UMR6074 - INRIA - Univ. of Rennes I, France 2 Technicolor, Rennes, France
Contact: [email protected]
Abstract. In this work, we present a pipeline to reconstruct the corti-cospinal tract (CST) that connects the spinal cord to the motor cortex. The proposed method combines a new geometry-based multi-compartment diffusion model coined Diffusion Directions Imaging and a new adaptive multi-modal particle filter for tractography. The DTI Tractography chal-lenge proposes to test our methods in the context of neurosurgical plan-ning of tumor removal, where very low spatial and angular resolution diffusion data is available due to severe acquisition time constraints. We took up the challenge and present our reconstructed CSTs derived from a single-shell acquisition scheme at b = 1000 s/mm2 with only 20 or 30
diffusion gradients (low angular resolution) and with images of 5 mm slice thickness (low spatial resolution).
1
Introduction
The advent of diffusion-weigthed (DW) MRI offers a unique way to explore the functional architecture of the brain non-invasively and in-vivo [1]. One of the most appealing applications of DW-MRI is the reconstruction of the numerous white matter (WM) fascicles that carry the information between the body cells of the different neurons [2].
Among the many fascicles of the WM, the cortico-spinal tract (CST), which connects the spinal cord to the cerebral motor cortex, is one of the most impor-tant fascicles because it carries the necessary information for keeping the motor functions on track. However, its reconstruction is most challenging because, not only in some regions of the brain other fascicles may cross with the CST, but the CST itself is made of several bifurcating sub-fascicles to ensure connections with the whole motor cortex. Indeed the motor cortex, represented by the ho-munculus of Penfield & Rasmussen [3], is made of areas that are connected to the spinal cord via straight line sub-fascicles but also of more lateral regions such as the hand or the face areas that are connected to the spinal cord with fanning sub-fascicles.
The reconstruction of white matter fascicles involves two steps. First, the choice of an appropriate diffusion model is needed for extracting meaningful in-formation out of the DW images such as the diffusion orientations. Then, these orientations are confounded with the orientations of the fascicles and used as
input for deterministic or probabilitic algorithms, known as tractography algo-rithms, that perform the actual reconstruction of the fascicles [4]. When simple diffusion models like diffusion tensor imaging (DTI) [5] or ball-and-stick [6] and simple deterministic streamline tractography algorithms like FACT [7] are used to reconstruct the CST, fanning sub-fascicles are often missing [6].
In this third edition of the DTI tractography challenge, the organizers pro-vided us with clinical DW-MRI data of patients suffering from brain tumors. The angular and spatial resolutions of the data are very low: 20 or 30 diffusion sensitizing gradient (DSG) encoding directions distributed on a single shell at b = 1000s/mm2and slices of 5mm thickness, raising the demand for new
appro-priate diffusion models and/or tractography algorithms that may manage that type of data and propose an accurate reconstruction of the CST.
We proposed a diffusion model coined Diffusion Directions Imaging (DDI) [8– 10] that meets these requirements even when using a simple deterministic stream-line algorithm [11, 12]. We also recently design a probabilistic tractography algo-rithm based on an adaptive multi-modal particle filter [13] that is able to tract multiple fascicles over extended volumes. In section 2, we briefly describe these different tools and summarize the tractography pipeline applied to the challenge data. In section 3, we present our reconstructed CSTs. Evaluation is left to the organizers who designed specific comparative metrics.
2
Methods
2.1 Diffusion Modeling
The diffusion model we use in this work [8–10] is a multi-compartment model (MCM): water molecules are assumed to be either in the cerebro-spinal fluid (CSF) or in one of M non-collinearly arranged WM fascicles.
In a pulse gradient spin echo (PGSE) sequence [14], diffusing water at an initial position x0undergoes at the echo time a random displacement x = x0+
p2(∆ − δ/3)y, where ∆ is the diffusion time between two successively applied DSGs, δ is the pulse duration of each DSG and y is the quantity often simply referred to as the random molecular displacement.
Water in the CSF experiences free unrestricted isotropic diffusion, which is well modeled assuming that y follows a zero mean 3-dimensional isotropic Gaus-sian distribution with variance (diffusion coefficient) D0= 3.0×10⁻³mm2/s [15].
In the following, we will describe how we model the diffusion within a fascicle, how we encompass these single-fascicle models within an MCM and how we estimate the resulting set of independent parameters.
Diffusion within a fascicle Assuming a unique orientation of diffusion ±µ, water molecules can undergo a diffusive motion along the direction +µ or the direction −µ with equal probability. Mathematically, it reads: y = ξw++ (1 −
molecular displacements along directions +µ and −µ, respectively, and ξ is an independent Bernoulli random variable.
We then propose to model the random variable w+ (the modeling of the
random variable w− is identical with −µ instead of +µ) as w+= v + z, where:
– vfollows a von Mises & Fisher distribution [16] parametrized by (i) the radius√νd of the sphere on which it is defined, (ii) the spherical coordinates (θ, φ) of its mean direction µ and (iii) its concentration parameter κ ≥ 0; – zfollows a centered Gaussian distribution parametrized by a cylindrically
constrained covariance matrix D =(1−ν)dκ+1 (I3+ κµµ0), where I3 is the 3 × 3
identity matrix and {µ, κ, ν, d} are the same parameters that characterize v; – vand z are statistically independent.
In essence, (i) ±µ can be interpreted as the local orientation of the fascicles which constrain the diffusion, (ii) κ can be interpreted as a measure of orienta-tional dispersion, (iii) ν can be interpreted as the proportion of the extra-axonal space and (iv) d can be interpreted as the free diffusivity along the orientation of the fascicle.
A three-dimensional probability density function (PDF) of the molecular displacement y in the fascicle is then obtained by a mixture of two equally weighted PDFs, each one of them being the convolution of the von Mises & Fisher PDF and the Gaussian PDF previously described.
It is possible to analytically compute all the central moments of this distri-bution. In particular, the second-order central moment of its projection onto the orientation of the fascicle, known as the parallel (or axial) diffusivity, has been consistently estimated by both diffusion tensor imaging (DTI) [17] and diffu-sion kurtosis imaging (DKI) [18] to Dfascicle
! = 1.71 × 10⁻³mm
2/s. Setting this
constraint in our model yields the following relationship between the parameters:
Dfascicle ! = d (1 − 2νξ(κ)) , with ξ(κ) = coth κ κ − 1 κ2. (1)
Consequently, the PDF that characterizes the diffusion within a fascicle is parametrized by four parameters, namely (i) the polar angle θ ∈ [0, π/2], (ii) the azimuth angle φ ∈ [0, 2π] that defines ±µ, (iii) κ ≥ 0 and (iv) ν ∈ [0, 1].
Multi-Compartment Model Assuming that a given voxel is composed of M non-collinearly arranged fascicles, we can build an MCM by defining the PDF of molecular displacements y at the voxel level as a finite mixture of M PDFs as defined in section Diffusion within a fascicle with weights wi (i = 1, . . . , M ),
plus a zero-mean isotropic Gaussian PDF with variance D0= 3.0 × 10⁻³mm2/s
with weight w0= 1 −PMi=1wi to account for CSF contamination [15].
The weight wi of the i-th fascicle represents its fraction of occupancy in the
voxel and is therefore proportional to the volume of the fascicle. It can be shown that, when the diffusion in the fascicle is modeled as in section Diffusion within a fascicle, it boils down to assume that the fascicle is geometrically represented
by a cylinder whose volume is given by: Vi∝ π!Dfascicle ! "3/2 1 − 2νiξ(κi) ✓ 1 − νi κi+ 1 + νiξ(κi) ◆ , so the weight wi is determined accordingly.
The independent parameters of the final model are thus:
– the polar angle of the orientation of each fascicle (M parameters), – the azimuth angle of the orientation of each fascicle (M parameters), – the orientational dispersion measured by κ, common to all fascicles, – the extra-axonal fraction of occupancy ν, common to all fascicles, – the CSF fraction of occupancy w0.
Estimation of the proposed model Assuming that the diffusion process can be modeled as described in sections Diffusion within a fascicle and Multi-Compartment Model yields an analytic link between the MR signal attenuation and the parameters of the diffusion model [8–10]. The MR signal attenuation measured by the receiver coils of an MRI scanner is affected by Rician noise [19], which is shown to be well approximated by a Gaussian distribution for moderate to high signal-to-noise ratios (SNR). The mean of the distribution is however shifted away from the true MR signal attenuation. We will thus estimate the 2M + 3 parameters of the model by minimizing the sum of squared errors after a denoising pre-processing step to ensure that the mean of the noise distribution matches the actual MR signal attenuation.
Although we previously performed the optimization problem using the BOBY– QA derivative-free algorithm [20], we experienced recently that the cost function cannot always be efficiently approximated by a quadratic function and found that the COBYLA derivative-free algorithm [21], which relies on only linear ap-proximations of the cost function, leads to much more robust results even if it is slower than BOBYQA. To speed up the convergence of the COBYLA algo-rithm, we initialized the orientations of the fascicles by a previously estimated ball-and-stick model [6], which is a particular case of our model for κ → ∞ and ν = 0.
2.2 Tractography Algorithm
The objective of tractography is to reconstruct WM fascicles (here the CST) using the diffusion information provided by an underlying diffusion model (in this case, the model described in section 2.1). Tractography may be seen through two angles: one may want to generate all possible fascicles that connect two points in the WM or one may focus on generating all possible fascicles arising from a seed region without constraining the other extremity. In this section, we tackle the second case.
Our tractography algorithm [13] is based on multi-modal particle filters. Par-ticle filters are a way to sequentially approximate the so-called filtering distribu-tion, which, in the case of tractography, is the distribution of all possible fascicles
generated from a seed region given the diffusion data. The use of particle filters to sequentially approximate this filtering distribution has been introduced in [22], who designed a mono-modal particle filter based on the DTI model for WM tractography. The work of [23] improved the algorithm by constructing still a mono-modal particle filter but based on the Q-Ball model [24], which better identifies multiple different fascicle orientations in the model estimation step. If one knows the particle representation of the filtering distribution at a given step, the mono-modal particle filter works in three stages to update it one step ahead, which are:
– sample new proposals for the next direction to follow and extend each par-ticle (i.e., each fascicle) accordingly: the sampling is performed using a mixture of one or more von Mises & Fisher distributions, depending on the number of different fascicles that the underlying diffusion model was able to detect;
– update the weight of each particle so that the sample still properly rep-resents the filtering distribution at the new step: the update equation involves a prior distribution on the next direction that basically gives more weight to directions collinear to the last one of the particle, the likelihood of the estimated diffusion model given the data and the proposal distribution;
– occasionally resample particles according to their weights to avoid weight degeneracy [25].
However, both tractography algorithms suffer from an intrinsic drawback of particle filters: they have hard time maintaining the multi-modality of the fitering distribution, meaning that they are not able to tract multiple fascicles over extended volumes [26]. We therefore proposed a multi-modal particle filter that approximates the filtering distribution without losing the multi-modality nature of this distribution. It works by clustering the particles at each step. In details, once new particles have been found following the previously described steps, a reclustering of the particles is performed by first testing the clusters pairwise for merging and then testing each cluster for splitting:
– Merging clusters: each cluster is averaged to obtain a unique representative fascicle based on the particle weights and the distance between the mean fascicle of two clusters is computed as the maximum among all the distances between their positions at each previously recorded position; if this maximum is below a given threshold, then the two clusters are merged;
– Splitting a cluster: cluster m is then characterized by a von Mises & Fisher distribution, computing the mean direction µm,k and concentration parameter
m,kat step k as follows [27]: rm,k:= P `∈Im,kv (`) k |Im,k| , µm,k= rm,k krm,kk , m,k= krm,kk(3 − krm,kk 2) 1 − krm,kk2 , (2)
where v(`)k is the proposed direction for particle ` at step k and Im,k is the set
of indices of the particles that belong to cluster m at step k. A cluster is splitted if m,k drops below a threshold, indicating a too important loss of coherence in
We report the reader to [13] for further details and implementation of the proposed algorithm. In summary, the algorithm has the following user-defined parameters:
– a fractional anisotropy (FA) threshold FAt that is used to stop extending
a fascicle if it reached a region of too low FA, – the step length ρ,
– the number of particles N ,
– the maximum length of the particles Lmax,
– the minimum number of particles in a cluster Nmin,
– a relative threshold Mt on the effective sample size to determine when
performing resampling of the particles,
– a threshold Misoon the fraction of occupancy of the CSF compartment to
stop the extension of a fascicle that reached a voxel that contains (almost) only CSF,
– the concentration parameter κprior of the prior distribution on the
direc-tions, which controls the smoothness of the reconstructed fascicles, – a threshold Dmerge for merging clusters,
– a threshold κsplit for splitting clusters.
2.3 Tractography Pipeline Applied to the Challenge Datasets We utilize the following processing pipeline to extract the CST for the challenge datasets. An expert neuroanatomist delineated two ROIs on each side (left and right) of the color FA images extracted from the diffusion tensor images provided by the challenge organisers. One is located in the posterior limb of the internal capsule and the other in the superior part of the mesencephalon. In addition, since crossing fiber tracts such as the association or commissural fiber tracts may be considered as bifurcations of the CST by the tractography algorithm, the same expert also delineated regions through which the tracts are not allowed.
All datasets were then processed in three steps:
1. Non-Local Means denoising: We filtered the diffusion-weighted MR images with the Rician-adapted Non-Local Means filter [28], which has been shown to efficiently denoise such images while preserving fine anatomical structures. 2. DDI model estimation: We estimated the DDI MCMs from the denoised DW images up to M = 3 fascicles and averaged them to obtain a 3-fascicles DDI averaged MCM.
3. Extraction of the left and right CST using the delineated ROIs and the DDI volume and our multi-modal particle filter approach.
All the software used in this challenge (DDI estimation and tractography) was implemented utilizing ITK and VTK and is fully multi-threaded. This software will be made available as a free package soon.
3
Results
The 2013 MICCAI DTI tractography challenge consists of three patients suf-fering from tumors of various forms and grades. In addition to DWI, T1, T2 weighted or FLAIR images were available along with the delineation of the tu-mors of the two patients so that joint views of anatomical and tractography information could be created to help the surgeon, for example, to plan a tumor removal surgery. For the third patient, two sets of images were acquired at two close timepoints, one with 20 directions and one with 30 directions.
On both patients, the estimation of the DDI volumes took about 150 min-utes on a 8-core Xeon 3 GHz computer while the tractography of each CST took about 25 minutes on the same machine for N = 5000 initial particles (the computational time is proportional to N ). The model estimation step is longer but still reasonably short and can be performed offline in a clinical context. The following parameters were used for the tractography algorithm: FAt= 0.5, ρ = 1
mm, N = 5000, Lmax = 20 cm, Nmin = 10, Mt = 0.8, Miso = 0.8, κprior = 30,
Dmerge= 0.5 mm and κsplit= κprior= 30.
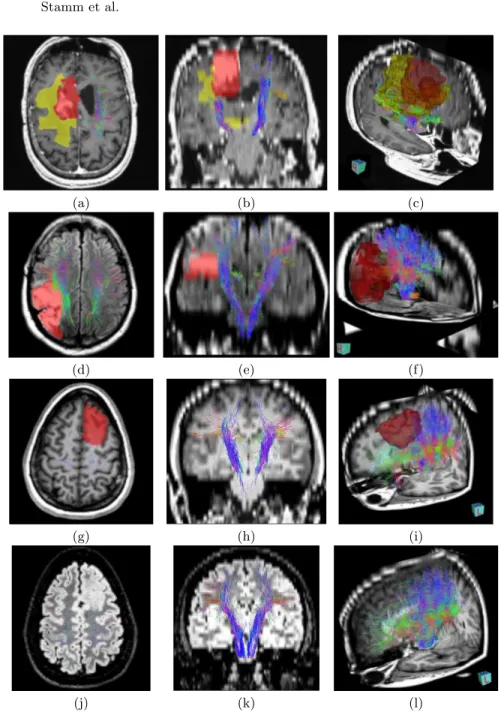
Figure 1 presents axial and coronal views of the left and right CST extracted on both patients, superimposed on the T1w image for patient 1 and on the FLAIR image for patient 2. In addition, we superimposed the manual delin-eations and provide 3D visualizations to evaluate the relative positions of the tumor and motor pathways.
Several remarks may be expressed for the first patient. First, the left CST, which is not affected by the tumor, is able to spread into the different motor cortex regions (see fig. 1a,b) thanks to the combination of the DDI multi-fascicle model and our multimodal probabilistic tractography algorithm. On the con-trary, the right CST is not going into the tumor part (red and green, fig. 1a,b) while still being able to capture some bifurcations and to go a little through the edema area (fig. 1a-c). Therefore, the number of fibers found on the right side is lower than on the left side of the brain. Finally, the 3D view highlights a close proximity between the tumor and the motor pathways, and therefore provides crucial information to the surgeon in case another surgical resection is planned. The second row of fig. 1 presents results for patient 2. Both CSTs are well extracted, showing some bifurcations towards several regions of the motor cortex. The number of fibers in the right CST is lower than in the left CST (see fig. 1d,e), which is due to the presence of the tumor. The fibers are indeed not going through this specific area and therefore spread less than on the left side. Again, the 3D view provides an important insight into the relative positions of the tumor and the CST, showing a very close proximity of the interior part or the tumor with the CST, which will help the neurosurgeon in his decisions.
For patient 3, one may notice that the left CST goes partially inside the tumor (see the axial views) and then stops very quickly. However the tumor seems to be at an earlier stage than for some of the other patients and this therefore seems reasonable. In addition, one can notice that even with a very low number of directions, our algorithms are able to capture bifurcating fibers to the motor cortex (see coronal views for patient 3).
(a) (b) (c)
(d) (e) (f)
(g) (h) (i)
(j) (k) (l)
Fig. 1. Illustration of CST on the Three Challenge Patients. Integrated views of the obtained fiber tracts of patient 1 overlayed on T1 (a,b,c), of patient 2 overlaid on FLAIR (d,e,f), and of patient 3 (g-i) illustrating the proximity of the tumor to crucial motor pathways. Patient 3 is illustrated utilizing the DWI images with 20 directions (g,h,i) and with 30 directions (j,k,l). Regions of interest on patient 1 correspond to the solid tumor (green), the tumor (red) and edema (yellow). The regions of interest on patient 2 and patient 3 correspond to the tumor (red). (a,d,g,j) and (b,e,h,k) are respectively axial and coronal views, while (c,f,i,l) are 3D views.
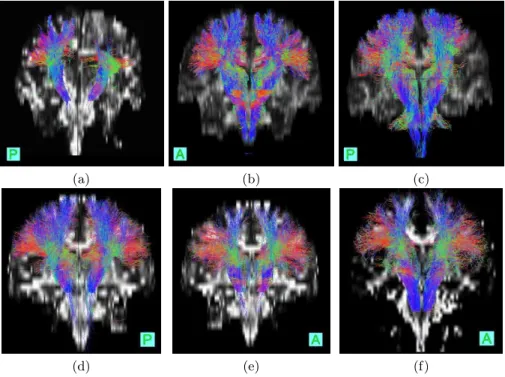
Figure 2 shows the reconstructed CSTs on both patients overlaid on the FA map. For patient 1 (fig. 2a), we can see that the tumor completely prevents the CST from reaching the motor cortical areas except for the most lateral ones. For patient 2 (fig. 2b,c), we observe that the CST covers all the areas of the motor cortex away from the tumor (fig. 2b) but the most lateral parts are not reached in the vicinity of the tumor (fig. 2c). Finally, for patient 3, the tracts for 20 directions (fig. 2d,e) and 30 directions (fig. 2f) are very close to each other, showing the robustness of our approach and its ability to capture bifurcations of the CST even with a low number of gradients in the diffusion acquisition.
(a) (b) (c)
(d) (e) (f)
Fig. 2. Reconstructed CSTs overlaid on the FA map. Coronal view of the re-constructed CSTs overlaid on FA map for patient 1 (a), patient 2 (b,c), and patient 3 with 20 directions (d,e) and 30 directions (f). In particular, on patient 2, we observe that the CST covers all the areas of the motor cortex away from the tumor (b) but the most lateral parts are not reached in the vicinity of the tumor (c). One can also notice for patient 3 that results for 20 or 30 directions are very close, showing the robustness of our tractography.
4
Conclusion
In summary, we proposed a tractography pipeline that includes: (i) the use of the DDI MCM as diffusion model, which can be accurately estimated from low
spatial and angular resolution dMRI and (ii) its integration into a multimodal particle filtering approach for WM tractography, which is able to track multiple fascicles over extended volumes. Combining these two methods provides very promising results. Indeed, with the challenge data, which consisted this year in the scan of two patients with two different types of tumors, with a single-shell (b = 1000 s/mm2) acquisition comprising only 20 encoding directions, we are
still able to reconstruct the full extent of the CST away from the tumor and to represent how the CST shape is modified (contracted or interrupted) by the presence of the tumor.
References
1. Le Bihan, D.: Looking into the functional architecture of the brain with diffusion MRI. Nature Rev. Neurosci. 4(6) (2003) 469–80
2. Jellison, B.J., Field, A.S., Medow, J., Lazar, M., Salamat, M.S., Alexander, A.L.: Diffusion tensor imaging of cerebral white matter: a pictorial review of physics, fiber tract anatomy, and tumor imaging patterns. Am. J. Neuroradiol. 25(3) (2004) 356–69
3. Penfield, W., Boldrey, E.: Somatic motor and sensory representation in the cerebral cortex of man as studied by electrical stimulation. Brain 60(4) (1937) 389–443 4. Lazar, M.: Mapping brain anatomical connectivity using white matter
tractogra-phy. NMR Biomed. 23(7) (2010) 821–35
5. Basser, P., Mattiello, J., Le Bihan, D.: MR diffusion tensor spectroscopy and imaging. Biophys. J. 66(1) (1994) 259–67
6. Behrens, T., Johansen-Berg, H., Jbabdi, S., Rushworth, M., Woolrich, M.: Proba-bilistic diffusion tractography with multiple fibre orientations: What can we gain? NeuroImage 34(1) (2007) 144–55
7. Mori, S., Crain, B.J., Chacko, V.P., van Zijl, P.C.: Three-dimensional tracking of axonal projections in the brain by magnetic resonance imaging. Ann. Neurol. 45(2) (1999) 265–269
8. Stamm, A., P´erez, P., Barillot, C.: Diffusion directions imaging. Research Report RR-7683, INRIA (2011)
9. Stamm, A., P´erez, P., Barillot, C.: A new multi-fiber model for low angular reso-lution diffusion MRI. In: Proc. I. S. Biomed. Imaging, IEEE (2012) 936–939 10. Stamm, A., P´erez, P., Barillot, C.: A new multi-directional fiber model for low
angular resolution diffusion imaging. In: Proc. Intl. Soc. Mag. Reson. Med., IEEE (2012)
11. Commowick, O., Stamm, A., Seizeur, R., Perez, P., Barillot, C., Prima, S., Wiest-Daessl´e, N., et al.: Multifiber deterministic streamline tractography of the corti-cospinal tract based on a new diffusion model. In: MICCAI DTI Tractography Challenge, Springer (2011) 18–24
12. Wiest-Daessl´e, N., Commowick, O., Stamm, A., Perez, P., Barillot, C., Seizeur, R., Prima, S., et al.: Comparison of 3 diffusion models to track the hand motor fibers within the corticospinal tract using functional, anatomical and diffusion mri. In: MICCAI Workshop on Computational Diffusion MRI (CDMRI’11), Springer (2011) 150–157
13. Stamm, A., Commowick, O., Barillot, C., P´erez, P.: An adaptive multi-modal particle filter for white matter probabilistic tractography. In: Inf. Process. Med. Imaging, Springer LNCS 7917 (2013) 594–606
14. Stejskal, E., Tanner, J.: Spin diffusion measurements: spin echoes in the presence of a time-dependent field gradient. J. Chem. Phys. 42(1) (1965) 288–292
15. Metzler-Baddeley, C., O’Sullivan, M.J., Bells, S., Pasternak, O., Jones, D.K.: How and how not to correct for CSF-contamination in diffusion MRI. NeuroImage 59(2) (2012) 1394–403
16. Jupp, P., Mardia, K.: A unified view of the theory of directional statistics. Int. Stat. Rev. 57(3) (1989) 261–294
17. Pierpaoli, C., Jezzard, P., Basser, P., Barnett, A., Di Chiro, G.: Diffusion tensor MR imaging of the human brain. Radiology 201(3) (1996) 637–48
18. Veraart, J., Van Hecke, W., Sijbers, J.: Constrained maximum likelihood estimation of the diffusion kurtosis tensor using a Rician noise model. Magn. Reson. Med. 66(3) (2011) 678–86
19. Gudbjartsson, H., Patz, S.: The Rician distribution of noisy MRI data. Magn. Reson. Med. 34(6) (1995) 910–914
20. Powell, M.: The BOBYQA algorithm for bound constrained optimization with-out derivatives. Technical report, Centre for Mathematical Sciences, University of Cambridge, UK (2009)
21. Powell, M.: A direct search optimization method that models the objective and constraint functions by linear interpolation. In: Advances in Optimization and Numerical Analysis. Springer Netherlands (1994) 51–67
22. Zhang, F., Hancock, E.R., Goodlett, C., Gerig, G.: Probabilistic white matter fiber tracking using particle filtering and von Mises-Fisher sampling. Med. Image Anal. 13(1) (2009) 5–18
23. Pontabry, J., Rousseau, F., Oubel, E., Studholme, C., Koob, M., Dietemann, J.L.: Probabilistic Tractography Using Q-Ball Imaging and Particle Filtering: Applica-tion to Adult and in-utero Fetal Brain Studies. Med. Image Anal. (2012)
24. Tuch, D.S.: Q-ball imaging. Magn. Reson. Med. 52(6) (2004) 1358–72
25. Doucet, A., Godsill, S., Andrieu, C.: On sequential Monte Carlo sampling methods for Bayesian filtering. Stat. Comput. 10(3) (2000) 197–208
26. Vermaak, J., Doucet, A., P´erez, P.: Maintaining multimodality through mixture tracking. In: Proc. I. Conf. Comp. Vis. Volume 2., IEEE (2003) 1110–6
27. Banerjee, A., Dhillon, I., Ghosh, J., Sra, S.: Clustering on the unit hypersphere using von Mises-Fisher distributions. J. Mach. Learn. Res. 6 (2006) 1345–1382 28. Wiest-Daessl´e, N., Prima, S., Coup´e, P., Morrissey, S.P., Barillot, C.: Rician noise
removal by non-local means filtering for low signal-to-noise ratio MRI: applications to DT-MRI. In: Med. Image Comput. Comput. Assist. Interv., Springer (2008) 171–9