Publisher’s version / Version de l'éditeur:
2004 Proceedings IAHR Symposium on Ice, IAHR'04, 2, pp. 307-314, 2004-06-21
READ THESE TERMS AND CONDITIONS CAREFULLY BEFORE USING THIS WEBSITE. https://nrc-publications.canada.ca/eng/copyright
Vous avez des questions? Nous pouvons vous aider. Pour communiquer directement avec un auteur, consultez la première page de la revue dans laquelle son article a été publié afin de trouver ses coordonnées. Si vous n’arrivez pas à les repérer, communiquez avec nous à [email protected].
Questions? Contact the NRC Publications Archive team at
[email protected]. If you wish to email the authors directly, please see the first page of the publication for their contact information.
NRC Publications Archive
Archives des publications du CNRC
This publication could be one of several versions: author’s original, accepted manuscript or the publisher’s version. / La version de cette publication peut être l’une des suivantes : la version prépublication de l’auteur, la version acceptée du manuscrit ou la version de l’éditeur.
Access and use of this website and the material on it are subject to the Terms and Conditions set forth at
Ice Pressure Variations during Indentation
Frederking, Robert
https://publications-cnrc.canada.ca/fra/droits
L’accès à ce site Web et l’utilisation de son contenu sont assujettis aux conditions présentées dans le site
LISEZ CES CONDITIONS ATTENTIVEMENT AVANT D’UTILISER CE SITE WEB.
NRC Publications Record / Notice d'Archives des publications de CNRC:
https://nrc-publications.canada.ca/eng/view/object/?id=0e963dbc-d49d-44a1-8b52-618d043ce9de https://publications-cnrc.canada.ca/fra/voir/objet/?id=0e963dbc-d49d-44a1-8b52-618d043ce9de
17th International Symposium on Ice Saint Petersburg, Russia, 21-25 June 2004
International Association of Hydraulic Engineering and Research Proceedings IAHR’04, Vol.2, pp 307-314, 2004.
ICE PRESSURE VARIATIONS DURING INDENTATION
R. Frederking1
ABSTRACT
The Japan Ocean Industry Association made available to the IAHR Ice Crushing Working Group one data file from a field test conducted February 4, 1999. An indenter 1.5 m wide by 0.5 m high, penetrated a sea ice sheet 168 mm thick at a rate of 3 mm/s for a total penetration of 1000 mm. The entire indenter face was covered with “tactile” sensor elements, each nominally 10 mm by 10 mm. Spatial distributions of local pressure were recorded throughout the test as well as the total load measured with a load cell. Detailed analysis of the results showed that the load cell and tactile sensors gave comparable results. The tactile sensors showed a “line-like” load distribution with only about 10 % of the ice edge in load-bearing contact. “Hot-spots” of high local pressure persisted for surprisingly long periods, up to 10 s. Local pressure variations tended to be synchronous, that is largely increasing and decreasing with global load.
INTRODUCTION
The nature of local ice pressure distributions during indentation has been a subject of interest for some time in ice mechanics. It is an important factor in developing an understanding of the ice failure process since this understanding provides one of the means of scaling-up small-scale laboratory and field measurements to scales needed for design of offshore structures and ship hull structures. Obtaining good measurement data on pressure within the contact area was always a problem. If the sensor area was large, the pressure was averaged over too large an area; if the sensor area was small, there were usually insufficient sensors to determine the distribution of pressures. Load cells to measure average pressures over areas as small as 10 mm dia. were employed in laboratory and field measurements (Masterson et al, 1999, Sayed and Frederking, 1992). Local pressures as high as 80 MPa were measured on a 10 mm diameter sensor in indentation of multi-year ice (Frederking et al, 1990). Early work in Finland (Joensuu, 1988) initiated the use of PVDF sensors to almost completely cover the measurement area. Later this type of instrumentation was deployed for field indentation tests on multi-year (Masterson et al 1993) and pressures as high as 50 MPa were measured.
1
More recently the Japan Ocean Industries Association (JOIA) sponsored a project on Medium Scale Field Indentation Tests (MSFIT) of ice sheets which ranged in thickness from 120 mm to 270 mm. During the JOIA project detailed measurements of total load, loads on segments and local pressure distributions were made. The objective of the project was to obtain high quality data that could be used to improve the prediction of ice loads on structures. A general description of the test equipment and testing procedure can be found in Nakazawa et al (1999). To encourage broader understanding of the results, JOIA made available one data file to the IAHR Ice Crushing Working Group for analysis. These are the data examined in this paper. Spatial and temporal distributions of pressure will be examined, both on the basis of average distributions, shape of contours, simultaneity and variations during load cycles. Implications for describing ice crushing processes will be discussed.
DESCRIPTION OF TEST
The MSFIT program was conducted over 5 winters in the late 1990s at Notoro fishing harbour on the North coast of Hokkaido Island, Japan. The data file, from a test conducted February 4, 1999 was for the following conditions:
Indenter width = 1500 mm Indenter height = 500 mm Ice thickness = 168 mm Indenter speed = 3 mm/s Total stroke = 1000 mm Ice strength = 2.46 MPa
The total load exerted by the actuator was measured with a load cell and recorded at a rate of 50 readings a second. The entire indenter face was covered with “tactile” sensor elements, each nominally 10 mm by 10 mm, for a total of 6336 sensor elements (144 elements across and 44 elements vertically). The ice was not thick enough to ensure contact with all the sensor elements, but about 2500 elements contacted the ice edge. Data from the tactile film was recorded at a rate of one “frame” every 0.2667 s (3.7 Hz). A “frame” comprised a 144 by 44 matrix of “pressure” readings. Each element of the tactile film gave an integer reading between 0 and 255. The manufacturer of the film provided the following guide to convert output reading to pressure
reading pressure (MPa) 0 0
55 0.68 255 6.86
with a linear relation. It was also stated that the error in any reading on the tactile film could be up to ± 10%, so it was recommended that pressure data be treated as relative.
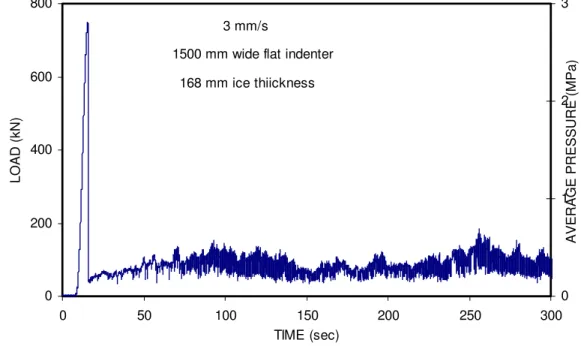
The load record from the load cell is presented in Figure 1. It can be seen that there is rapid build-up of load to a high peak with the flat indenter making perfect contact with the flat sawed edge of the ice sheet. Using the indenter width of 1500 mm and the 168 mm ice thickness, the average pressure to initially fail the ice sheet was almost 3 MPa. Subsequently the average pressure was never greater than 0.5 MPa. The test was run at a constant actuator rate of 3 mm/s for 300 s (50 s is equivalent to 150 mm indentation). Immediately after the initial failure, fluctuations in the load were small. For the interval 40 to 70 seconds (Figure
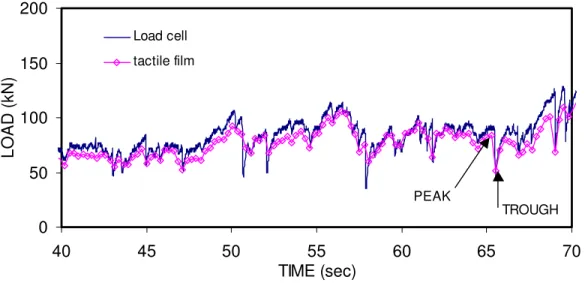
2), the fluctuations were still small with a pattern of a general rise followed by a rapid drop off with an irregular period of 5 to 10 seconds. At around 80 seconds (Figure 3) the fluctuations settled into a more regular pattern with a frequency of about 1.2 Hz and the peak-to-trough ratio of the amplitude about 2. It can be seen that the nature of the load fluctuations changes significantly between the two time intervals (Figures 2 and 3). The pattern demonstrated in Figure 3 tended to persist for the remainder of the test. Also shown in Figure 2 and 3 is a total load determined from the tactile film records. This will be discussed further.
0 200 400 600 800 0 50 100 150 200 250 300 TIME (sec) LOAD (kN) 0 1 2 3
AVERAGE PRESSURE (MPa)
3 mm/s
1500 mm wide flat indenter 168 mm ice thiickness
Figure 1 Load – time record for test on February 2, 1999
The tactile film data were used to determine total load using a rather simple method of assigning a load of 1 N per reading unit; that is, a reading of 10 is equivalent to 10 N. Thus the total load in kN is just the sum of all tactile cell readings divided by 1000. This is the method used to obtain the tactile film loads presented in Figures 2 and 3. The recording frequency of the tactile film determined loads is much less than the load cell, approximately 4 Hz versus 50 Hz, but the tactile film traces follow the trend of the load cell determined loads quite closely. Different recording systems were used so the load drop from the initial failure was used as an initial synchronizing point, but no further synchronization was used throughout. This basis to calculate total load implies a pressure of 2.55 MPa for a reading of 255, rather than the value of 6.8 MPa given by the manufacturer, and again emphasizes that pressures be treated a relative, not absolute.
0 50 100 150 200 40 45 50 55 60 65 70 TIME (sec) LOAD (kN) Load cell tactile film PEAK TROUGH
Figure 2 Load – time record expanded for interval 40 to 70 seconds
0 50 100 150 200 70 75 80 85 90 95 100 TIME (sec) LOAD (kN) Load cell tactile film
Figure 3 Load – time record expanded for interval 70 to 100 seconds
DISTRIBUTIONS OF PRESSURE
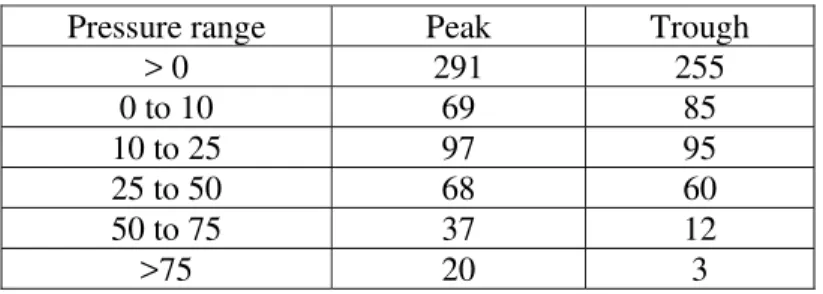
The nature of ice pressure distributions at different points in the loading process will be examined next. At the 65 second mark (see Figure 2) two successive tactile film records were selected, one at 65.26 s just before failure, “peak”, followed by one at 65.53 s, just after failure, “trough”. The nature of, and change between the two will be discussed. The total loads at the two times, as estimated from the tactile film, are 85 kN and 53 kN, respectively, about a 40% decrease. Contour plots of the two times for the entire ice edge in contact with the indenter (168 mm by 1500 mm) are presented in Figure 4. The values plotted are the pressure numbers, within the range 0 to 255, from the tactile film record (note; all subsequent plots and discussion treat pressure as unitless). What can be seen firstly is that the area subjected to ice pressure is greater at the peak than the trough (290 elements at the peak and 255 at the trough), a 10% decrease so this alone does not account for the magnitude of the decrease. Note that the total possible number of cells in contact with the ice edge is 2448, so
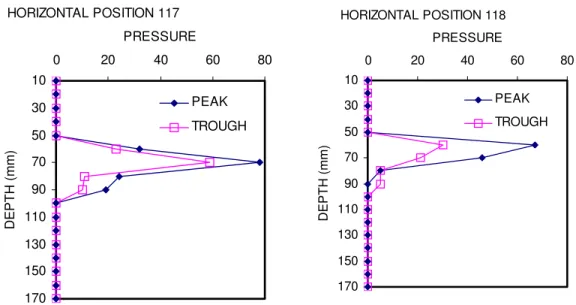
only about 10% are actually loaded. The number of cells subjected to ice pressures greater than 10, 25, 50 and 75 was determined and the greatest difference between the two cases was for pressures greater than 50 (see Table 1). At the peak there were 57 cells above that level, but only 15 at the trough. A number of vertical profiles of pressure were also examined, and they showed that generally the distribution was peakier at peak load than in the trough. Two immediately adjacent vertical pressure profiles at peak and trough are shown in Figure 5 to illustrate this point.
1 6 11 16 21 26 31 36 41 46 51 56 61 66 71 76 81 86 91 96 101 106 111 116 121 126 131 136 141 1 5 9 13 17 HORIZONTAL VERTI CA L PEAK 0-25 25-50 50-75 75-100 100-125 125-150 (a) 1 7 13 19 25 31 37 43 49 55 61 67 73 79 85 91 97 103 109 115 121 127 133 139 1 5 9 13 17 HORIZONTAL VERTI CA L TROUGH (b)
Figure 4 Contour plots of pressure at 65 s; (a) peak, (b) trough. Table 1 Number of tactile elements loaded at 65 s.
Pressure range Peak Trough
> 0 291 255 0 to 10 69 85 10 to 25 97 95 25 to 50 68 60 50 to 75 37 12 >75 20 3
Figure 6 presents the horizontal distribution of pressure summed on a vertical axis for the whole width of the indenter. It can be seen that for the most part the two pressure distributions are of similar magnitude for both the peak and trough. It is only for horizontal positions 100 to 140 that the total peak pressures are greater.
As was shown in Figure 4, the line-like load distribution was generally not continuous across the entire width of the indenter, even at the time of peak load. What was also observed at some times was a double peak in the vertical distribution of pressure. Figure 7 plots six immediately adjacent vertical pressure profiles, covering a width of 60 mm, and all show similar double peaks. This double peak is likely a measurable representation of horizontal cleavage cracks that have been observed in indentation tests. A contour plot of the area from which the vertical profiles of Figure 7 were extracted (Figure 8) more clearly illustrates two line-like loaded areas. Figure 8 also illustrates that the high pressure between horizontal positions 100 and 120 has persisted for 5 seconds. In fact, this high pressure area or “hot spot” persists to a greater or lesser extent for the entire test run.
10 30 50 70 90 110 130 150 170 0 20 40 60 80 PRESSURE DEPTH (mm) PEAK TROUGH HORIZONTAL POSITION 117 10 30 50 70 90 110 130 150 170 0 20 40 60 80 PRESSURE DEPTH (mm) PEAK TROUGH HORIZONTAL POSITION 118
Figure 5 Vertical pressure distributions at 65 s.
0 50 100 150 200 250 0 24 48 72 96 120 144 HORIZONTAL POSITION TOTAL PRESSURE PEAK TROUGH
Figure 6 Total pressure along a vertical line of elements at 65 s.
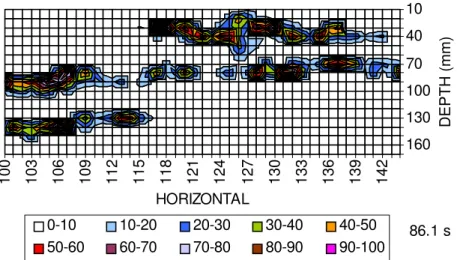
To illustrate further pressure distributions and persistence of “hot spots” a contour plot at time 86.1 s is presented in Figure 9. Here there are three horizontal line-like loads and the high pressure areas are still evident in the horizontal position area 100 to 140.
10 30 50 70 90 110 130 150 170 0 20 40 60 80 100 120 PRESSURE DEPTH (mm) 70.1 s
Figure 7 Vertical pressure distributions at 70.1 s
101 104 107 110 113 116 119 10 60 110 160 HORIZONTAL POSITION DEPTH (mm) 80-100 60-80 40-60 20-40 0-20
Figure 8 Contour plot of pressure distribution at 70.1 s.
100 103 106 109 112 115 118 121 124 127 130 133 136 139 142 10 40 70 100 130 160 HORIZONTAL DEPTH (mm) 0-10 10-20 20-30 30-40 40-50 50-60 60-70 70-80 80-90 90-100 86.1 s
SUMMARY
An indentation test at 3 mm/s on 168 mm thick sea ice provided detailed information on pressure distributions through use of “tactile” file sensor elements covering the entire face of the 1500 mm wide indenter. Summing the tactile sensor data gave total loads similar to those from a load cell that measured total load. The tactile sensors showed a “line-like” load distribution with only about 10 % of the ice edge experiencing any local pressure at all. Local pressure distribution before and after failure indicated that the contact area was essentially the same in both cases, but that there was a larger area of high pressure just before failure. The line-like load distribution was observed to divide into two or more horizontal parallel lines, suggesting cleave crack formation. “Hot-spots” of high local pressure persisted for surprisingly long periods, say up to 10 s, and tended to be in the middle portion of the ice edge.
ACKNOWELDGEMENTS
The author would like to acknowledge the financial support for this work from the Program of Energy Research and Development (PERD) through the ice-structure interaction activity, and the Japan Ocean Industry Association for making these data available.
REFERENCES
Frederking, R., Jordaan, I.J. and McCallum, J.S. 1990. Field Tests of Ice Indentation at Medium Scale, Hobson's Choice Ice Island, 1989. Proc. IAHR 10th International Symposium on Ice. August 20-23, 1990. Espoo, Finland, Vol. 2. pp. 931-944.
Joensuu, A. 1988. Ice Pressure Measurements using PCDF Film. Proceedings 7th International Conference on Offshore Mechanics and Arctic Engineering (OMAE 1988) Houston, February 7-12, 1988, Vol. IV, p. 153-158.
Masterson, D.M., Spencer, P.A., Nevel, D.E. and Nordgren, R.P. 1999. Velocity Effects From Multi-Year Ice Tests. 18th International Conference on Offshore Mechanics and Arctic Engineering, OMAE99, St. John's Newfoundland.
Masterson, D.M., Frederking, R.M.W., Jordaan, Ian J., and Spencer, Paul A. 1993. Description of Multi-Year Ice Indentation Tests at Hobson's Choice Ice Island - 1990. Proceeding of the 12th International Conference on Offshore Mechanics and Arctic Engineering, (OMAE 1993), June 20-24, 1993, Vol. IV, pp 145-155, Glasgow, Scotland.
Nakazawa, N., Akagawa, S., Kawamura, M., Sakai, M., Matsushita, H., Terashima, T., Takeuchi, T., Saeki, H. and Hirayama, H. 1999. Medium Scale Field Ice Indentation Test (MSFIT) – Results of 1998 Winter Tests. Proceedings 9th (1999) International Offshore and Polar Engineering Conference, May 30 – June 4, 1999, Vol. II, pp 498-504 Brest, France.
Sayed, M. and Frederking R. 1992. Two-dimensional Extrusion of crushed ice. Part 1: Experimental. Cold Regions Science and Technology, Vol. 21, pp 25-36.