Publisher’s version / Version de l'éditeur:
Journal of the American Chemical Society, 132, 48, pp. 17265-17270, 2010-11-11
READ THESE TERMS AND CONDITIONS CAREFULLY BEFORE USING THIS WEBSITE. https://nrc-publications.canada.ca/eng/copyright
Vous avez des questions? Nous pouvons vous aider. Pour communiquer directement avec un auteur, consultez la première page de la revue dans laquelle son article a été publié afin de trouver ses coordonnées. Si vous n’arrivez pas à les repérer, communiquez avec nous à PublicationsArchive-ArchivesPublications@nrc-cnrc.gc.ca.
Questions? Contact the NRC Publications Archive team at
PublicationsArchive-ArchivesPublications@nrc-cnrc.gc.ca. If you wish to email the authors directly, please see the first page of the publication for their contact information.
NRC Publications Archive
Archives des publications du CNRC
This publication could be one of several versions: author’s original, accepted manuscript or the publisher’s version. / La version de cette publication peut être l’une des suivantes : la version prépublication de l’auteur, la version acceptée du manuscrit ou la version de l’éditeur.
For the publisher’s version, please access the DOI link below./ Pour consulter la version de l’éditeur, utilisez le lien DOI ci-dessous.
https://doi.org/10.1021/ja107252f
Access and use of this website and the material on it are subject to the Terms and Conditions set forth at
Supramolecular Chromotropism of the Crystalline Phases of
4,5,6,7-Tetrafluorobenzo-2,1,3-telluradiazole
Cozzolino, Anthony F.; Whitfield, Pamela S.; Vargas-Baca, Ignacio
https://publications-cnrc.canada.ca/fra/droits
L’accès à ce site Web et l’utilisation de son contenu sont assujettis aux conditions présentées dans le site LISEZ CES CONDITIONS ATTENTIVEMENT AVANT D’UTILISER CE SITE WEB.
NRC Publications Record / Notice d'Archives des publications de CNRC:
https://nrc-publications.canada.ca/eng/view/object/?id=735247ca-a186-4dd6-9405-44438e4104c3 https://publications-cnrc.canada.ca/fra/voir/objet/?id=735247ca-a186-4dd6-9405-44438e4104c3Supramolecular Chromotropism of the Crystalline Phases of
4,5,6,7-Tetrafluorobenzo-2,1,3-telluradiazole
Anthony F. Cozzolino,†Pamela S. Whitfield,‡and Ignacio Vargas-Baca*,†
Department of Chemistry and Chemical Biology, McMaster UniVersity, 1280 Main Street West, Hamilton, ON, Canada, and Institute for Chemical Process and EnVironmental Technology,
National Research Council Canada, 1200 Montreal Road, Ottawa, ON, Canada
Received August 12, 2010; E-mail: vargas@chemistry.mcmaster.ca
Abstract: The remarkable effect that secondary bonding interactions can have on the macroscopic properties of a material is illustrated by two polymorphs of the title compound. The phase which is most stable under ambient pressure and temperature consists of puckered supramolecular ribbon polymers assembled by Te--N secondary bonding interactions and displays a characteristic red-orange color. A second yellow phase consists of ribbons with alternating short and long intermolecular Te--N secondary bonding distances and is metastable; at 127 °C the material undergoes an exothermic irreversible transition to the red polymorph. A third phase consists of pyridine-solvated supramolecular dimers; it is also yellow and transforms into the red phase after the crystals effloresce. Computational DFT studies indicate that the observed changes in optical properties are related to intermolecular mixing of π orbitals enabled by the supramolecular interactions and the symmetry of the supramolecular synthon.
Introduction
Molecules that contain the 1,2,5-telluradiazole heterocycle are known to strongly associate to one another in the solid state, building either dimers or ribbon polymers through the formation of the [Te-N]2 supramolecular synthon, a virtual
four-membered ring which features two antiparallel Te--N secondary bonding interactions (SBIs).1-5 The extent of association of these molecules can be modified by steric hindrance, while the unsubstituted heterocycles 1,2,5-telluradiazole (1) and benzo-2,1,3-telluradiazole (2) both form ribbon polymers;2,5 4,6-di-tert-butyl- (3) and 4,6-dibromo-benzo-2,1,3-telluradiazole (4) only form dimers.2,3 Remarkably,
phenanthro[9,10-C]-1,2,5-telluradiazole (5) is able to form a ribbon polymer after undergoing a structural distortion.4Destabilizing steric
interac-tions are always present in the ribbon polymers; even in the case of 2, there is a small degree of repulsion (ca. 10 kJ/mol)1
between neighboring hydrogen atoms in the ribbon. Here we report how more intense repulsion in the case of 4,5,6,7-tetrafluorobenzo-2,1,3-telluradiazole (6) induces the existence of two packing polymorphs which are related by a thermochro-mic (yellow to red) monotopic phase change (Chart 1). The properties of a pseudopolymorph (a pyridine solvate) and
TD-DFT studies link the observed color changes to the degree of supramolecular association in the lattice.
Results and Discussion
An earlier report6 claimed the synthesis of 6 by reflux of
TeCl4with perfluoro-phenylenediamine in o-dichlorobenzene
with a 20% yield. An adaptation of the procedure published for the synthesis of 2 and 42 increased the yield of the red
powder to 84%.
Multiple attempts to obtain the X-ray diffraction structure of the orange-red crystals of 6 grown from organic solutions were complicated by heavy twinning of the samples. Instead, slow sublimation under static vacuum at 140 °C produced specimens of sufficient quality for a structural determination, albeit with limited precision. Pertinent crystallographic data are provided in Table 1, and selected average distances and angles are given in Table 2. The asymmetric unit of this phase, R-6, consists of four molecules; the internal parameters of which are equal within †McMaster University.
‡National Research Council Canada.
(1) Cozzolino, A. F.; Vargas-Baca, I.; Mansour, S.; Mahmoudkhani, A. H.
J. Am. Chem. Soc. 2005, 40, 4966–4971.
(2) Cozzolino, A. F.; Britten, J. F.; Vargas-Baca, I. Cryst. Growth Des. 2006, 6, 181–186.
(3) Chivers, T.; Gao, X. L.; Parvez, M. Inorg. Chem. 1996, 35, 9–15. (4) Neidlein, R.; Knecht, D.; Gieren, A.; Ruiz-Perez, C. Z. Naturforsch.
B 1987, 42, 84.
(5) Bertini, V.; Dapporto, P.; Lucchesini, F.; Sega, A.; Munno, A. D. Acta
Crystallogr., Sect. C 1984, 40, 653. (6) Kovtonyuk, V. N.; Makarov, A. Y.; Shakirov, M. M.; Zibarev, A. V.Chem. Commun. 1996, 1991–1992.
the standard deviation. Each molecule has pseudo-C2Vsymmetry
with the largest deviation observed for the Te-N distances. In this crystal structure, the molecules of 6 are associated through [Te-N]2 supramolecular synthons forming ribbon polymers
(Figure 1). These are, however, significantly distorted, presum-ably by the steric interaction between F atoms within the chain that sit at 2.57(2), 2.60(2), or 2.61(2) Å from each other; cf.
rvdW(F) ) 1.47 Å. Each Te center participates in two Te--N SBIs, one longer (av 2.94(2) Å) than the other (av 2.68(2) Å); cf. ΣrvdW(Te-N) ) 3.61 Å. The intramolecular Te-N distances
are also unequal; the short Te--N SBI is located opposite to the longer Te-N single bond and vice versa. In addition to the Te--N SBI distances, the distortion of the ribbon chain also impacts the bond angles within the [Te-N]2supramolecular
synthon (64.9(6)° and 71.3(6)°) as well as the interplanar angle between molecules in the ribbon chains (12.0(4)° and 10.8(5)°). These geometric features show that the [Te-N]2supramolecular
synthon has lost its inversion center. The puckered ribbon chains stack along both the [100] and [010] axes forming two 2D arrays that are related by a 74.6° rotation about the [001] axis. The stacking of the ribbon chains is offset in order to alleviate the steric repulsion between the tellurium atoms in adjacent layers. The arrangement of molecules in the crystal structure of R-6 resembles that observed in 2; when a monoclinic supercell (a
) 11.30 Å, b ) 11.29 Å, c ) 22.82 Å, 96.87°) is considered, in other words R-6 is nearly isostructural with 2.
During crystal growth experiments, it became apparent that fast sublimation of 6 onto a coldfinger under dynamic vacuum results in the deposition of a bright yellow microcrystalline solid. Moreover, the yellow solid underwent a color change to red-orange upon heating. Powder X-ray diffraction studies identified the red solid as R-6 and showed that the yellow material is a different crystalline polymorph,β-6. Indexing, structure solution, and refinement using low temperature powder diffraction data permitted the building of a model of this phase while restraining the ring to be nearly flat. In the best model, the asymmetric unit consists of one molecule of 6. The molecules are organized in ribbon chains with centrosymmetric [Te-N]2supramolecular
synthons (Te-N distances of 2.75(1) and 2.884(6) Å and N-Te-N angles of 71.3(3)° and 67.1(2)°) (Figure 2a). In this arrangement, the ribbon chains are not coplanar, with neighbor-ing molecules havneighbor-ing a separation of 0.5 Å. the closest distances between F atoms are 2.58(1), 2.633(9), and 2.66(1) Å. This arrangement also differs from R-6 in that the ribbons are all parallel and stack along the [100] axis with a lateral displace-ment that offsets the tellurium atoms from one layer to the next.
Table 1. Crystallographic Data for R-6, β-6, and 6 · Py
Compound R-6 β-6 6 · Py
Empirical formula C6F4N2Te C6F4N2Te C9H5F4N3Te Crystal system Triclinic Triclinic Monoclinic Space group P1j (No. 2) P1j (No. 2) P21/c (No. 14)
a[Å] 7.972(2) 3.96683(9) 5.423(2) b[Å] 7.973(2) 11.5430(6) 10.807(4) c[Å] 22.773(6) 7.9902(4) 20.081(7) R [deg] 85.259(5) 90.209(8) 90 β [deg] 85.096(5) 89.875(6) 92.644(8) γ [deg] 89.960(5) 90.001(2) 90 V[Å3] 1437.3(7) 365.86(3) 1175.6(7) Z, F(calcd) [g · cm-3] 8, 2.807 2, 2.757 4, 2.163 T[K] 173(2) 84 173(2) µΜο[mm-1] 4.16 2.57 θ range 1.8-24.71 2.14-27.65 Limiting indices -9 e h e 4 -6 e h e 7 -9 e k e 9 -14 e k e 13 -26 e l e 26 -17 e l e 26
Refl. collec./ unique 14 339/4886 14 325/2715
R(int.) 0.1443 0.1033
No. of parameters 470 172
No. of restraints 428 0
R1a/wR2a(I > 2σ(I)) 0.0732/0.1388 0.0433/0.0791
R1a/wR2afor all data 0.1512/0.1699 0.0844/0.0912
Goodness-of-fit on F2 0.985 0.993
Larg. diff. peak/hole [e · Å-3]
1.733/-1.534 0.861/ -0.741
a
R1 ) Σ |Fo| - |Fc|/Σ|Fo|, wR2 ) {Σ[w(Fo2- Fc2)2]/Σw(Fo2)2}1/2.
Table 2. Selected Bond Lengths and Angles for R-6, β-6, and 6 · Py R-6a β-6 6 · Py Te1sN1 (Å) 2.04(2) 2.004(5) 2.004(5) Te1sN2 (Å) 2.01(2) 2.15(1) 2.020(4) N1sTe1sN2 (deg) 85.1(7) 88.5(3) 85.2(2) N1dC1 (Å) 1.33(3) 1.360(4) 1.307(7) Te1sN1dC1 (deg) 108.1(1) 103.7(3) 109.2(4) N2dC6 (Å) 1.32(3) 1.36(1) 1.315(7) Te1sN2dC6 (deg) 109.5(1) 101.7(8) 108.8(4)
aAverage values of equivalent bonds and angles in the four
molecules in the asymmetric unit.
Figure 1. Ball and stick representation of two views of the packing in the crystal structure of R-6: (a) along [010], (b) along [100]. Layers with different orientation are distinguished by the shade of gray. SBIs are omitted for clarity.
Figure 2. Ball and stick representation of two views of the packing in the crystal structure ofβ-6: (a) along [100], (b) along [010].
17266 J. AM. CHEM. SOC.9VOL. 132, NO. 48, 2010
The stacks are organized with respect to each other by the
x,y,1+z symmetry transformation (Figure 2b). The relative positions of molecules in the model of β-6 resembles that observed in the crystal structure of 5, in which the long axes of the ribbon chains are all parallel despite the structural distortion of the phenanthrene ring system.4
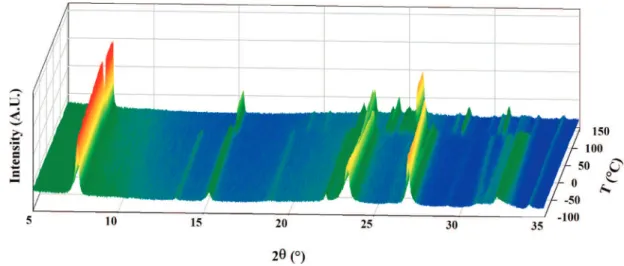
Differential scanning calorimetry revealed that theβfR phase transition of 6 is an exothermic (∆H ) -2.3 kJ/mol) process with onset temperature at 116 °C; loss of mass due to sublimation and/or decomposition was only observed above 220 °C. Thus theβ-6 phase is metastable, and the observed change would occur at the melting point of β-6 with immediate formation of the more stable crystals of R-6 from the melt. Monitoring the transition with powder X-ray diffraction (Figure 3) confirmed that this is a dimorphic system and the phase change is monotropic.7This implies that at all temperatures R-6
has a lower free energy and β-6 is only kinetically stable. Consistent with this interpretation, the phase change is irrevers-ible and occurs very slowly (in the span of weeks) at room temperature and attempts to prepare samples large enough for single crystal X-ray diffraction by slow deposition led to the appearance of the R phase.
When crystals of 6 were grown from pyridine solutions at temperatures below -24 °C, the resulting solid had a charac-teristic yellow color. The crystallographic structure determina-tion established that this is a distinct phase with an asymmetric unit consisting of one molecule of the solvent and one molecule of 6, the lattice features discrete SBI dimers of 6 in which the [Te-N]2supramolecular synthon is centrosymmetric (Te--N SBI
distance 2.767(5) Å) and each tellurium atom is bonded to an additional molecule of pyridine (Figure 4). This arrangement is analogous to that observed in the structure of 4 · DMSO. In this case the Te--NPydistance (2.787(5) Å) is only 0.020 Å
longer than the SBIs within the [Te-N]2ring; shorter Te--NPy
SBI distances have been observed in the crystal structures of diphenylsulfiminato-trichloro-tellurium(IV) (2.426 Å)8and
1,5,10- tritellura-hexacyclo(8.3.1.11,5.11,10.05,10.05,14)hexadeca-2,3,7,8,11,12-hexaene (2.2677, 2.852 Å).9Other selected bond
distances and angles for 6 · Py are summarized in Table 2. The intramolecular distances of 6 in 6 · Py are equal to those in R-6 within the standard deviations. Slow loss of pyridine from the crystal with the concomitant formation of R-6 was observed above -20 °C.
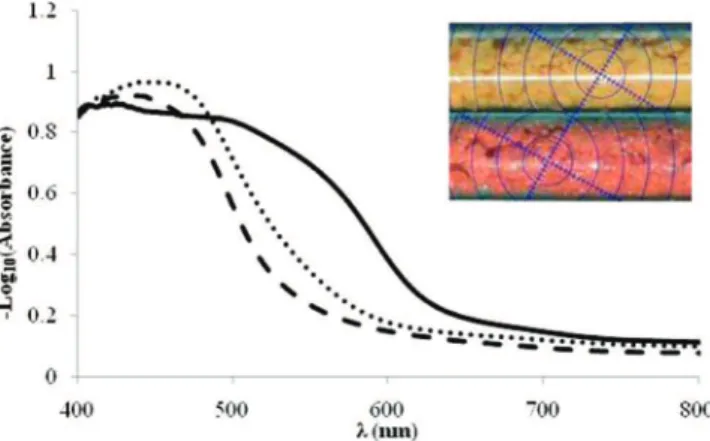
Because the most striking difference between the crystalline phases of 6 is their color, their electronic excitation spectra were investigated with diffuse reflectance measurements (Figure 5). While β-6 and 6 · Py have very similar spectra with a major absorption band centered at approximately 440 and 450 nm respectivly, the R phase is characterized by a broader absorption band at longer wavelengths (extending beyond 600 nm). This observation implies that intermolecular association does influ-ence the electronic structure and optical properties of these solids. It has previously been suggested that the difference of colors displayed by organotellurium iodides in solution and in the solid state could be due to reversible Te--I SBIs with a significant covalent component,10but no quantitative studies
have been carried out in support of this interpretation. Previous DFT calculations have provided a description of the electronic structure of 2 which is consistent with the results of photoelectron spectroscopic studies.11 In that scheme, the (7) Caira, M. Crystalline Polymorphism of Organic Compounds. In Design
of Organic Solids, Weber, E., Ed.; Topics in Current Chemistry; Springer: 1998; Vol. 198, pp 163-208.
(8) Munzenberg, J.; Roesky, H. W.; Noltemeyer, M.; Besser, S.; Herbst-Irmer, R. Z. Naturforsch. B 1993, 48, 199.
(9) Munzenberg, J.; Roesky, H. W.; Besser, S.; Herbst-Irmer, R.; Sheldrick, G. M. Inorg. Chem. 1992, 31, 2986.
(10) McCullough, J. D.; Knobler, C.; Ziolo, R. F. Inorg. Chem. 1985, 24, 1814–1818.
(11) Cozzolino, A. F.; Gruhn, N. E.; Lichtenberger, D. L.; Vargas-Baca, I.
Inorg. Chem. 2008, 47, 6220–6226.
Figure 3. Evolution of the X-ray diffraction pattern ofβ-6 as temperature is varied from 173 to 443 K.
Figure 4. ORTEP representations and numbering schemes of the asym-metric unit plus inversion center of 6 · Py. Displacement ellipsoids are shown at the 50% probability level.
HOMO (a2under C2V) is aπ orbital with the largest contributions
from the C6ring, the HOMO-1 (b1) mostly corresponds to the
lone pair of tellurium withπ orientation, the LUMO (b1) has a
π*Te-Ncharacter, and the LUMO+1 (b2) consists of a
combina-tion of σ*Te-N orbitals. With the exception of b2 r b1, the
electron excitations between these orbitals are symmetry al-lowed. Comparable calculations (PW91, TZP) for 6 yielded equivalent frontier orbitals but a HOMO-LUMO gap that is smaller than that of 2 by 0.276 eV. A TD-DFT calculation (SAOP, QZ4P) gave the first excitation band on the individual molecule (b1ra2) at 456 nm with an oscillator strength f )
0.014 and the second (b1 r b1) at 367 nm and f ) 0.207.
Intermolecular association through the SBIs does cause a perturbation of the electronic structure. Figure 6 displays the evolution of the frontier orbitals of a centrosymmetric dimer of 6as a function of the Te--N distance from 2.2 to 3.2 Å. Within the range studied, there is a change of 0.6 eV in the HOMO-LUMO gap that results from mixing of orbitals in the π manifold. In contrast, appending two molecules of pyridine (as observed in the solvated structure) had a negligible effect on the frontier orbital energies of the model dimer because all the relevant orbital interactions are confined to theσ framework. Although the calculations show that the HOMO-LUMO gap decreases with the Te--N SBI length, this fact alone is not sufficient to explain the difference of color of the two
poly-morphs of 6. In each ribbon structure there are two distinct Te-N SBI distances; while in one case (β) the distances alternate from one [Te-N]2supramolecular synthon to the next,
in the other (R) both the short and the long distances are observed in the same supramolecular synthon. Interestingly the long Te-N SBI distances in each phase are equal within 3σ and the same is observed for the short distances. However, as it can be inferred from Figure 6, the HOMO-LUMO transition (bgrbg) in a centrosymmetric dimer is symmetry forbidden.
In the R phase, breaking the symmetry of the [Te-N]2ring by
a noncentrosymmetric distortion would result in more excitations being allowed, including the HOMO-LUMO transition. In addition, electron delocalization along the supramolecular ribbons also influences the HOMO-LUMO gap; optimized tetramer models of the ribbons showed decreases of 0.65 eV for the R phase and only 0.51 eV for theβ phase, with respect to the monomer. Because of such an extended conjugation, the TD-DFT method could not be applied to model the electronic spectra of these materials more accurately.
DFT calculations were also used to compare the stability of the crystalline phases of 6. The calculated total association energy of the supramolecule 62· Py2is -169.8 kJ/mol; of this
-82.2 kJ/mol corresponds to the [Te-N]2 supramolecular
synthon and -43.8 kJ/mol to each of the Te--NpySBIs. For the
ribbon structures, the estimated association energies are -36.8 kJ/mol forβ-6 and -63.8 kJ/mol for R-6, which is consistent with the small enthalpy change that is experimentally observed. Conclusions
The three crystalline phases formed by 6 were structurally characterized; all were shown to contain the [Te-N]2
supramo-lecular synthon. In one case pyridine caps the tellurium atoms preventing the association of molecules beyond a dimer; in this phase the [Te-N]2supramolecular synthon is symmetric. In the
other, nonsolvated structures, the steric interaction between neighboring fluorine atoms distorts the [Te-N]2supramolecular
synthon and the ribbon chain. Two distinct polymorphs arise from in-plane and out-of-plane distortions which leave cen-trosymmetric and noncencen-trosymmetric supramolecular synthons, respectively. The two phases are related by a monotropic change that is accompanied by a color change from yellow to red. Although previous computational studies had concluded that the contribution ofπ orbitals to the stabilization of the [Te-N]2
supramolecular synthon is negligible, the present case demon-strates that their interactions can have an important effect in the overall electronic structure and optical properties of a material. Although the irreversibility of the phase transition between its two polymorphs discounts the application of 6 as a thermochromic material, the results of these investigations do suggest that materials featuring switchable SBIs could find application in optical-chemical sensors and electronic devices. Experimental Section
Computational Method. DFT calculations in this study were performed using the ADF DFT package (SCM, versions 2008.01 and 2009.01).12-14The Adiabatic Local Density Approximation
(ALDA) was used for the exchange-correlation kernel,15,16and the
differentiated static LDA expression was used with the
Vosko-(12) Te Velde, G.; Bickelhaupt, F. M.; Baerends, E. J.; Fonseca Guerra, C.; Van Gisbergen, S. J. A.; Snijders, J. G.; Ziegler, T. J. Comp. Chem. 2001, 22, 931–967.
(13) Guerra, C. F.; Snijders, J. G.; Te Velde, G.; Baerends, E. J. Theor.
Chem. Acc. 1998, 99, 391.
Figure 5. Ultraviolet/visible absorption spectra of R-6 (s),β-6 (- - -), and 62· Py2 ( · · · · ) in the solid state obtained from diffuse reflectance measurements. Inset: photograph ofβ-6 before (yellow) and after (red) the phase change to R-6 induced by heating.
Figure 6. Correlation of frontier orbitals for a centrosymmetric dimer (C2h) of 6.
17268 J. AM. CHEM. SOC.9VOL. 132, NO. 48, 2010
Wilk-Nusair parametrization.17The calculations of model
geom-etries were gradient-corrected with the exchange and correlation functionals of the gradient correction proposed by Perdew and Wang18,19which usually reproduce the geometries of heavy
main-group systems well.20 Geometry optimizations were conducted
using a triple-ζ all-electron basis set with one polarization function and applying the zeroth order regular approximation (ZORA)21-25
with specially adapted basis sets. Geometry constraints were used when point group symmetry was applicable. Geometries of model oligomers from the crystal structures were optimized while freezing the Te and N coordinates. Electronic excitations26,27were calculated
using time-dependent density functional theory (TD-DFT) as implemented within the ADF package;26the Statistical Average
of different model Potentials for occupied KS Orbitals (SAOP)28-30
was used for the exchange-correlation potentials in the zeroth-order KS equations. Visualization of the computational results was performed using the ADF-GUI.31
Materials. The manipulation of air-sensitive materials was performed under an atmosphere of dry nitrogen with standard Schlenk and glovebox techniques. All solvents and reagents were dried and purified by standard procedures immediately before each experiment. 1,2-Diamino-3,4,5,6-tetrafluorobenzene was purchased from Butt Park Ltd. and used as received, and TeCl4was prepared
by direct combination of the elements.
General Instrumentation.IR spectra were recorded using a Bio-Rad FTS-40 FT-IR spectrometer. Each spectrum was acquired from a KBr pellet with a resolution of 4 cm-1, and the background, which
was simultaneously subtracted, was recorded prior to a spectral acquisition. Raman spectra were acquired on a Renishaw inVia Raman microscope with the WiRE 3 software package at ambient temperature. The sample was excited with a 785-nm laser source (Renishaw HPNIR785) using 30 mW of power using a 1200 lines/ nm grating. The19F NMR spectra in solution were recorded on a
Bruker AV200 (200.13 MHz) spectrometer. Chemical shifts are reported in ppm and were referenced externally to CFCl3. The d6
-DMSO solvent for NMR spectroscopic measurements was dried over freshly washed and activated 4-Å molecular sieves. The diffuse-reflectance spectra were measured with an illuminated (tungsten halogen light source) integrating sphere (Ocean Optics ISP-REF) attached to a photodiode array spectrophotometer (Ocean Optics SD 2000) and are reported relative to a PTFE standard (Ocean Optics WS-1). Each measurement was an average of 100
scans that were integrated over 3 ms using a boxcar smoothing of 10 points and was corrected for stray light and dark current. High resolution electron-ionization mass spectrometry was performed on a Micromass GCT (GC-EI/CI Time of Flight) Mass Spectrometer.
Synthesis of 4,5,6,7-Tetrafluorobenzo-2,1,3-telluradiazole (6).Tellurium tetrachloride (0.15 g, 0.55 mmol) was dissolved in 5 mL of pyridine. This was added dropwise and with stirring to a solution of 1,2-diamino-3,4,5,6-tetrafluorobenzene (0.10 g, 0.55 mmol) in 5 mL of the same solvent. The mixture was stirred for 5 min, and excess Et3N (7 mmol, 1.0 mL) was added. Stirring was
continued for 10 min. Toluene was added to the mixture to precipitate the product. The precipitate was washed three times with 5 mL of toluene. The red-brown solid was recrystallized from pyridine and washed with 5 mL of toluene. The telluradiazole was separated from the Et3N · HCl by suspending the mixture in CH2Cl2
and skimming off the hydrochloride; the bottom residue was then filtered, dried, and further purified by sublimation under vacuum yielding a bright yellow solid; yield after sublimation: 0.14 g (0.47 mol, 84%), mp > 200 °C (turns from yellow to red). 19F NMR
(188.3 MHz, d6-DMSO):δ -148.96, -149.00, -149.04, (dod, 2F,
aryl); -161.65-161.69, -161.74, (dod, 2F, aryl). Raman (cm-1):
1342s, 1331s, 683vs, 631w, 456w, 446w, 333m, 312m, 250w, 221vs, 162w, 106w. IR (cm-1): 1677m, 1634m, 1600m, 1519vs,
1460m, 1384m, 1373m, 1339w, 1226w, 1037m, 1016m, 970w, 944s. HRMS (EI): m/z (M+) calcd 305.9060, exptl 305.9061.
Powder X-ray Diffraction ofβ-6. Freshly sublimed (60 mTorr dynamic vacuum, from 100 °C onto a coldfinger) yellow microcrystalline powder was packed and sealed under nitrogen into a soda glass capillary tube (0.8 mm bore diameter). The powder diffraction pattern was obtained at 84 K (-189 °C) using a Variable Count Time methodology,32and variable temperature
data were collected from -100 to 170 °C on a Bruker-AXS D8 Advanceθ-θ diffractometer using a primary focusing mirror with a 1.2 mm exit slit and a Vantec PSD detector. The detector was equipped with radial Soller slits and was used with a 10° detector window. The capillary temperature was controlled using a custom-designed liquid nitrogen cryoflow system (Cryo Industries of America Inc., NH) with the gas flow running parallel to the long axis of the capillary. Icing of the goniometer head was prevented by use of a goniometer heat shield (Crystal Positioning Systems, NY). Cu KR radiation was used, but no Ni filter was necessary since the primary mirror removes the Kβ component. The background from the capillary was ac-counted for by acquiring the pattern of an empty capillary under the same conditions. The indexing of the data was carried out using the LSI algorithm33 in TOPAS.34 A DFT minimized
molecule of 6 was used as a rigid body to aid in solving the structure in TOPAS34using simulated annealing. During
refine-ment the restraints were relaxed while maintaining the planarity of the rings. The bond distances and angles were determined with standard deviations from the atom positions using PLA-TON.35
Single Crystal X-ray Diffraction of r-6 and 6 · Py. Red-orange
crystals of R-6 were grown under static vacuum (30 mTorr) in a sealed glass tube at 140 °C. Yellow crystals of 6 · Py were grown from a pyridine solution at -34 °C. Both samples were handled under Paratone-N oil at room temperature. Single crystals of R-6 (0.08 × 0.05 × 0.01 mm3) and 6 · Py (0.03 ×
0.03 × 0.68 mm3) were mounted on MiTeGen Micromounts
(Ithica, NY) using Paratone-N oil. Data were collected on a SMART APEX II diffractometer utilizing Mo Kβ radiation (λ ) 0.710 73 Å, graphite monochromator) and equipped with an Oxford cryostream 700 low temperature accessory. Redundant
(14) Baerends, E. J.; et al. ADF, 2009.01; SCM, Theoretical Chemistry, Vrije Universiteit: Amsterdam, The Netherlands, http://www.scm. com.
(15) van Gisbergen, S. J. A.; Snijders, J. G.; Baerends, E. J. Phys. ReV.
Lett. 1997, 78, 3097–3100.
(16) van Gisbergen, S. J. A.; Snijders, J. G.; Baerends, E. J. J. Chem. Phys. 1998, 109, 10644–10656.
(17) Vosko, S. H.; Wilk, L.; Nusair, M. Can. J. Phys. 1980, 58, 1200–11.
(18) Perdew, J. P. Phys. ReV. B. 1986, 33, 8822.
(19) Perdew, J. P.; Wang, Y. Phys. ReV. B. 1992, 45, 13244.
(20) Leigh, W. J.; Harrington, C. R.; Vargas-Baca, I. J. Am. Chem. Soc. 2004, 126, 16105–16116.
(21) van Lenthe, E.; Ehlers, A.; Baerends, E.-J. J. Chem. Phys. 1999, 110, 8943–8953.
(22) van Lenthe, E.; Baerends, E. J.; Snijders, J. G. J. Chem. Phys. 1993,
99, 4597–610.
(23) van Lenthe, E.; Baerends, E. J.; Snijders, J. G. J. Chem. Phys. 1994,
101, 9783–92.
(24) van Lenthe, E.; Snijders, J. G.; Baerends, E. J. J. Chem. Phys. 1996,
105, 6505–6516.
(25) van Lenthe, E.; van Leeuwen, R.; Baerends, E. J.; Snijders, J. G. Int.
J. Quantum Chem. 1996, 57, 281–93.
(26) van Gisbergen, S. J. A.; Snijders, J. G.; Baerends, E. J. Comput. Phys.
Commun. 1999, 118, 119.
(27) Rosa, A.; Baerends, E. J.; van Gisbergen, S. J. A.; van Lenthe, E.; Groeneveld, J. A.; Snijders, J. G. J. Am. Chem. Soc. 1999, 121, 10356– 10365.
(28) Gritsenko, O. V.; Schipper, P. R. T.; Baerends, E. J. Chem. Phys.
Lett. 1999, 302, 199–207.
(29) Gritsenko, O. V.; Schipper, P. R. T.; Baerends, E. J. Int. J. Quantum
Chem. 2000, 76, 407–419.
(30) Schipper, P. R. T.; Gritsenko, O. V.; van Gisbergen, S. J. A.; Baerends, E. J. J. Chem. Phys. 2000, 112, 1344–1352.
(31) ADF-GUI, 2009.01; SCM, Amsterdam, The Netherlands, http:// www.scm.com.
(32) Madsen, I. C.; Hill, R. J. J. Appl. Crystallogr. 1994, 27, 385–392.
data sets were collected, in 0.36° steps inφ or ω, with a crystal-to-detector distance of 4.982 cm for R-6 and 4.947 cm for 6 · Py. Preliminary orientation matrices were obtained from the first frames using the Bruker APEX2 software suite.36The final cell
parameters were obtained by refinement on the positions of selected reflections with I > 10σ(I) after integration of all the frames using the Bruker APEX2 software suite.36The data were
empirically corrected for absorption and other effects using the Bruker APEX2 software suite.36The structures were solved by
direct methods and refined by full-matrix least squares on all
F2data using SHELXL37as part of the WinGX package.38The
structure of R-6 was twinned, treatment of the minor component (18.5%) with the appropriate twin law (0.00 -1.00 0.00 -1.00
0.00 0.00 0.00 0.00 -1.00), and the application of restraints to the displacement parameters improved the behavior of the structure. The non-H atoms were refined anisotropically, while H atoms were constrained to idealized positions using appropriate riding models. Molecular graphics were produced using ORTEP-339or Mercury 2.2.40
Acknowledgment. Financial support was provided by the Natural Sciences and Engineering Research Council of Canada, the Canada Foundation for Innovation, and the Ontario Innovation Trust. This work was made possible by the facilities of the Shared Hierarchical Academic Research Computing Network (SHARC-NET:www.sharcnet.ca) and Compute/Calcul Canada. The advice of V. Jane`ı´k, J. Britten and J. Barbier during the crystallographic studies is gratefully acknowledged.
Supporting Information Available:Complete list of authors for ref 14; selected bond distances and angles for R-6,β-6, and 6 · Py; fractional coordinates ofβ-6; ORTEP representation of R-6; DSC and TGA data forβ-6; selected computational results. This material is available free of charge via the Internet at http:// pubs.acs.org.
JA107252F (34) Bruker TOPAS, Bruker AXS Inc.: Madison, WI, USA,, 2008.
(35) Spek, A. J. Appl. Crystallogr. 2003, 36, 7–13.
(36) Bruker APEX2, Bruker AXS Inc.: Madison, WI, USA,, 2008. (37) Sheldrick, G. M. SHELX97 [Includes SHELXS97, SHELXL97,
CIFT-AB] - Programs for Crystal Structure Analysis (Release 97-2), Institu¨t
fu¨r Anorganische Chemie der Universita¨t, Tammanstrasse 4, D-3400: Go¨ttingen, Germany, 1998.
(38) Farrugia, L. J. Appl. Crystallogr. 1999, 32, 837–838.
(39) Farrugia, L. J. Appl. Crystallogr. 1997, 30, 565.
(40) Macrae, C. F.; Edgington, P. R.; McCabe, P.; Pidcock, E.; Shields, G. P.; Taylor, R.; Towler, M.; van de Streek, J. J. Appl. Crystallogr. 2006, 39, 453–457.
17270 J. AM. CHEM. SOC.9VOL. 132, NO. 48, 2010