Publisher’s version / Version de l'éditeur:
Vous avez des questions? Nous pouvons vous aider. Pour communiquer directement avec un auteur, consultez la première page de la revue dans laquelle son article a été publié afin de trouver ses coordonnées. Si vous n’arrivez pas à les repérer, communiquez avec nous à [email protected].
Questions? Contact the NRC Publications Archive team at
[email protected]. If you wish to email the authors directly, please see the first page of the publication for their contact information.
https://publications-cnrc.canada.ca/fra/droits
L’accès à ce site Web et l’utilisation de son contenu sont assujettis aux conditions présentées dans le site LISEZ CES CONDITIONS ATTENTIVEMENT AVANT D’UTILISER CE SITE WEB.
Report (National Research Council of Canada. Division of Building Research); no. DBR-R-79, 1956-03-01
READ THESE TERMS AND CONDITIONS CAREFULLY BEFORE USING THIS WEBSITE.
https://nrc-publications.canada.ca/eng/copyright
NRC Publications Archive Record / Notice des Archives des publications du CNRC :
https://nrc-publications.canada.ca/eng/view/object/?id=ada7fb7f-5097-4dac-9b3c-60becdcbd800 https://publications-cnrc.canada.ca/fra/voir/objet/?id=ada7fb7f-5097-4dac-9b3c-60becdcbd800
Access and use of this website and the material on it are subject to the Terms and Conditions set forth at
Cobourg Beam Test
DIVISION OF BUILDING RESEARCH
COBOURG BEAM TEST
by
L. J. Marcon
(A co-operative project with the Structural Research Department of the Hydro-Electric
Power Commission and prepared for Central Mortgage and Housing Corporation)
Report No.
79
of the
Division of Building Research
Ottawa
This report contains, in summary form, all the
information gained from the most important and most extensive piece of structural research work yet carried out by the
Division of BUilding Research. The delay in the production
of the report has been due directly to the time required for the assessment of the large amount of information obtained from the test and its preparation in convenient form for presentation in this report.
The character of the project and its origin is
described in the introduction, the test being essentially a full-scale load test almost to destruction of a IOO-foot prestressed precast concrete beam continuous over three
supports. This report has been prepared for the information
of those for whom the task was carried out and others
interested in this major investigation. It is hoped that
permission may be obtained for the preparation of a series of individual technical papers, which may be published in the scientific and technical press, on certain detail aspects of the test which will make themselves obvious as this
general report is studied.
The Division of BUilding Research are grateful to many who assisted them in the preparation for and the conduct
of this project. Information was obtained from many parts of
the world on the basis of a preliminary Technical Note
regarding the method of testing. As the work developed, the
co-operation of the Research Division of the Hydro-Electric Power Commission of Ontario developed to such an extent that
the project was regarded as a joint venture. Throughout the
work the support and encouragement of the staff of Central Mortgage and Housing Corporation, the consulting and designing engineers, the general contractors and the Department of
National Defence assisted greatly and was much appreciated.
Ottawa,
I INTRODUCTION Page
(a)
(b)
(c)
History and purpose of the project .
Description of main beams and construction
procedure .
Design and load requirements ...•..•...
1 2 4 II TESTING PROCEDURE (a) General... 4 ( b) Load5 • • • • • • • • • • • • • • • • • • • • • • • • • • • • • • • • • • • . • • • 5 ( c) DefIe ct 1one 5 (d) Steel strains 6
(e) Concrete strains
6
III PROPERTIES OF THE TEST SPECIMEN
(a) General... 6
(b) Concrete d a t a . . . . 7
(c) Modulus of elasticity of beam concrete
7
( d ) Stee1 data
8
IV PRESTRESSING OF THE BEAM
(a) (b) (c) (d) (e) General .
Deflections during prestressing •... Steel strains during tensioning of the
IOO-foot wires .
Concrete strains during tensioning of
the 100-foot wires .
Loss of prestress •...•.... 8
9
9
10 11V TEST PROGRAM AND LOADING SCHEDULE
(a) (b)
(c)
(d)
National Building Code test
Asyrmnetric loadings .
Twenty-eight day sustained load test •...
Ultimate load test .
12
13
13
13
(b) (c) (d)
(e)
Comparison of actual and theoretical
defle ctions .
Deflections during N. B. C. test .
Deflections during the 28-day test .
Deflection of beam during aSYmmetrical
load lngs .
13
15
15
15
16
VII CONCRETE AND STEEL STRAIN BEHAVIOUR DURING TESTING
(a) (b) (c) (d) (e)
(f)
Symmetrical loadings ...•...•.Designer's theoretical stresses .
Concrete strains due to asymmetrical
loadings .
Concrete strains during N. B. C. test .•...
Concrete strains during the 28-day test •.... Steel strains in wires during loading ••...
16
17
17
18
18
19
VIII CONCRETE CRACKING DURING TESTING
(a) Symmetrical loadings
19
(b) Cracking during asymmetrical loading .•... 20
IX END AND CENTRE REACTIONS
(a) SYmmetrical loadings .
(b) Asymmetrical loadings
21 21
x
PURLIN BRACKET TESTING...
22XI GROUT INSPECTION
...
22by L.
J.
MarconSUMMARY
This report describes the testing of a lOO-foot
continuous (two 50-toot spans) I-shaped prestressed concrete
beam, prestressed with
56
high tensile steel wires anchoredby the Magnel Blaton system. One hundred such prestressed
beams constituted the main roof beams for four large Army ordnance warehouses at Cobourg, Ontario.
The test load was applied at the purlin points by
eleven 50-ton hydraulic jacks operating against a Bailey
bridge reaction frame. The details of the design and
construction of the beam, the method of test, the instruments used, the observations recorded and an interpretation of the
results are given. The loads applied to the beam were
symmetrical and asymmetrical loadings of both spans, the
National Building Code test, a 28-day long term load test and the final load of dead load plus 5.5 live load.
The beam was taken to have failed under about six
times the design load. The load carrying capacity of the
beam's purlin brackets was also determined by testing.
I INTRODUCTION
(a) History and purpose of the project
In 1953 Defence Construction Limited (D.C.L.) constructed for the Department of National Defence (Army) four large ordnance storage warehouses at Cobourg, Ontario. Each warehouse is 500 feet long and 250 feet wide, of single
storey construction. They were designed as reinforced
concrete structures supported on piles by C.C. Parker,
consulting engineers of Hamilton, Ontario. General contractor
was the Richard and B.A. Ryan Company of Toronto.
Large roof beams are a prominent part of the design. For these beams the contractor submitted an alternative
prestressed concrete beam design which had been prepared by
Precompression Company Limited of Montreal. After discussion,
this design was accepted by the consulting engineer and
D.C.I,. and the job proceeded on this basis. Central Mortgage
and Housing Corporation, (C.M.H.C.) through their regional
office at Toronto supervised and inspected construction for
D.C.L. .
In view of the innovations presented by the new beam design, C.M.H.C. requested the Division of Building Research, National Research Council, to do a field loading test on one beam.
Prior to the test a technical note was circulated to a
number of people Lnue r-est ed in the test to trir cr-n them of the
test and to solicit comments and suggestions from them. Many
comments were received and many discussions held, particularly with the research staff of the Hydro-Electric Power Commission
of Ontario and of the structures Section of the Division of
Mechanical Engineering of the National Research Council. The
entire test project was made a co-operative venture between the Division of Building Research and the Research Division of the H.E.P.C.
(b) Description of main beams and construction procedure Each beam is made from two 50-foot units, the cross
section of which is I-shaped, 3 feet deep through the major
part of each span, increasing to 5 feet at the haunched end
(Fig. 1). The top and bottom flanges are both 18 inches wide,
while the web is 8 inches thick. Furlin brackets at 8-foot
4-inch centres are provided to support 25-foot reinforced concrete purlins, which in turn, carry the lightweight concrete roof slabs.
Rectangular purlins
9
inches by 32 inches frame intothe continuous prestressed concrete beams at the column heads
to provide longitudinal rigidity. All other purlins are
simply supported on the beam brackets and are of aT-shaped cross-section, with a depth of 23 inches, a width at the top
flange of 9 inches and a web thickness of 3 inches. The main
section ーイッセ・イエゥ・ウ are listed in Table 1.
The 50-foot units were cast at a central casting bed
adjacent to the warehouses. Cable ducts were formed by means
of rubber cores (Fig. 1). The placing of concrete and moving
of the beams at the casting bed was done by travelling gantry
cranes. After the concrete had reached a strength of 4,000
casting bed by means of
8
straight wires (lowest dotted line in the longitudinal section, Fig. 1), each being 0.276 inchesin diameter. This partial prestressing was sufficient to
overcome the dead weight, handling and erection stresses.
Before erection two 24-wire cables, 100-feet long were inserted in the longitudinal ducts in one of the 50-foot beams. The 50-foot length of cable protruding from the ducts at the haunched end were looped back and placed on top of the beam. After a pair of 50-foot units had been lifted by a crane on top of the columns, meeting with their haunched ends on one column, the 4-inch gap between the haunched ends was partially grouted in with a high strength, quick setting grout, leaVing a U-shaped gap to form a continuous duct for the prestressing
wires. The grout mixture used was by weight 2 parts portland
cement, 4 parts sand and 1 part of a ウセ・」ゥ。ャ proprietory
mixture containing fine metallic (iron) aggregate. This
special mixture counteracts shrinkage through the oxidation and hydration of the iron particles.
After setting of the grout, the cables on top of the one beam were doubled back and inserted in the vertical slot in the haunch of the other beam and then pulled through the
appropriate duct. The beam was then ready to be tensioned.
A concrete compressive strength of 5,000 p.s.i. was specified before the final stressing of the continuous beams was
commenced. The cables were then tensioned in pairs from one
end and anchored by the Magnel Blaton system. The reqUired
tension in the wires was checked by a pressure gauge on the jack and also by measuring the elongation of the wires.
To obtain in each cross-section the desired line of action of the prestressing force the lower 100 foot cable was
then raised up at the middle support. Four l-inch diameter
pins were placed through the web of the beam to hold tte cable in the desired position (Fig. 1).
The cable ducts, which extend to the top of the beam near the centre, were then filled by graVity flow with a
liquid grout to protect the wires from corrosion and to obtain
bond between the wires and the beam. Initially a sand cement
grout of about 1 cubic foot of cement, 1 cubic foot of sand
and
5
gallons of water was used, but found unsatisfactorysince it did not always fill up the full length of the ducts by graVity, probably due to sand particles plugging up the
ducts. The remaining spaces were later filled by a pressure
grouting firm with a liqUid grout without sand.
For the beams in the remaining warehouse a
water-cement grout was used which proved satisfactory. The mixture
used was 5 bags cement and 27 gallons of water. For the
complete grouting of the QPセMヲッッエ beam about 30 bags of
the cable ducts, both to check grouting and to act as air vents.
(c) Design and load requirements
The beams were designed to carry a roof live load of 40 pounds per square foot applied through purlins at the
points shown in Fig. 1. The live load per purlin amounts to
8,320 lb., and the dead load of the roof structure per purlin
is 7,780 lb. The 100-foot ャ・ョセエィ of the beam weighs
approximately 26 tons (Table 2).
II TESTING PROCEDURE
(a) General
In view of the fact that the beam was made under normal field conditions and not under conditions which could be called "controlled conditions" from a research point of view, it was not considered that the project warranted the extensive instrumentation required for a complete strain
investigation. The Division, however, proceeded with a
limited program of strain measurements, partly in order to gain experience in this type of work and partly to increase the value of the load and deflection measurements.
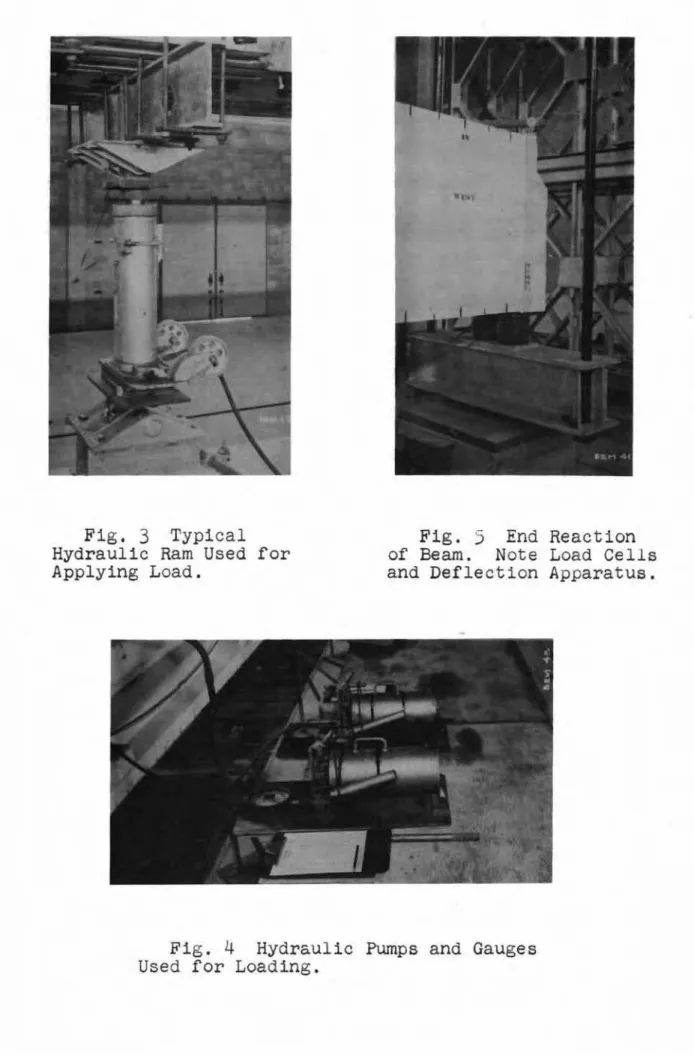
The set up used to test the beam is shown in Fig. 2. A reaction beam made up from Bailey bridge units was usen. The method of applying load and anchoring the test beam and
the reaction beam is shown in Figs. 3 and
5.
The centresupport was fixed whereas both end supports were on steel rollers as shown in Fig. 2A.
The idea of using dead weights as a means of applying load had been rejected because of the total loads which
would have to be handled and the fact that all expenditures for this part of the test procedure would have been completely
lost after the test. Further, there was no convenient supply
near the job of such concentrated loads of steel ingots in sufficient quantity for the test and the necessary rigging
would have been costly and complicated. It was felt that most
of the money invested in the Bailey reaction beam and
hydraulic jacks was recoverable since this equipment could be used on future tests.
(b) Loads
The test loads were applied by means of eleven 50-ton
hydraulic jacks, their capacity being approximately 75 per
cent greater than the estimated required capacity at failure. The chosen type of jack is also characterized by a lock nut arrangement which is very helpful for applying sustained
loads (Fig.
3).
All pump units were equipped with pressuregauges which had been calibrated against jack load in a
testing machine (Fig. 4). Load cells using electrical
resistance strain gauges were placed under the ends and the centre of the beam to measure the reactions and also to serve
as a check of the overall applied load. The load cells were
also calibrated before the test (Fig.
5).
Difficulty was experienced in applying small loads
such as 4,000 lb. per jack
(i
DL) because of the very lowpressures to be used on the large jacks. The gauges had a
full scale reading of 10,000 p.s.i. Very good agreement
between the jack loads and the reactions was obtained at loads
equal to and greater than DL
+
LL.(c) Deflections
Deflections were recorded at each purlin point and at both ends, thus giving a total of 13 points from which a
deflection curve could be plotted (Fig.
6).
Deflectionmeasurements were made by three methods.
The smaller deflections of the beam under relatively light loads were measured by dial indicators reading to
0.001 inch and with a range of 1 inch. Gauge blocks were
used to extend the range of dial indicators.
Very fine wires attached to the underside of the beam and passed over a system of pulleys to a central location provided a means for measuring the larger deflections under
higher loads. Important advantages of this method were that
any progressive deflection under load can be detected immediately and that remote measurement is possible.
Further readings on deflections were made by a precise optical levelling instrument at the ends and centre support of the beam to check on any settling.
To check on any possible rotating of the beam, dial
indicators were placed at the outer edges of the beam. Thus
any difference in readings would indicate tipping. This was
done at the ends and the centre of the beam. In addition
two spirit levels were used as a quick check en any tipping at the mid-span locations.
(d) Steel strains
Strains on the prestressing wires were measured by
electrical resistance strain gauges. In order to minimize
the danger of damaging the gauges as the cable was drawn through the ducts it was decided to place them a short
distance from one end. Tte wires which were gauged are
shown in Fig. 10.
(e) Concrete strains
Since more concrete test cylinders had been taken
from span B, it was decided to take the majority of the strain readings on this half of the beam.
Strains in the concrete were measured by electrical resistance strain gauges and also by a mechanical
extenso-meter. The positions of the gauges are shown in Fig. 6. As
a double check, electrical strain gauges were straddled by points for the 8-inch extensometer.
Some difficulties were experienced in taking readings due to temperature and humidity changes in the test area. Variations in taking mechanical extensometer readings was reduced by always attempting to have the same person take the readings.
A constant record of temperature and humidity was kept during the test.
III PROPERTIES OF THE TEST SPECIMEN (a) General
The two 50-foot units which made up the laO-foot continuous test beam were cast on dates one month apart. Span A was cast on March 16, 1953, initially tensioned on March 21, and span B on February 16 and March 2 respectively.
Date
HISTORY OF TEST BEAM Description February 16, 1953 March 2, 1953 March 16, 1953· March 21, 1953 May 11, 195'3 May 25, 1953 June 30, 1953 August 6, 1953
Span "B" was cast
• Span "B" initially tensioned Span "All was cast
Span "A" initially tensioned
First attempt at final prestressing Final tensioning of beam completed Beginning of test period
(b) Concrete data
The mix used was
4
bags(87.5
lb. each) of high earlystrength cement,
592
lb. of sand and928
lb. of gravel, or aweight ratio of
1:1.67:2.65.
The average 9lump was1.8
inches.The owner's specifications required a minimum ultimate
compressive concrete strength of
5,000
p.s.i. at7
days.Figure
7
gives the concrete strengths obtained from concretetest cylinders and core samples removed from the end section of span B.
The concrete in span B had a slightly higher compres-sive ウエセ・ョァエィ than span A. The average concrete strength of
both spans during the time of testing was approximately
7,000
p.s.i.The concrete core samples from span B gave rather
irregular results. The eleven month test produced strengths
from
10,760
p.s.i. to8,560
whereas the two year old coresgave strengths varying from
9,600
p.s.i. to5,070
p.s.i.The two low core strengths at two years may be due to the concrete having been weakened by beam load test.
(c) Modulus of elasticity of beam concrete
The conversion of the concrete strain data to equivalent stresses necessitates knowing the value of the
modulus of elasticity of the concrete. This value is not
constant, but varies depending on several factors, chiefly the magnitude and sign of the stress, age of concrete, and
previous loading history of the concrete. After a library
research and discussions the most representRtivg value of the
modulus of elasticity decided upon was
5.2 x 10
p.s.i. Todetermine this value of Ec the following four methods were used as a guide.
The first method was the comparison of actual bending strains to the stresses calculated from the bending moment diagram'
6
The average Ec according to these calculations is5.5
x10
p.s.i.The second method was the comparison of the designer's theoretical stress figures with the measured strains at several
cross-segtions. This method gave an average value of Ec of
6.3
x10
p.s.i.The third method was the comparison of the theoretical
and measured deflections. To make the designer's deflection
curve eqgal to measured curve would have required an Ec of
3'6
x10
p.s.i. whereas the designer had used an Ec of5.01
xFinally a series of compression cylinders and concrete core samples taken from the beam were tested under different
loads. Three concrete cylinders tegted at the end of the beam
test gave an average Ec of
5.5
x 10 p.s.i. The concrete coresamples (2.8 inches in diameter,
5.6
inches high, age 11 months)エ。セ・ョ from a section of span B gave an average Ec of 5.0 x
10 p.s.i.
(d) Steel data
The requirements for the prestressing wire were as follows:
minimum yield strength (0.2 per cent offset) 160,000 p.s.i. minimum ultimate tensile strength 215,000 p.s.i.
The working stresses were not to exceed 128,000 p.s.i.
The wire actually used for construction exceeded these
minimum requirements. The actual 0.2 per cent yield strength
is in the neighbourhood of 203,500 p.s.i. and the ultimate
strength is approximately 229,400 p.s.i. The modulus of
elasticity was obtained by testing 8 specimens of wire. bッセィ
electrical resistance strain gauges and the testing machine's automatic strain recorder were used to obtaig the modulus. Both systems gave an average Es of 27.8 x 10 p.s.i.
Dl PRESTRESSING OF THE BEAM
(a) General
No strain and 、・ヲャ・セエゥッョ measurements could be made
during the initial partial prestressing of the 50-foot units, because the beams were received for testing after this
opera-tion had been completed. It was reported that the tensioning
of the lower eight 50-foot wires required an elongation of
3
inches and that the average slip occurring during thewedging operation was 1/8 inch.
The beam was ready for complete tensioning of the
lOa-foot wires on May 11. On tensioning the wires however,
it was found that abnormally high pressures were necessary to
obtain the required 6 inch elongation. The condition became
so serious that it was decided to completely replace the
lOO-foot cables. The cause of the irregularity was probably
the twisting of the cable in the ducts. The test beam
showed such an irregularity. A new pair of cables was inserted and new electrical resistance gauges had to be installed.
On May 25 the new wires were tensioned with no
diffi-cUlty. Figure 10 shows the sequence in which the wires were
tensioned. The same day the lower cable was raised by a Jack
and sling arrangement and the location pins were inserted. (b) Deflections during prestressing
The deflections of the beam during tensioning are
shown in Fig.
8.
The maximum recorded deflection was 0.15inch.
During the tensioning operation span A always showed
a greater upward deflection than span B. This condition was
probably caused by the loss of prestress due to friction
along the cable duct, thus resulting in a smaller prestressing
force in span B. The difference in deflection could also be
attributed to difference in age, since span B was the older
span. During the prestressing there was very little movement
at the ends and centre support. The centre support lifted
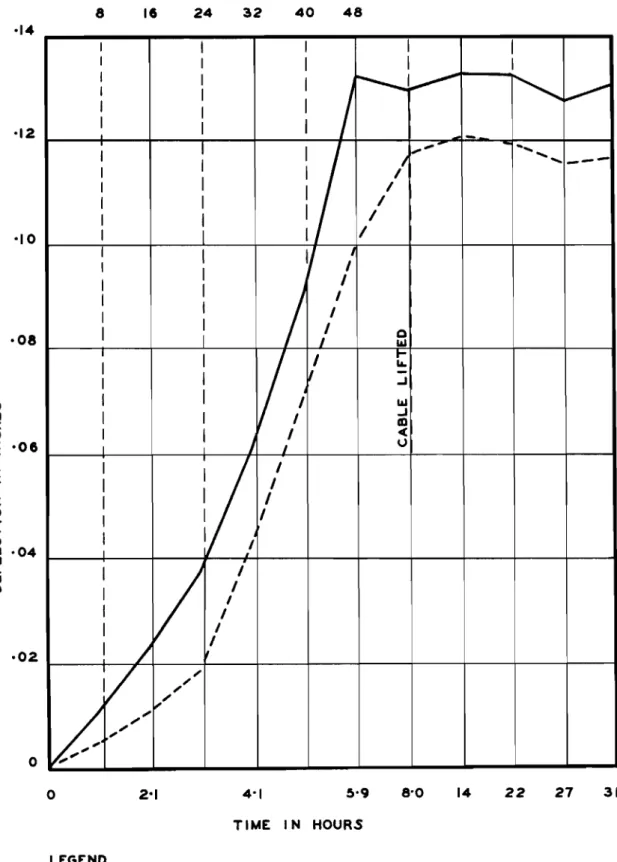
about 0.004 inch. Deflection behaviour with time could only
be followed for one day, since erection of Bailey test structure made the removal of the dial gauges imperative. Figure 9 shows time deflection curve for two similar points
on the beams. The decrease in deflection 23 hours after
final tensioning was very small as can be seen in Fig.
9.
(c) steel strains during tensioning of 100-foot wires The 100-foot wires were tensioned from the end of
span A. The electrical resistance strain gauges on the wires
were located about
6
feet from the end of span B.The procedure followed in measuring the steel strains in the wires during tensioning was to take electrical resis-tance strain gauge readings in the following order:
(i) prior to tensioning of the gauged wire;
(ii) immediately after tensioning the wire but prior
to wedging;
(iii) immediately after the wire was wedged. In addition readings were taken on all tensioned gauged wires after each sandwich plate or eight wires were
readings. The elongation of each wire and amount of slip was
measured and recorded during the tensioning of the beam. The
required elongation of the lOa-foot wires was 6 inches, which
is equivalent to a strain of 5,000 micro inches per incho
In Table 4 it can be seen that the upper wires (3, 7,
11, 19 and 23) showed a decrease in strain during the wedging operation, whereas the lower wires (27, 35 and 47) showed an
increase in strain. By actual measurement with a steel rule,
all.wires showed a decrease in elongation during the operation,
varying from セ to 1/16 inch with an average slip of 1/8 inch
(Table
5).
No reason can be given for this increase in strainmeasured by the electrical resistance strain gauges. The
increases, however, were small.
Wires 3, 7, 11 and 15 showed a decrease in strain
between the time of their individual tensioning and the complete tensioning of the sandwich plate of which they formed a part. This decrease was probably due to a redistribution of strain in the wires making up the sandwich plate.
As Fig. 11 shows, with successive completion of tensioning sandwich plates, the steel strains in the upper
wires
(3, 7,
11, 15, 19, 23 and 31) increased, not decreasedas is usually thought. With the exception of wires 23 and 31,
the reason for the increase in strain is that the wires are above or quite close to the centroid of the beam's
cross-section. Haunching of the beam increases with further
tension-ing, resulting in an increase in tension above the centroidal axis.
When the lower lOa-foot cable was lifted all gauged
wires in this cable showed an increase in ウエセ。ゥョL whereas the
wires in the top cable showed a decrease in strain as expected.
All wires showed a decrease in strain
6
hours after completetenEioning of the beam.
Due to the possible wetting of the gauges with grout and/or the temperature effects on the active gauges, erratic readings were obtained so that it was not possible to follow
loss of prestress with time. After two weeks the electrical
resistance strain gauges became stable and new zeros were taken. The last three values in Fig. 11 show the effect of the grout
on the gauges. On the right hand side of Fig. 11 is given the
corresponding stresses using a value of 27.8 x 10
6
pos.i. forthe modulus of elasticity for the steel wires.
(d) Concrete strains during tensioning of the lOa-foot wires
Concrete strain readings were taken before, during,
and after the tensioning of the lOa-foot wires. The concrete
extensometer during tensioning is shown in graph form in
Fig. 12. The electrical resistance strain gauges gave
readings about 50 per cent smaller than the mechanical 8-inch
extensometer. As this was the staff's first experience with
electrical resistance strain gauges on concrete and the
readings measured were abnormally small, only the mechanical extensometer readings were used in the evaluation of the
results. During the actual loading test, however, the
electrical and mechanical strain gauge readings were found to show much better agreement (Fig. 23).
The strain Ratterns for the same sections of spans A and B (28-foot mark) are very similar and serve as a good
check on our instrumentation. The lower flange at the
I-foot-6-inch mark gave an irregular pattern, but this is probably because of non-uniform strain near the centre support and also because the gauge points on the lower flange at this section were not readily accessible for reading.
There was a gradual uniform transition in the strain diagrams as more wires were tensioned.
The largest change in concrete strain due to lifting of the lower lOO-foot cable was in the top flange' at the 28 and 39 foot sections of span B and amounted to 20 micro inches
per inch or a stress of 104 p.s.i. ustng an Ec of 5.2 x lOb p.s.i.
Very little change in strain was noticed in the lower flange. The bottom row of strain diagrams in Fig. 12 also shows some of the theoretical strains obtained from the dgsigner's
prestressing stress figures using an E of 5.2 x 10 p.s.i.
The largest variation occurred at the !0-foot-10-inch section.
The dotted line "CII in Fig. 12 is the total of the
designer's theoretical figures for the dead weight of the beam and 100 per cent prestress of the eight 50-foot wires plUS the measured strains due to prestressing for forty-eight
100-foot wires. This last total will be used for the discussion
of the final strain conditions in this report: (e) Loss of prestress
From the day of prestressing to the day of the first
load application (37 days) the average concrete セョセーイ・ウウゥッョ
strain increase in the top and bottom flange is 117 micro inches per inch.
This increase in strain due to creep and shrinkage represents a loss of 2.3 per cent of the average steel wire strain of 5,000 micro inches per inch at the time of final prestressing.
The reasons why the percentage loss was so small
(2.3
per cent) are probably:(1) The loss due to shrinkage would be reduced because of the age of the beams at time of prestressing;
span A was 70 days old and span B was
98
days old.After their initial curing period at the casting site the test beams were exposed to the hot summer air and sun, and covered by canvas during rainy
periods. The beams had, therefore, undergone a
relatively large percentage of the final shrinkage. (2) Some creep had already occurred due to the
initial prestressing of the eight 50-foot wires. This initial creep was unknown since test beams were received after the initial prestressing was
completed.
The total average increase in concrete strains up to the final day of testing was 166 micro inches per inch, which
represents a loss of
3.3
per cent of the initial steel wirestrain. This increase in strain is due to continuing
shrinkage and creep plus the residual plastic flow of the beam produced by the 28-day teEt.
V TEST PROGRAM AND LOADING SCHEDULE
In order to study the behaviour of the セ・。ュ under
various loading conditions, the loading progrqm in Tables 6A
and 6B was carried out. In this report dead load (DL) always
represents the weight of the roof structure excluding the
weight of the beam itself. This dead load includes the
weight of the purlins, roof slabs and roofing materials.
Instruments readings were taken before and after the applica-tion of all load increments.
(a) National Building Code test
As there are no provisions in the National Building
Code
(1941
edition) for tests on prestressed concrete structuresthe criteria for loading tests on reinforced concrete beams
were used. The code specifies that a load of dead load +
ャセ live load be left on セィ・ beam for 24 hours and that the
beam must have at least a 7S per cent deflection recovery in the 24-hour period follm.ing the removal of the load,
Deflection, steel, and concrete strain readings were taken at regular intervals during and after the load was applied.
(b) Asymmetric loadings
The purpose of this test was to check the behaviour of the beam under various combinations of asymmetrical
loading and it also served as an additional means of comparing
the behaviour of each individual span under load. The first
series of asymmetrical loadings only went up to an unbalanced
load of DL
+
1 LL so as not to cause any permanent damage tothe beam. In the second series of asymmetric loadings the
load was increased to DL + 2LL and resulted in cracking of concrete.
(c) Twenty-eight day sustained load test
The purpose of this test was to check the creep of
the beam under long-term loading. A load of DL + ャセ LL was
used. Strains and deflections were read at regular intervals
during the 28-day test and also for several days after the removal of load.
(d) Ultimate load test
In the ultimate load test the beam was subjected to
a load of DL + Uセ LL without complete failure. At this point
one of the jacks became displaced, because of a broken shackle
bolt . . This displaced the entire test set-up. The beam sprang
back and regained its original position, again キゥエィセオエ
complete failure. The slipping of the jack actually subjected
the beam to a severe impact test, for the slipping of the セ。」ォ
resulted in the almost ip9tantaneous unloading from DL + 52 LL.
There was no serious ウエイセ」エオイ。ャ failure apparent, although
cracks appeared in the top flange at mid-span. These cracks
were probably the result of the beam springing upwards. After careful consideration of all factors, it was decided not to go to the trouble and expense of rearranging the entire test set-up merely for the purpose of breaking
the damaged beam. Tests were conducted on the strength of
the purlin seats before the beam was finally broken up and removed.
VI DEFLECTION BEHAVIOUR DURING TESTING
(a) Symmetrical loadings
In Fig. 13 are plotted the complete deflection data
obtained from the wire and pulley system. This figure gives
the deflection pattern up to the last measured readings.
became displaced just as this load was reached. For a more accurate picture of deflection see Fig. 14, which is a plot
of deflections up to DL + 3.0 LL obtained from dial gauges.
Corrections have been made for movement at the ends and centre supports.
One interesting point is that up to DL + 1.5 LL
span A always showed a larger deflection, for DL + 2 LL
deflections for spans A and B are almost equal and for loads
larger than DL + 2.0 LL span B showed the larger deflection. This behaviour was also quite evident from the cracking
pattern. Up to DL + 2.0 LL there was no indication of
which span was likely to fail first, but at DL + 2.5 LL and
DL + 3.0 LL span Bls cracking pattern indicated that it
would probably fail first.
Figure 15 is the load deflection curve for the beam. It is a typical curve for a prestressed concrete beam
consisting of two portions, the straight line followed by a
curved line which becomes progressively steeper. At or
about the junction of the two portions of the curve,
cracking occurs. During the 28-day test the beam cracked at
the top of the centre support under a load of DL + ャセ LL.
This crack opened up on reapplying DL + 1 LL. The straight
line portion of the curve starts to curve in the DL
+
1.0to 1.5 LL range. The steep slope of the curve at DL +
5.25 LL indicates that the beam was near its ultimate load.
The maximum deflection recorded for DL + 5.25 LL was 3.29
inches at gauge 10 on span B.
The amount of movement at the ends and centre support
was measured by dial gauges. The centre support always
settled during application of ャorセL the amount being about
0.20 inch for loads up to DL +
3
LL and increasing to 0.34inch at DL + Tセ LL.
The end of span A had a downward movement of about
0.06 inch up to DL + 3.0 LL and then started to lift with
increasing load. At DL + Sセ LL the lifting had increased to
0.26 inch and had to be corrected by adjusting the nuts on
the tie rods. With increased loadings the upward deflection
remained at about 0.30 inch. The end of span B had a
constant upward deflection of about 0.03 inch up to DL + 2 LL,
increased to 0.09 inch for loads up to DL + 4 LL, and at a
load of DL + Tセ LL increased to 0.30 inch and remained at
0.30 until end of test.
The deflection readings obtained from the wire and pUlley system and the dial gauge system agreed qUite closely, the maximum variation being 5 per cent, with most readings closer to 2 per cent.
The deflections of the beam for the same load
shown in Fig. 16. For loads less than DL the curves are actually reversed but this is probably due to inaccuracies in applying the low loads resulting from temperature and
humidity effects. The increase in deflection with the number
of load applications becomes obvious for loads greater than
DL + 1 LL. For the two gauge positions shown on the graph,
the increase in deflection is approximately 0.03 inch for
loads up to DL + Rセ LL and increases to 0.10 inch at DL +
Sセ LL.
(b) Comparison of actual and theoretical deflections
In Fig. 7 the calculated and measured deflections for
a load of DL + 1 LL have been plotted. The calculated values
were obtained from the designer for 100 per cent and 85 per cent prestress.
The maximum calculated deflection at the 32 foot mark (0.155 inch) at 100 per cept prestress was 75 per cent of the
actual measured deflection (0.206 inch) (average of spans A
and B) and 84 per cent for the calculated deflection at 85
per cent prestress (0.173 inch). At 7 feet from the centre
support the calculated deflection at 100 per cent prestress (0.005 inch) was 20 per cent of the actual measured deflection (0.025 inch) and 32 per cent of the calculated deflections at 85 per cent prestress (0.008 inch).
(c) Deflections during N. B. C. test
The 、・ヲャ・セエゥッョウ of two identical points on spans A and B are plotted in Fig. 18 for the National Building Code
test. iイイ・ァオャ。イゥエセ・ウ in the deflection curve are due to
stress redistributions in the steel cables and the effect
of changing temperature and humidity. The increase in
rteflection during the 24-hour load period was 17 per cent
for span A and 9 per cent for span B. The immediate
deflec-tion recovery for span A on removing load was 88.8 per cent
セョ、 increased to 93 per cent in 1.5 hours, the respective
percentages for span Bare 93.5 per cent and 98.5 per cent. Therefore, the beam passed the required minimum deflection
recovery of 75 per cent. .
(d) Deflections during the 28-day test
The deflection history Pセ gauges 9 and 10 on span B
during the .28-day test is shown in Figs. 19 and 20.
The irregularities in the deflection curve are due to temperature and humidity changes at the test site, strain redistributions in the beam, and the adjusting of the
hydraulic jack pressures due to creep in the beam. The
instantaneous deflection upon applying DL + ャセ LL was 0.258
inch and increased to 0.384 inch or 49 per cent in 28 days. The immediate deflection on removing load was 0.128 inch
or a recovery of 66.6 per cent. During the 5-day recovery
period the deflection decreased to 0.095 inch giving a total
recovery of 75.2 per cent. Similar deflection patterns were
obtained for all other deflection gauges. The time and
sequence of risAs and falls in the curve are the same as
those of the ccncrete strains during the 28-day test (Figs.27, 28, 29 and 30).
(e)
Deflection of beam during asymmetrical loadingsThe deflections of the beam under asymmetrical
loadings are plotted in Fig. 21. The graph shows that the
deflection behaviour of the two spans was very similar. Deflections of the beam under asymmetrical loadings of DL
and DL +1 LL are almost exactly the same. The maximum
difference occurred in the span loaded with DL during the
asymmetrical loadings of DL and DL + 1.5 LL. This difference
may be due to difficulty in stabilizing the hydraulic jacks due to uplift of the span.
During the asymmetrical loading of DL and DL + 2.0 LL the maximum downward and upward deflections were 0.511 inch
and 0.176 inch respectively. The maximum deflection under
a symmetrical load of DL + 2.0 LL was 0.330 inchA
VII CONCRETE AND STEEL STRAIN BEHAVIOUR DURING TESTING (a) Symmetrical loadings
The concrete strains recorded during the symmetrical
loadings are plotted in Fig. 22. These values represent
averages of all readings obtained from a particular point. Strain diagrams at the 10-foot-10-inch section and
39-foot section are plctted up to DL + 3i LL and DL + 4 LL
respectively. Readings were then discontinued because strains
had exceeded the range of the mechanical extensometer. The
increments in concrete strain at the 10-foot-10-inch section are qUite small because of small bending moment at that
section near the point of inflection.
The strain diagrams at the 28-foot section of span B (four feet from location of maximum bending moment in span)
show the effect of cracking. At DL
+
2 LL the lower flangeDL + Rセ LL the beam had cracked at this location and therefore
gave an extremely large strain reading as shown. Similar
behaviour was recorded at the 28-foot section of span A. At the l-foot-6-inch section the cracking occurred
at DL
+
3.0 LL, a loading condition at which according to thestrain diagram (Fig. 12, A and B) there should still be
compression in the extreme top fibre. The reason for this
discrepancy is probably the magnitude of calculated stress
due to prestressing of the eight 50-foot wires. Theory
assumed uniform stress across the l-foot-6-inch section, which was only 1 foot, 4 inches from end anchorages of the
50-foot wires. To make the strain diagram agree with the
tensile strain in the top fibre which must have been present to produce cracking, the compressive strain in the top flange (dotted line) would have to be reduced considerably so that DL + 3.0 LL creates tension.
All strain diagrams·up to a load of DL + 2.0 LL were in compression, DL + 2.5 LL being the first load to produce tension at the two 28-foot sections.
A comparison of strains measured by extensometer and electrical resistance strain gauges is made in Fig. 230
(b) Designer's theoretical stresses
In Fig. 24 are plotted the designer's theoretical
stresses of the beam for various load conditions. Due to
the small loss in prestress (2.3 per cent) the theoretical stress diagrams with 100 per cent prestress should be used
for comparison. Since the initial concrete strains in the
beam were unknown, the best means of comparison is the strain
and stress diagrams due to DL + 1 LL (Figs. 22 and 24).
This comparison again leads to the difficult problem of the
modulus of elasticity of concrete 0 The Ec necessary to make
theoretical stresses agree セゥエィ the experimental strains
varies ヲセッュ 9.0 to 3.8 x lOb p.s.i., with an average Ec of
6.3 x lOb pos.i. This degree of variation makes difficult
an accurate comparison of stresses and strains.
(c) Concrete strains due to asymmetrical loadings In Figs. 25 and 26 the concrete strains due to
asymmetrical loadings are plotted. In Fig. 25 the concrete
strains of the span loaded with a constant load of DL are shown, whereas in Fig. 26 the concrete strains from the span loaded with DL plus increments of LL are plotted.
In the span loaded with DL plus increments of LL the first crack due to asymmetrical loading occurred at DL
strain diagram. A symmetrical load ッセ DL + 2.5 LL later
reopened this crack. As expected the asymmetrical loading
produced larger concrete strains than the equivalent
symmetrical loadings at the SYMセッッエ and RXMセッッエ sections.
At the RXMセッッエ section the asymmetrical loading up to DL
+ 2.0 LL produced a change in compressive strain ッセ 320 micro
inches per inch in the top セゥ「イ・L whereas the change due to
the symmetrical loading ッセ DL + 2.0 LL was 215 micro inches
per inch. At the QMセッッエMVMゥョ」ィ section the change in concrete
tensile strain due to DL + 2.0 LL was 235 and 190 micro inches
per inch respectively セッイ symmetrical and asymmetrical loadings.
In the span with a constant load ッセ DL no cracks were
observed. The larger changes in strain in this span occurred
at the 10-foot-10-inch section, which under symmetrical
loading was the location of the least concrete strain changes. The concrete strain changes, A, at the l-foot-6-inch and 10-foot-10-inch sections increased with loading on the opposite span, whereas the concrete strains at the 28-foot and 39-foot
sections decreased. The concrete strain changes due to
ゥョ」イ・。ウセTQァ load at the 39-foot section were too small and
irregular to pick up with the strain gauges. All strain
diagrams A and B in the dead load span were compressive at
the maximum recorded asymmetrical loading of DL and DL +
1.5 LL.
(d) Concrete strains during N. B. C. test
The time-strain curves obtained for the N. B. Co test follow a pattern similar to the time-deflection curve shown
in Fig. 18. The average increase in concrete strain after
application of the full load was 12.5 per cent whereas the
average increase in deflection was 13 per cent. The amount
of concrete strain recovery was similar to the deflection behaviour.
(e) Concrete strains during the 28-day test
For the 28-day test the mechanical extensometer readings were solely used due to the well-known zero-drift characteristics inherent in electrical resistance strain gauges with time.
Typical historj,es of the concrete strains during the
28-day test are shown in Figs. 27, 28, 29 and 30. The figures
present strains at the 28 and l-foot-6-inch sections of span B, the sections closest to the maximum positive and
negative bending moments. Strain gauges CM 3,
4,
11 and 12are in regions of increasing compression with load whereas
CM 5,
6,
9 and 10 are in regions ッセ decompression with load.during and after the 28-day test. The concrete stresses calculated from the strain diagrams in Fig. 22 are also
tabulated. The stresses at CM
9
and CM 10 are probablymuch closer to zero stress as explained previously.
The comparison of strain and deflection percentage
changes in Table
7
shows that strain gauges CM 3, 4, 11 and12 represent the deflection behaviour more closely than the
gauges at CM 5, 6,
9
and 10. The reason for this behaviourwas probably the higher stresses at CM 3, 4, 11 and 12
which in turn would show larger changes. The strain recovery
at CM 5, 6,
9
and 10 was higher probably due to small stresspresent at the gauges.
(f) Steel strains in wires during loading
The actual initial strain in the steel wires during the loading schedule was not known due to the effect of the
grouting operation on the gauges. Zero readings were taken
on each wire prior to each loading and readings repeated
after application of each load. The difference between these
readings for 6 typical wires are plotted in Fig. 31 for the last three load series.
Wires 3, 15 and 19 showed a very irregular strain
pattern because of their position above and/or close to the
centroid of the beam's section. Wires 31, 35 and 47 followed
a linear strain pattern as can be seen in Fig. 31.
The maximum rgcorded increase in steel strain (in
wire 47) was 92 x 10- inches per inch at a load of DL +
4.5
LL. This increase represented only 1.9 per cent of theinitial steel strain immediately after complete エ・ョセゥッョゥョァN
Larger increase, however, would have been obtained if steel
strain gauges had been located at position of maximum moment0
VIII CONCRETE CRACKING DURING 'TESTING
(a) Symmetrical loadings
The first visible crack was noticed on the 5th day
of the 28-day sustained load test. A hairline crack appeared
in the upper part of the vertical joint at the centre support. This crack increased in length from 13 inches (When first
noticed) to 21 inches at the end of the 28-day test. This
crack reopened on applying DL + 1 LL. The first crack due
to positive moment occurred at DL + Rセ LL at the
3l-foot-6-inch mark on span B. This crack had already appeared
on span B in the lower flange at the 25- and 34-foot marks. No cracking was noticed in span A.
At DL + 2t LL the lower flange of span A at 32 feet
also started to crack. The load of DL
+
3 LL increased thelength of eXisting cracks and produced an additional crack
at the 28-foot mark in the lower flange of span A. This
load also produced further cracking in the top flange near
the centre support. Span A had a crack at the
3-foot-6-inch mark 15 inches deep, while span Bls crack occurred at the Sセヲッッエ mark and was 20 inches deep. Further loadings increased the extent of existing cracks and produced a crack
pattern as shown in Fig. 32. The largest crack observed
before the jacks were displaced was at the 3l-foot-6-inch mark on span B and would probably have been the location of
ultimate failure. No visible cracks were noticed near both
ends of the beam .. At the maximum applied load of DL + 5.5 LL
the beam had almost reached its carrying capacity because continuous pumping of the jacks produced very little
increase in load and cracking was very advanced.
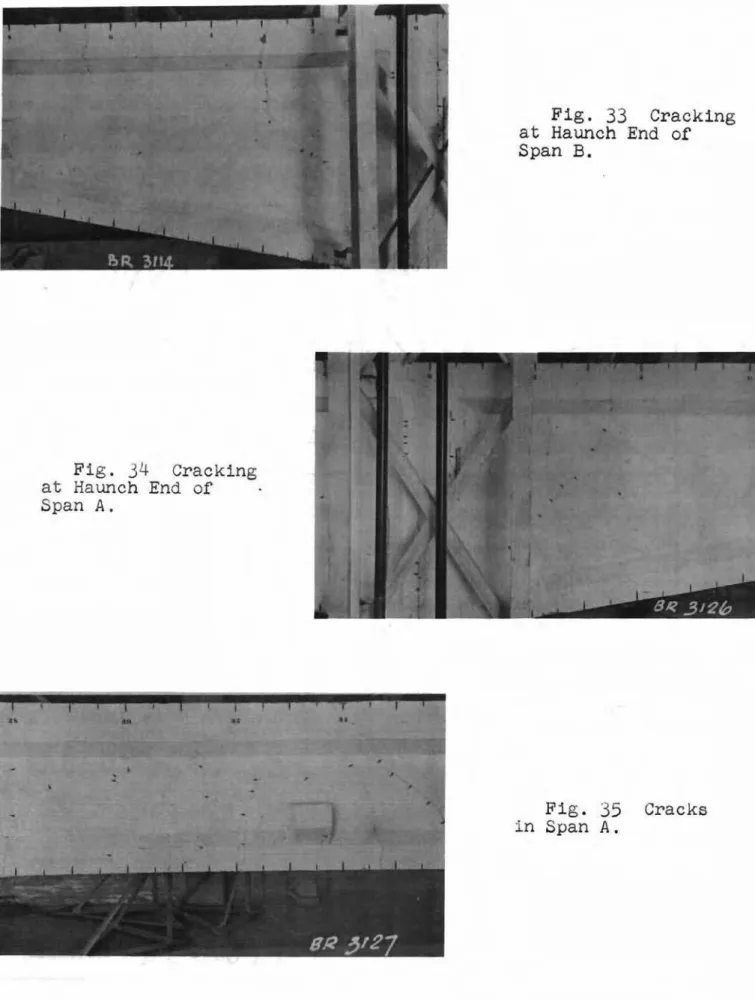
The sudden unloading of DL
+
5.5 LL caused the beamto spring up with such force that cracking occurred in the top flange at the 24, 28, 31.5 and 35 foot positions of
span B. This sudden unloading also caused cracks to extend
the full depth of the beam at the centre support as is shown in Figs. 33 and 34.
These cracks occurred at the joints formed between the precast beams and the grout used to fill up the 4 inch
gap at the centre. The presence of the above cracks was one
of the reasons for not continuing the test after the jacks
kicked out. Further details of cracks are shown in Fig. 35.
(b) Cracking during asymmetrical loading
An aSYmmetrical load of DL and DL + 2.0 LL produced
cracking in the span loaded with DL + 2.0 LL (span
B).
Theconcrete could be heard cracking during the application of
this load. The first crack occurred at 28 feet, followed by
two other cracks at 25 feet and 31 feet 6 inches. The crack
at 28 feet occurred between the two strain gauge points at that location.
No cracking occurred in span A during the aSYmmetrical loadings.
The above cracks reopened on applying a symmetrical .
IX END AND CENTRE REACTIONS (a) Symmetrical loadings
The total applied load calculated from the hydraulic jack pressures and the load calculated from the eight load
cells varied by about 3 per cent. Greater variations were
obtained for loads lower than and including DL because of the difficulty of reading low pressures on a high-pressure
gauge and also at the final load of DL +
5t
LL, which may bedue to bending in the end load cells.
The centre support carried an average of 70 per cent of the total load, with the remaining 30 per cent divided
evenly between the two end reactions. The percentage of
total load carried by the centre support was very constant throughout symmetrical loadings, the maximum variation being
about 1 per cent. Knowing the end reaction and centre
support it was possible to calculate the accurate bending
moment 9iagram for the beam. Figure
36
shows the bendingmoment diagram.
(b) Asymmetrical loadings
Larger differences occurred between loads calculated from load cells and hydraulic jack pressures during the
asymmetrical loadings than the symmetrical loadings. The
reason was probably the effect of rotation of the beam at the centre support upon the load cells where there was no
roller. In Table 8 are shown the average load and percentages
of total load at each reaction for the various load combina-tions.
During the various load combinations the percentage of total load at the centre support remains roughly constant, with the greatest changes occurring at the end reactions.
Percentage increase and decrease of the end reactions is not
uniform with increase in load. At the asymmetrical loading
of DL and DL + 2 LL the reaction at the end of the dead load
span was only 1.6 per cent of total load. Under this load
all deflection points in the dead load span showed an upward
aISplacement. It was this load which produced cracking in
X PURLIN BRACKET TESTING
Initially it was plcnned to load the beam through the purlin brackets rather than on the top flange, as this would represent the actual loading conditions in service.
It was later reasoned that if the brackets failed before the beam itself, the damage might have been sufficient to
prevent further loading of the beam and the main purpose of the test was to check the behaviour of the beam under load, not the behaviour of the purlins.
The purl ins were loaded with the yoke arrangement
shown in Fig.
37.
Two pairs of purlins in span A weretested. The first pair, 16 feet, 8 inches from the centre
support carried a load eqUivalent to DL + 4.0 LL before any
cracking occurred. The concrete in this area had been
cracked due to previous test loads.
The purlin brackets at the 32-foot-8-inch section were in a region of uncracked concrete and showed no signs
of weakness due to previous test loads. The first crack
occurred at DL + 9.8 LL, which resulted in a drop in the
jack hydraulic pressure. The pur-t.m brackets were loaded
to the capacity of the jack, 58 tons or DL + 13 LL producing
the cracking shown in Fig. 38. Further purlin bracket
testing was considered unnecessary.
XI GROUT INSPECTION
To be removed from the test area the beam had to be broken into several short sections by a pneumatic chipper and a cutting torch.
No visible slipping of the wires and no visible drop in the beam occurred when the anchor plates at the end of
span A were burnt offo This indicates that the bond was
sufficient to transfer the complete tensioning force.
Examining the ducts at the ends of the cut sections revealed
that all the wires were surrounded by grout. However, there
was a small narrow space between the grouted cable ュセウウ and
the concrete edges of the ducts due to grout shrinkage. The
XII CONCLUSIONS
The result of testing one beam demonstrated that the
methods of design were adequate and on the safe side. It must
be remembered that only one of the 100 foot beams were tested. The beam gave a load factor of safety of 1.5 at the first
crack at the centre support, and a factor of 2.5 for cracking in the span and more than 5.5 against failure
considering the live load only. The factor of safety at the
maximum load reached, considering all loads, was 294.5
88.6
+26.0
=
2.57294.5 Tons
=
Total Load of DL + 5.5 LL88.6 Tons
=
Total Load of DL + 1 LL26.0 Tons
=
Total Dead Weight of 100 foot beamThis is more than ample. The German regulation for prestressed
concrete specifies a factor of safety of 1.75.*
According to the strain measurements taken, there were no tensile strains in the concrete beam under design
load of DL + LL.
The prestressed beam gave ample warning of failure.
In service it would be very doubtful if the crack at the
centre support would be vi&ible because of the cast-in-place
purlin at this location. The crack that would be probably
first noticed occurred at DL
+
2.5 LL nr 157.1 tons, orslightly more than half of the maximurr. load applied.
Even at a load of DL + 5.5 LL there was no sign of
shear cracks at the supports. The concrete in the end zones
which was subjected to high concentration of loading under the distribution plates showed no signs of failure.
The electrical resistance strain gauges on the wires showed that eight of the eleven gauged wires were tensioned higher than the 128,000 p.s.i. stipulated in the
specifica-tions. The maximum stress recorded was 156,000 p.s.i. or
121.5 per cent greater than 128,000 p.s.i. This maximum
stress is 77 per cent of the average measured yield strength of 203,000 p.s.i. and 68 per cent of the average ultimate
tensile strength of 229,400 p.s.i. The average steel strain
after final prestressing was 5,000 micro inches per inch or
*
Design specifications for structural member in prestressedconcrete 7th Draft, Jan. 1950, by Prof. Dr. Ing.
139,000 p.s.i. This average measured stress of 139,000 p.s.i. is 68.5 per cent of the yield point stress and 60.7 per cent
of the ultimate tensile stress. The German Code specifies
that the maximum allowable tensile stress should not exceed 75 per cent of the yield point or 55 per cent of the ultimate
tensile ウセイ・ョァエィN In tte above figures a value of Es of
27.8 x 10 p.s.i. is always used.
The impact resistance properties of the beam were
demonstrated by the unexpected sudden unloading of DL + 5.5 LL
or 294.5 tons, an occurrence which the beam will never have to undergo in normal service.
Although the maximum test load applied was DL +
5.5 LL, the slope of the load deflection curve (Fig. 15) at DL + 5.25 LL indicates that the beam was very near its
ultimate failure load. The final increment of load from
DL + 5.25 LL to DL + 5.5 LL was quite difficult to apply
because constant pumping produced a large increase in
deflection but very little increase in load. Cracking was
also very far advanced at DL + 5.5 LL. At DL + 5.5 LL a
crack at the 3l-foot-6-inch section of span B had advanced
into the top flange of the beam. Based on the above
observa-tions it can be assumed that the beam couJd not have supported another 0.5 LL increment of load, making the probable ultimate
failure load from DL + 5.5 LL to DL + 6.0 LL.
ACKNOWLEDGMENTS
Much assistance hag been received by the author during
this work. It would be impossible to list all those who have
given a helpful hand in the work itself or in the form of
suggestions during discussions. Special mention, however,
must be made of the co-operation of the Hydro-Electric Power Commision of Ontario and particularly the staff of the
Structural Research Department, without whose help the work
could not have been carried out. The entire test project was
made a co-operative venture between the Division of Building Research and the Structural Research Department of the Hydro-Electric Power Commission of Ontario,
The co-operation of the following is also gratefully
acknowledged: Defence Construction Limited; Central Mortgage
and Housing Corporation; rゥ」ィ。イセ and B.A. Ryan cッュー。セケL
general contractors; the Precompression Company Limited of Montreal (The beam design calculations from Mr. PoA. Benn,
Manager, greatly assisted in the presentation of this report); and the Structures Section of the Division of Mechanical Engineerillg
of the National Research Council of Canada.
Special thanks are also expressed to Mr. E. Hoyle of the Division of Building Research who worked closely with the
Author in the processing of the test results. Gratitude is
expressed for the guidance and the many helpful suggestions from the Director of the Division, Mr. R.F. Legget and
SECTION PROPERTIES OF BEAM AT CONCRETE STRAIN GAUGE LOCATIONS
!
I
i Section Modulus
Distance From Depth of
i
Top of Beam Bottom of BeamI
Moment of iMMセCentre Line Beam
I
From Centroid From Centroidi
Inertia TOP3I
bッエエセュof Be am ( In.)
i
(
In. ) . . ( In. ) \ H⦅iョセ⦅I In .i
In .0'- 0" 60 31 29
I
226,200WSセXPP
iMMMMMMMMセヲ⦅⦅⦅⦅MMM⦅ヲ⦅MM - - - t - - - L I1'- 6"
58.4
30.05
28.35
I 203,930
6790
7190
I j - - - . - - - i - - - + - - - I - - - - . - - - + - - - + - - - + - - - l10'-10"
36.0
16.7
1 9 . 3 !
59,490 I 3560
3080
! - - - + - - - + - - - _ . _ - - - - + - - - ;28'- 0"
36.0
16.83
19.17
60,010
3570
3130
39
1-0"
36.0
17.10
18.90
60,780
3560
3220
I\) 0\TABLE 2
MAGNITUDE OF TEST LOADS Dead Load (Roof Structure)
Live Load (Snow Load)
37.4
p.s.f.40.0
p.s.f.Description of Load Dead Load of Roof
Structure
Pounds Per Square Ft.
37.4
Load Per Jack (lb. )
7,780
Total Load (tons)
42.7
Dead Load +
i
Live LoadDL + 1 LL
DL
+1.5 LL
DL +2.0
LL DL +2.5
LLDL
+ 2.75
LLDL
+3.0
LLDL
+
3.5
LLDL
+3.75
LL DL +4.0
LLDL
+4.25
LLDL
+4.5
LLDL
+4.75
LLDL
+5.0
LLDL
+5.25
LLDL
+5.50
LL57.4
77.4
97.4
117.4
137.4
147.4
157.4
177.4
187.4
197.4
207.4
217.4
227.4
237.4
247.4
257.4
11,940
16,100 .
20,260
24,420
28,580
31,660
32,740
36,900
38,980
41,060
43,140
45,220
47,300
49,380
51,460
53,540
65.7
88.6
111.4
134.3
157.1
174.1
180.1
202.9
214.4
225.8
237.3
248.7
260.1
271.6
283.0
294.5
STEEL STRAINS IN WIRES DURING TENSIONING OF BEAM
Time After
Wire Number of Wires Tensioned After Cable Cable Lifted
Number
8
16
24
32
40
48
Lifted6
hrs.14
hrs.3
5473
5499
5578
5601
5610
5608
5523
5501
5548
7
4949
4974
5018
5039
5049
5050
4999
4961
5008
11
5153
5191
5219
5219
5208
5168
5117
5168
15
5236
5285
5316
5303
5301
5270
5232
5277
19
4911
4907
4913
4897
4862
4819
4872
4695
4645
4651
ro23
4723
4735
4724
4680
0:>27
5000
4935
4916
4966
4946
4977
31
5108
5225
5214
5261
5223
5264
35
4592
4566
4657
4616
4684
37
4580
4585
4668
4614
4668
47
4801
4941
4890
4954
TABLE
4
STEEL STRAINS BEFORE AND AFTER WEDGING OF WIRES
Wire No.
Steel Strains
Prior to After
Wedging Wedging DifferenceIn Strains
3
5571
5508
-63
75091
5002
-89
11
5220
5190
-30
15
5258
5258
0
19
4964
4905
-59
23
4751
4725
-26
27
4950
4998
+48
35
4551
4583
+32
47
4751
4836
+85
LOSSES IN STEEL WIRE ELONGATIONS DUE TO WEDGING
Tabulated below are the elongations measured during the tensioning of the
forty-eight laO-foot wires. The wires are recorded in couples since wires were
tensioned two at a time.
Elongation Elongation
Before After Before After
Wire No. Wedging Wedging Loss Wire No. Wedging Wedging Loss
1
and2
'.'6-1/4
6-3/16
1/16
25
and26
6
5-3/4
1/4
3
and4
6-1/4
6
1/4
27
and28
6
5-7/8
1/9
5
and 66-5/16
6-3/16
1/8
29
and30
6
5-13/16
3/16
7
end8
6-5/16
6-1/16
1/4
31
and32
6
5- 13/16
3/16
lJJ 09
and10
6-5/16
6-1/4
1/16
33
and34
5-3/4
5- 1/2
1/4
11
and12
-
-
-
35
and36
5-7/8
5-5/8
1/4
13
and14
6-5/16
6-3/16
1/8
37
and38
6
5-11/16
5/16
15
and16
6-5/16
6-3/16
1/8
39
and40
5-3/4
5-1/2
1/4
17
and18
6-5/16
6-3/16
1/8
41
and42
6
5-15/16
1/16
19
and20
6-3/8
6-1/4
1/8
43
and44
6
5-1/2
1/2
21
and22
6-1/4
6-1/16
3/16
45
and46
5-15/16
5-7/8
1/16
23
and24
6-1/4
6-3/16
1/16
47
and48
5-3/4
5- 11/16
1/16
rrABLE 6A LOADING SCHEDULE
Load Load
Date Series Number Load
SYMMETRICAL LOADING
June 30 1 1.0 4,000 1b./pur1in
1.1 DL of roof structure (Approx.
7,780 Ib./purlin) June 30 2 2.0 4,000 1b./purlin 2.1 DL 2.3 DL + 1 LL (8,320 Ib./purlin, total 16,000 Ib./pur1in) July 1 3 3.0 4,000 Ib./pur1in 3.1 DL 3.2 DL + セ LL 3.3 DL + 1 LL July 1 4 4.1 DL 4.2 DL + セ LL 4.3 DL + 1 LL 4.4 DL + Qセ LL (Nat. Bldg. Code
Requirement) Held for 24 hours.
ASYMMETRIC LOADING Span A Span B July 2 5 5.1 DL DL 5.2 DL + セ LL DL 5.3 DL + 1 LL DL July 3 6 6.1 DL DL 6.2 DL DL + セ LL 6.3 DL DL + 1 LL SYMMETRICAL LOADING -July 3 7 7.1 DL 7.2 DL + 1.? LL 7.3 DL + 1 LL
7.4 DL + ャセ LL - Held for 28 days.
Recovery period
5
days.August 5 8 8.1 DL
8.2 DL + セ LL
8.3 DL + 1 LL
8.4 DL + ャセ LL