UNIVERSITÉ DE MONTRÉAL
OPTIMIZATION OF THE RATE AND LEVEL OF POROSITY GENERATION IN ELECTRODE FILMS FOR APPLICATION IN BATTERIES
ZOHREH MOSAFERI
DÉPARTEMENT DE GÉNIE CHIMIQUE ÉCOLE POLYTECHNIQUE DE MONTRÉAL
MÉMOIRE PRÉSENTÉ EN VUE DE L’OBTENTION DU DIPLÔME DE MAÎTRISE ÈS SCIENCES APPLIQUÉES
(GÉNIE CHIMIQUE) AVRIL 2018
ÉCOLE POLYTECHNIQUE DE MONTRÉAL
Ce mémoire intitulé :
OPTIMIZATION OF THE RATE AND LEVEL OF POROSITY GENERATION IN ELECTRODE FILMS FOR APPLICATION IN BATTERIES
présenté par: MOSAFERI Zohreh
en vue de l’obtention du diplôme de: Maîtrise ès sciences appliquées a été dûment accepté par le jury d’examen constitué de :
M. DUBOIS Charles, Ph. D., président
M. AJJI Abdellah, Ph. D., membre et directeur de recherche M. PREBE Arnaud, Ph. D., membre externe
DEDICATION
ACKNOWLEDGEMENTS
Firstly, I would like to express my gratitude to my supervisor, Prof. Abdellah Ajji, for his continuous support and guidance through my Masters’ research. I am also thankful to Dr. Arnaud Prébé for his help, suggestions and feedbacks to this work.
I would like to thank all the technical and administrative staffs of Chemical Engineering Department of Ecole Polytechnique de Montreal and Hutchinson Co. for their kind cooperation during this project, specially Ms. Claire Cerclé and Mr. Mattheiu Gauthier.
In undertaking this work, I had the honor to collaborate with the other student in Prof. Ajji’s group. I would like to specially thank my friend Ms. Zahra Kordjazi, who supported me greatly during the past two years. I would also like to thank Ms. Fatma Ben Dheib who did a favor to translate my abstract to French.
This work could not be completed without the unconditional love of my parents, Mohammad Jafar Mosaferi and Masoomeh Mosaferi. Although they were far from me in the past three years, they have always supported me and encouraged me to take steps forward in my education.
Lastly, my deepest gratitude goes to my husband, Yousef Saatchi Tabriz. His continued and unfailing love, patience and encouragement during my pursuit to master’s degree, made finishing this work possible for me.
RÉSUMÉ
Dans le but de générer de la porosité dans les électrodes poreuses des batteries Li-ion, le carbonate de propylène (PPC) a été utilisé comme phase sacrificielle. 3 catalyseurs (un générateur photo acide, un générateur d'acide thermique et un peroxyde) ont été rajoutés en faible fraction en masse à cette phase pour augmenter la vitesse de dégradation et leurs effets ont par la suite été étudiés. L'analyse thermogravimétrique (ATG) a montré que ces catalyseurs ne réduisent pas la température de décomposition du PPC.
Des composés contenant un liant, une phase sacrificielle et des ingrédients actifs ont alors été préparés par mélange à chaud et calandrés ensuite pour atteindre une épaisseur spécifique. Ces films ont été exposés à la radiation rouge pour y générer de la porosité. Trois lampes infra-rouges avec différentes longueurs d’onde ont été testées et la lampe choisie est celle avec laquelle le plus haut taux de dégradation du PPC a été obtenue. Pour l’étape suivante, le temps et la température de dégradation ont été optimisés pour chaque échantillon. Les résultats obtenus ont montré que la lampe ayant la plage de longueurs d'onde la plus longue augmente le taux de décomposition du PPC et qu'il faut moins de temps pour la génération de la porosité.
Un fois cette partie complétée, la porosité des films d’électrode a été étudiée par microscopie électronique à balayage (MEB), porosimétrie par intrusion de mercure (PIM) et par la méthode de saturation du solvant. Les résultats de la MEB ont montré que la taille des pores dans les composés ayant le graphite comme ingrédient actif est plus importante que celle des autres composés avec des ingrédients actifs différents.
La comparaison des résultats obtenus par la MEB et la PIM a montré que la caractérisation par MEB sous-estime la taille des pores et la porosité totale. La porosité totale a été déterminée également par la méthode de saturation du solvant et les résultats ont concordés avec ceux de la PIM.
ABSTRACT
For porosity generation in porous electrodes of Li-ion batteries, polypropylene carbonate (PPC) as a sacrificial phase was used. To increase degradation rate of the sacrificial phase, 3 catalysts (a photo acid generator, a thermal acid generator and a peroxide) in low weight fractions, were separately added to the PPC and their effect was studied. Thermogravimetric analysis (TGA) tests showed that none of these catalysts could decrease the decomposition temperature of PPC. Then, a compound containing a binder, a sacrificial phase and active ingredients was prepared by hot mixing. After mixing, the final compounds were calendered to reach a specific thickness. These films were exposed to infrared radiation to generate porosity in it. 3 infrared lamps with different wavelength ranges were initially used and one of them, for which the highest degradation rate of PPC was obtained, was chosen. In the next step, time and temperature of degradation for each sample was optimized for that wavelength. The results showed that the lamp with the longest wavelength range, increases the decomposition rate of PPC and less time is needed for porosity generation.
After this part was completed, porosity of electrode films was studied using scanning electron microscopy (SEM), mercury intrusion porosimetry (MIP) and solvent saturation method. The results of SEM showed that the pore size in the compounds containing graphite as active ingredient is larger than other compounds with other active ingredients.
Comparing SEM and MIP results showed that SEM underestimates the pore size and total porosity. By solvent saturation method, the total porosity was calculated and was in agreement with MIP results.
TABLE OF CONTENTS
DEDICATION ... iii
ACKNOWLEDGEMENTS ... iv
RÉSUMÉ ... v
ABSTRACT ... vi
TABLE OF CONTENTS ... vii
LIST OF TABLES ... x
LIST OF FIGURES ... xi
LIST OF SYMBOLS AND ABBREVIATIONS ... xiv
CHAPTER 1 INTRODUCTION ... 1
1.1 Problem Identification and Originality ... 2
1.2 Objectives ... 3
1.3 Dissertation Plan ... 3
CHAPTER 2 LITERATURE REVIEW ... 4
2.1 Lithium ion batteries ... 4
2.2 Porous electrode structure ... 5
2.3 Materials used in porous electrodes made by sacrificial agent decomposition... 8
2.3.1 Active fillers... 8
2.3.2 Binder ... 10
2.3.3 Sacrificial phase ... 10
2.3.3.1 Thermal degradation of polypropylene carbonate ... 11
2.4 Porosity measurement ... 14
2.4.1 Scanning Electron Microscopy ... 15
2.4.2 Mercury Intrusion Porosimetry (MIP) ... 16
CHAPTER 3 EXPERIMENTAL ... 19 3.1 Materials ... 19 3.1.1 Polymers ... 19 3.1.2 Catalysts ... 19 3.1.3 Solvents ... 19 3.1.4 Active ingredients ... 19 3.2 Methods ... 20 3.2.1 Polymer/catalyst solutions ... 20
3.2.2 Compounding and electrode film production ... 20
3.2.3 Thermogravimetric Analysis (TGA)... 21
3.2.4 Fourier transform infrared (FTIR) and UV-VIS-NIR ... 21
3.2.5 Compound decomposition via Infrared radiation heating ... 22
3.2.6 Porosity measurement ... 23
3.2.6.1 Scanning electron microscopy (SEM) ... 23
3.2.6.2 Mercury Intrusion Porosimetry (MIP) ... 23
CHAPTER 4 RESULTS AND DISCUSSION ... 24
4.1 Thermal characterization of Polymer ... 24
4.1.1 TGA of pure polycarbonates in different environments ... 24
4.1.2 Thermal degradation of HNBR ... 25
4.1.3 Catalyst effect on thermal degradation of polycarbonates ... 26
4.1.4 Energy of decomposition via Coats-Redfern method ... 27
4.1.5 Thermal degradation of primary compounds ... 31
4.2 FTIR and UV-VIS-NIR experiments for polymers and fillers ... 32
4.3 Degradation of primary compounds by Infrared radiation heating ... 34
4.5 Scanning Electron Microscopy (SEM) ... 47
4.6 Mercury Intrusion Porosimetry (MIP) ... 55
CHAPTER 5 CONCLUSIONS ... 60
RECOMMENDATIONS ... 61
LIST OF TABLES
Table 3.2-1. Technical data of Infrared lamps used for decomposition ... 22
Table 4-1. Pure and catalyst-containing polycarbonates kinetics parameters calculated using Coats-Redfern method for air and nitrogen environment ... 30
Table 4-2. Degradation temperature of final compounds ... 44
Table 4-3. Final compounds composition ... 45
Table 4-4. The summary of decomposition conditions for each final compound. ... 46
Table 4-5. Average pore size and porous area fraction of final compounds derived from SEM images ... 51
Table 4-6. Graphite sample characteristics in MIP test ... 57
Table 4-7. Porosity calculation by liquid saturation method ... 58
LIST OF FIGURES
Figure 2-1. Charge/discharge process in Li ion battery with layered structured electrodes [12] ... 5
Figure 2-2. (a) Chain unzipping reaction in PPC occurring via an alkoxide or carbonate backbiting pathway creating the cyclic propylene carbonate as the product. (b) Chain scission reaction in PPC via thermally induced cleavage of CO bonds creating carbon dioxide as one of the products. [40] ... 12
Figure 2-3. Typical structure of polypropylene carbonate, adapted from [17] ... 12
Figure 2-4. Methods for pore size and pore size distribution measurement [57] ... 14
Figure 2-5. Various pore types[60] ... 16
Figure 4-1. TGA graphs of neat PPCL and QPAC 40 ... 24
Figure 4-2. DTGA curves of PPCL and QPAC 40 under air ... 25
Figure 4-3. TGA curves of PPCL under air with different catalysts ... 26
Figure 4-4. TGA curves of QPAC under air with different catalysts ... 27
Figure 4-5. Effect of active ingredients on onset temperature of PPC/HNBR compounds ... 31
Figure 4-6 .FTIR curves of PPCL and QPAC ... 32
Figure 4-7. Spectral radiation curves for different infrared emitters, normalized to the same power (right), absorption of infrared for some polymers (left) ... 33
Figure 4-8. Absorption curve of PPCL and QPAC by UV-VIS-NIR ... 34
Figure 4-9. Sample temperature captured by FLIR camera (right) and the way sample is placed under the IR lamp (left)... 34
Figure 4-10. Comparison of three lamps for 100 μm film of compounds containing 20 vol% CLTO ... 36
Figure 4-11. Comparison of three lamps for 100 μm film of compounds containing 20 vol% Graphite... 37
Figure 4-12. Comparison of three lamps for 100 μm film of compounds containing 20 vol% LFP ... 38 Figure 4-13. Comparison of three lamps for 100 μm film of compounds containing 20 vol% LTO ... 39 Figure 4-14. Isothermal degradation of compound containing 20vol% of CLTO at two thickness and different temperatures ... 40 Figure 4-15. Isothermal degradation of compound containing 20vol% of LTO at two thickness and different temperatures ... 41 Figure 4-16. Isothermal degradation of compound containing 20vol% of LFP at two thickness and different temperatures ... 42 Figure 4-17. Isothermal degradation of compound containing 20vol% of graphite at two thickness and different temperatures ... 42 Figure 4-18. SEM micrograph of G1 film surface (left) and definition of porous area by MIPAR for calculating pore size and distribution (right)... 48 Figure 4-19. SEM micrograph of LFP1 surface (right) and cross section (left) ... 49 Figure 4-20. SEM micrograph of G1 (Graphite compound) surface (right) and cross section (left) ... 49 Figure 4-21. SEM micrograph of G2 (Graphite compound) surface (right) and cross section (left) ... 49 Figure 4-22. SEM micrograph of G3 (Graphite compound) surface (right) and cross section (left) ... 50 Figure 4-23. SEM micrograph of G4 (Graphite compound) surface (right) and cross section (left) ... 50 Figure 4-24. SEM micrograph of LFP2 surface (right) and cross section (left) ... 50 Figure 4-25. Pore size distribution of G1 measured by SEM. Surface (right) and cross section (left) ... 52
Figure 4-26. Pore size distribution of G2 measured by SEM. Surface (right) and cross section (left) ... 52 Figure 4-27. Pore size distribution of G3 measured by SEM. Surface (right) and cross section (left) ... 53 Figure 4-28. Pore size distribution of G4 measured by SEM. Surface (right) and cross section (left) ... 53 Figure 4-29. Pore size distribution of LFP1 measured by SEM. Surface (right) and cross section (left)... 54 Figure 4-30. Pore size distribution of LFP2 measured by SEM. Surface (right) and cross section (left)... 54 Figure 4-31. Pore size distribution of LTO measured by SEM. Surface (right) and cross section (left)... 55 Figure 4-32. Pore size distribution of G1 and G2, measured by MIP ... 57
LIST OF SYMBOLS AND ABBREVIATIONS
MEB Microscopie électronique à balayage PIM Porosimétrie par intrusion de mercure ATG Analyse thermogravimétrique PPC Polypropylene carbonate
PPCL Liquid Polypropylene carbonate HNBR Hydrogenated nitrile butadiene rubber EPDM Ethylene propylene diene monomer rubber TPE Thermoplastic elastomer
Li-ion Lithium ion
PAG Photo acid generator TAG Thermal acid generator TGA Thermogravimetric analysis
MEB Microscopie électronique à balayage SEM Scanning electron microscopy MIP Mercury intrusion porosimetry CNT Carbon nanotube
PDMS Poly(dimethylsiloxane) PMMA Poly (methyl methacrylate)
HNBR Hydrogenated nitrile butadiene rubber EPDM Ethylene propylene diene monomer rubber TPE Thermoplastic elstomer
FTIR Fourier Transform Infrared UV Ultraviolet
UV-VIS-NIR Ultraviolet visible near infrared LFP Lithium iron phosphate
LTO Lithium titanate
CLTO Carbon coated lithium titanate ΔP Pressure difference
r1, r2 Geometric parameters of pores
μm Microns min Minute
τeq Characteristic diffusion time
D Diffusion coefficient
L Characteristic diffusion length Nm Nanometer
CHAPTER 1
INTRODUCTION
Growing use of renewable energies in transport applications and communication made rechargeable lithium ion batteries in very high demand [1]. The main chemical reaction in these batteries is called charge/discharge reaction and consists in intercalation/deintercalation of Li-ion on the electrodes and it is a reversible process [2, 3]. In the applications such as electric vehicles, shorter recharging times are needed in order to grow the market [4]. Although Li-ion batteries have very high energy densities, their diffusion rate is very low. By enhancing the structure of the electrodes, this problem can be solved. Shorter diffusion length in the electrodes will make their characteristic diffusion time shorter. To achieve a high diffusion rate Li-ion battery, porous electrodes, with large contact area, can be used [5-7]. The porous compounds as electrodes have a continuous structure of pores and active fillers and can significantly reduce the diffusion time [4]. Several studies have been made to make porous electrode materials [8]. The first method is the extraction of one phase from the compound [8, 9]. The problem associated with this method is the usage of organic solvent to dissolve the components. In fact, these organic solvents are hazardous to environment, toxic and flammable. Porosity control in this method during solvent evaporation is difficult and it puts a limit for active fillers[10].
Hard templating is also offered to produce porous electrodes. A thermosetting resin combined with active fillers is injected to a mold and baked. The major drawback of this method is the non-transformability of the electrode after baking and high baking times needed for precursor resin [4, 7, 11].
Hutchinson company offered melt mixing of the ingredients with a sacrificial phase available in the compound and thermal decomposition of sacrificial phase after compounding. This method does not need using any solvent and has lower environmental risks [7, 10].
The problem associated with this technique is the high energy and time that is needed for decomposition of sacrificial phase. The proposed material for sacrificial phase is polypropylene carbonate for its low degradation temperature. The electrodes with thicknesses of about 50 μm to 200 μm need to stay in a conventional oven about 20 to 45 min at 230℃ to 240℃. The
decomposition temperature and time depend on the final composition and the active fillers used in the compound [10].
The main objective of this study is to reduce degradation time of polypropylene carbonate (PPC) that is used as sacrificial phase in the process of producing porous electrode and quantifying porosity in the electrode.
In this study, a literature review is first presented in Chapter 2 on Li-ion batteries structure, different methods of porosity generation in electrodes, degradation behavior of PPC and porosity measurement techniques. Then, the experimental work, results, discussion and conclusions are presented in the following chapters.
The first part of the experimental work was to study the PPC degradation behavior under different environments and combined with different catalysts using thermogravimetric analysis (TGA). Then, compounds of binders, active fillers and sacrificial phase were prepared by melt mixing to see the effect of each active fillers on the decomposition of PPC and also perform degradation studies under infrared lamps to study its effectiveness on decomposition time. At the end of this work, porosity measurements were performed using imaging techniques, mercury intrusion porosimetry and liquid saturation technique.
1.1 Problem Identification and Originality
As it was briefly discussed in the previous part, porosity generation in electrodes could cause environmental damage and safety issues. To reduce these problems, which are caused mostly by solvent in the porosity generation, Hutchinson Co. offered using thermal degradation of a sacrificial phase for porosity generation [7]. In their method, conventional ovens are used, which need high levels of temperature and energy. The degradation of PPC in these ovens is also very time consuming. High energy and duration of degradation makes the cost of this process high. To reduce the costs and energy use in this method, lowering the degradation temperature of PPC as sacrificial phase and using other techniques for heat application to the electrodes are desired. The originality of this study is the optimization of time and temperature in which degradation of sacrificial phase is completed. In this study, the effect of using infrared lamps, as the heating media, instead of conventional ovens for PPC decomposition is studied. On the other part, the effect of
three different catalysts on the degradation behavior of PPC is studied to see whether they can reduce degradation temperature of PPC.
1.2 Objectives
1.2.1 GENERAL OBJECTIVE
This study is aimed to accelerate the porosity generation rate in electrodes for Li-ion batteries by optimizing time and temperature in which degradation of a sacrificial phase occurs.
1.2.2 SPECIFIC OBJECTIVES
Addition of several catalysts separately to the sacrificial phase to study their effectiveness on lowering degradation temperature. If they were effective, they will be added in the final compound formulation.
Degradation of electrodes under infrared lamps with varying time and temperature to choose the optimum point. Infrared lamps with different wavelength range will be tried.
Porosity measurement of final porous electrodes using different laboratory techniques.
1.3 Dissertation Plan
In Chapter 2, a literature review is presented. Starting with Li-ion batteries and its elements and continuing with the properties of porous electrodes. After studying benefits of porous electrodes, different methods are reviewed for porosity generation. The method that is going to be discussed is introduced and at the end, theories of porosity measurements are also reviewed.
In Chapter 3, materials, methods and experiments that were used in this work are introduced. Results of the tests are presented and discussed in Chapter 4 and the final conclusion with the recommendation for future works are presented in Chapter 5.
CHAPTER 2
LITERATURE REVIEW
2.1 Lithium ion batteries
Rechargeable Lithium ion battery is the leading energy storage device with applications in communication devices such as cell phones and tablets, transport and renewable energy sources[1]. The major advantage of this type of batteries is their high energy density and cycling performance. It was first produced by Asahi co. in Japan and commercialized by Sony in 1991. The benefits of Li-Ion batteries such as high energy-density, no memory effect (as opposed to Nickel cadmium (Ni-Cd) or nickel-hydride (Ni–MH) batteries), high efficiency and long life made it acceptable rapidly[12, 13].
Batteries in general consist of one or several electrochemical cells which provide power to electronic devices. In their structure, electrolyte may be in the form of a liquid or solid. For gas or liquid electrodes, solid electrolytes are used. However, they can also be used with solid electrodes too, but the interface between two solids may cause some problems unless the electrolyte is made of polymers or electrodes are thin. In the case of liquid electrolytes, solid electrodes are prevented from contact with a separator which is electrolyte permeable. The role of electrolyte is to transfer ions form one electrode to another and to make a reversible circuit of ions [2]. In the charging process, Li ions are deintercalated from cathode and are inserted on anode layers. Decharging process is the reverse of charging reaction[3].
Two electrodes, anode and cathode, and a separator called the electrolyte are the constituents of an electrochemical cell. The electrodes are made of active particles, generally with a layered structure, in micron scale and a binder which keep them together. Usually a conductive component is also needed for having a higher electrical conductivity[4]. Electrical energy in batteries is developed by conversion of chemical energy in redox reactions between two electrodes. In this reaction, anode will be oxidized and cathode will be reduced. Since lower redox potential reaction occurs in anode in comparison to cathode, anode is considered as negative pole and cathode as positive one [14]. The exchange of Li ion during charging and discharging between two electrodes is called intercalation. This process is also called inserting a guest into a layered host. In the case of Li-ion batteries, Li-ion is the guest and electrodes are the hosts [15]. The generated voltage in Li-ion battery depends on the difference of active particles’ potential in in cathode and anode and
it value can vary and go up to 3.8V. Using materials with higher potential will result in higher voltage in the battery [12]. Figure 2-1 shows the charge-discharge process in Li-ion batteries.
Figure 2-1. Charge/discharge process in Li ion battery with layered structured electrodes [12]
In the positive electrode of Li-ion batteries, compounds for intercalation are used in the form of LixMyXz, in which X can be oxygen or a polyanionic compound or complex[10]. To obtain an
acceptable output voltage, a metal ion (My) with a high redox potential should be chosen. In the
intercalation compound, a large number of Li ions should have the ability to reversibly intercalate and deintercalated. Therefore, higher value of x is required. In this process, no change in the
structure of compounds should occur. Chemical stability to avoid reaction with electrolyte is an important characteristic for intercalation compound. To have a decent charge/discharge rate, high diffusion coefficient of Li ion in cathode is expected [15].
In the negative electrode, or anode, most investigated materials are graphitic and amorphous carbon materials for their high reversible capacity and low cost [16]. Contrary to cathode, anode materials should have a low redox potential for inserting Li ions into them [15].
2.2 Porous electrode structure
Growing use in applications such as electric vehicles or plug-in hybrid electric vehicles requires electrical storage devices with higher specific capacities and faster rate performance [5]. In these applications, by having a shorter time for recharging vehicles, consumers would more easily accept the usage of these technologies. Also, in renewable energy resources, wind and solar energy for
instance which are seasonal, energy densities and rate of performance should be improved for having higher charge storing [4].
One way to make the high-power requirements possible is to use capacitors and supercapacitors. In comparison to batteries, they are able to take up charge at a more rapid rate. Although, in capacitors, charge storage only occurs on the electrode surface, which allows rapid charging but low energy density. In batteries, charge storage is in the bulk, therefore supplying higher energy density. Downside of using batteries is their rate of charge delivery, which is bound by diffusion of Li ion through the bulk. To fix the low diffusion rate in batteries, the electrodes’ structures are improved. Lithium ions have a characteristic diffusion time (τeq) to pass through the electrodes,
which is related to the square of characteristic diffusion length (τeq~l2/D). D in this equation is the
diffusion coefficient [5, 6]. To have a shorter diffusion time, either diffusion coefficient by improving Li ion conductor should be increased or diffusion length should be shortened. To prevent any chemical changes in the structure, the second route is preferred. Furthermore, diffusion length has a greater effect on the diffusion time for its square relationship. Therefore, it is an attractive research area in recent years [5-7]. A practical way for obtaining short diffusion time is to use porous materials for electrodes. These materials provide a wide range of advantages. First, they offer a larger contact area and a better access to electrolytes, which makes charge transfer easier. On the other hand, active fillers’ walls enclosing pores could be very thin and reduce the required diffusion length. A continuous structure between pores and fillers can be reached, which can reduce diffusion time. Furthermore, a porous composite with an added conductive phase can be made to enhance conductivity of the active phase.
Classification of porous materials could be based on their pore sizes, which is in 3 classes. First, micropores which are less than 2 nm, then mesopores that have a size between 2-50 nm and macropores that are bigger than 50 nm. Other methods of classification are based on their synthesis procedure (templating and non-templating) and type of porosity which can be “textural” (voids generated between the particles) and “true” or “integral” which is the type of pore that is an integral part of a solid. In textural porosity, pore size is related to particle size, whereas is integral porosity particle size has no effect of pore size [4].
Conventional electrodes, which are made by drying or casting a slurry consist of binder, active material and conductive particles, usually have textural porosity [4]. Intensive research has been
made on making porous electrode materials by extracting one phase. In a research made by H. Lee et. Al. [8], polydimethylsiloxane (PDMS)/carbon nanotube (CNT) porous composite was made through the following procedure. First PDMS with polymethylmethacrylate (PMMA) and PDMS-b-PMMA were dissolved in toluene at 75℃. After complete dissolution, toluene was removed and CNT was mixed with the solution. Since CNT prefersmixing with PDMS, by extracting PMMA with acetic acid, porous structure will be achieved [8]. In another study, a dry mixture of lithium nickel manganese cobalt oxide as active ingredient and carbon black as conducting agent, were mixed with a polyvinylidene difluoride binder dissolved in N-methyl-2-pyrrolidone. The slurries were applied on an aluminum foil and then dried at 80℃ and 120℃, each for 5 min [9]. This experiment was performed to see the effect of dry-mixing of powders before preparing the electrode.
In each of the above-mentioned experiments, an organic solvent was used to dissolve the components. For porosity generation, a drying step is included in their process. This type of process has many drawbacks such as environmental hazard and safety issues due to usage of organic solvents, as they can be toxic and flammable [7]. On the other hand, porosity control during drying of solvent can be problematic and in general, each solvent has a limit for additives in formulation. Another method of templating electrodes is hard templating, which can be used for solid porous electrodes, anodic aluminum oxide and assemblies of colloidal particles such as silica-based or polymer-based colloidal crystals. In this method, large amount of active material combined with a precursor thermosetting resin, is injected to a mold and is baked [4, 7, 11]. The problem with this method is the non-transformability of electrode after the resin is baked and the long time that is needed for baking reaction of resin and forming crosslinks in the material. On the other hand, viscosity of the precursor resin is an essential factor in the flow of the paste through the inter-grain porosity. Therefore, high molecular weight resins, due to their low flowability and high viscosity, cannot be used in this method [10].
It is also possible to make magnetic compounds by continuous melt processing such as extrusion or internal mixing, which are used for thermoplastic polymers. The amount of active filler which can be reached greatly depends on its type. In these types of processes, high viscosity and abrasion of binder by inorganic filler is inevitable. In this method, only highly dense materials without any control on porosity can be made. To increase compatibility of active fillers with the binder, fillers’
surface should be functionalized. This step will greatly increase the cost of the process and is the its most considerable disadvantage.
Hutchinson Co. offered a new method in their invention that avoids using solvents both for its environmental hazards and also low limits for active fillers as well as making the use of active fillers without the need to add functionality possible [7]. They proposed using melt mixing of all ingredients with keeping sacrificial phase weight fraction higher than 15%. This way, viscosity and fluidity of it can be controlled. The resulting high filler polymeric compound has magnetic properties which makes it suitable for electrodes of Li-ion or sodium ion batteries and supercapacitors. Porosity of this compound, based on its application, can be controlled.[10]. This melt-mixing process has different steps. First, binder, active material and sacrificial phase are hot-mixed. In this step, the sacrificial phase content should be in the range of 20-80 wt%. Active filler content can go up to 80 wt% or 60 vol%. The high amount of active filler, allows having very high content of filler after removing sacrificial phase, without any need for surface modification or coupling agent. Porosity of the compound, size and morphology of the pores can be controlled by changing the sacrificial phase content. The melt-mixing process can be performed in an internal mixer or extruder. The obtained morphology is a co-continuous morphology of binder phase in sacrificial phase. By thermal decomposition of sacrificial polymeric phase, it can be easily extracted without having any effect on other components. If sacrificial polymer is compatible with the final application, decomposition could be carried out partially, otherwise full decomposition of sacrificial phase is expected. Thermal decomposition temperature of sacrificial phase should be at least 20℃ less than binder. To accelerate decomposition of sacrificial phase, catalysts such as photo acid generators could be used [10, 17]. Thermal decomposition could be carried out in conventional ovens or under infrared emitters. In this study, only IR emitters are going to be studied. In the next session, the materials that can be used in this process are thoroughly discussed.
2.3 Materials used in porous electrodes made by sacrificial agent
decomposition
2.3.1 Active fillers
Essentially, all inorganic active fillers with the characteristics mentioned in section2.1 can be used in the structure of electrodes. LiFePO4 (LFP), Li4Ti5O12 (LTO), carbonated LTO, LiCoO2,
LiMnO4, or LiNi1/3Mn1/3Co1/3O4 could be used in cathodes and graphite or any porous carbon
fillers could be used in anodes [10]. Electroconductive fillers such as carbon black, graphene, carbon nanotubes or nanofillers could be added making the whole system conductive [10]. Some of the abovementioned fillers are discussed here.
LFP is one of the important active fillers used in Li-ion batteries [10, 18-20]. It is a filler with low-cost, low-toxicity and high capacity. Its only drawback is low electrical conductivity that can be resolved with carbon-coating [18, 21], metal doping [22] and particle size reduction [23]. Its capacity is 160 mAh/g [12]. It has a very low Li ion diffusivity and electrical conductivity at room temperature (10-9 S/cm at room temperature) but strong stability up to 400℃ [24].
LTO and carbon coated LTO are two choices for an active filler suitable for anode in Li-ion batteries[25-28]. LTO is a thermodynamically stable compound with low cost that can generate 1.5 V in the battery. Low ion diffusivity and low electrical conductivity of this powder is the disadvantages it has, which carbon-coating LTO, the problems of its low conductivity can be solved and CLTO will be produced [27].
Graphite is a layered compound, in which lithium intercalation can occur and is considered as anode material for Li ion batteries [29]. It is usually defined by a pile of carbon sheet, with the bonds of carbon which are hexagonally shaped and the sheets are connecting with Van der Waals forces. The bonds between each two carbons, with shared sp2 hybridized bond, in the same sheet
is much stronger than the bonds between two sheets. This difference in the forces makes graphite structure appropriate for Li ion to locatebetween the sheets. The storage capacity of Li ions in graphite is 372 mAh/gr [30]. It is the main material which is used for anodes in li-ion batteries for its low cost, possibility of modification and good potential [31]. Very low potential of lithium insertion on graphite anode, makes reduction of all the other active ingredients with the ability of reverse Li intercalation with graphite possible [32]. Additionally, the expansion of graphite, while Li ion is inserted on it, is very low and is the reason that the charge capacity of graphite is not affected by charge-discharge cycles [30]. The major advantage of graphite is its efficiency during repeating cycles and its drawback is its relatively low storage capacity [30].
Some metals such as Aluminum or Antimony have very high lithium storage capacity. The storage mechanism of these compounds is different from graphite and is by forming alloys with lithium. This makes their capacity much higher than graphite (993 mAh/gr for LiAl and 536 mAh for
Li3Sb), since for insertion of Li ion in graphite 6 carbon atoms are needed but, for instance, one
Aluminum atom can bond with 2-4 Li atoms. Although, this mechanism is the reason for higher expansion of alloys in comparison to graphite and can make anode structure to collapse [30, 33, 34]. This process is known as pulverization and is the primary reason for not using metal alloys as an anode in Li ion batteries, considering its fading capacity during several charge-discharge cycles [30].
Carbon nanotubes are a good candidate for anode in lithium anode batteries as a result of their exceptional tubular structure, very high conductivity and good mechanical properties [30, 35-37]. The storage capacity of CNT can go up to 600 mAh/gr which is much higher than graphite. Also, some chemical treatments can be done on CNT that can increase their capacity up to 1000 mAh/gr. In contrast with Li-metal alloys, higher capacity in CNT would not make pulverization in them. By compounding them with metal compounds, even higher capacities could be reached [30, 38]. The main drawback of CNT is that in the first charging cycle, some lithium ions are irreversibly inserted on the walls of CNT. This process makes their capacity fading through several cycles [30].
2.3.2 Binder
To keep the composition cohesive after melt process, a polymeric binder should be added.Binder or matrix phase should be one or more crosslinked or non-crosslinked elastomer with the weight fraction between 1% and 12%. The preferred binders are from the group of hydrogenated butadiene/acrylonitrile rubber, ethylene/acrylate copolymers, polyisoprenes and the mixtures of these materials. Thermoplastic elastomers are the other option for binder. The most important characteristic of the binder is to keep its elastic properties in the range of -20℃ to 80℃. Additives for crosslinking of the binder, such as peroxide catalysts, could be added [10].
2.3.3 Sacrificial phase
The polymers suggested to be used as a sacrificial phase can be in the group of polyalkene carbonates and most possibly polypropylene carbonates or polyethylene carbonates. In the case of this research, two grades of polypropylene carbonates were used [10]. Polycarbonate and specifically polypropylene carbonates are a group of polymers with low degradation temperature, which makes them appropriate for playing sacrificial phase role in various compounds and
applications. Beside from their application in porous electrodes, polypropylene carbonates can be used in manufacturing microelectromechanical applications and microfluids [17, 39].
2.3.3.1
Thermal degradation of polypropylene carbonate
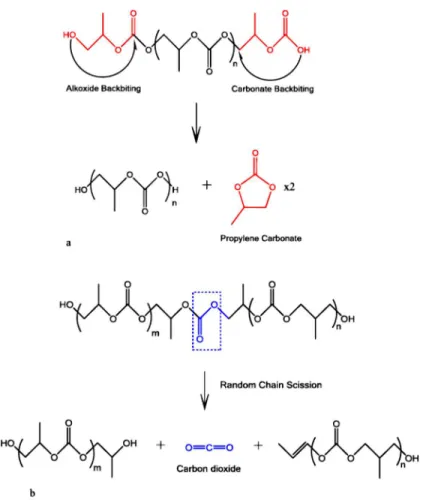
Full degradation of polypropylene carbonate occurs between 200℃ and 300℃ [39]. The degradation mechanism of polypropylene carbonate greatly depends on its environment. In the inert environments, decomposition starts by chain unzipping into cyclic propylene carbonate at around 180℃ and continues by random chain scission at higher temperature of about 250℃. Chain unzipping is the process in which active chain ends, resulted by thermal energy, attack a carbon site in the backbone of the polymer and start degradation. The main product of chain unzipping is cyclic propylene carbonate. Chain scission activation energy is much higher that chain unzipping and it is not affected by chain ends. In this reaction, very high thermal energy randomly splits a C-O bond from the backbone and produces carbon dioxide and acetone [40]. In addition, the mechanism of decomposition depends on decomposition atmosphere, polymer molecular weight, ether linkages available in the backbone, and backbone regiostructure [17]. Figure 2-2 shows the mechanism of chain unzipping and chain scission.
Figure 2-2. (a) Chain unzipping reaction in PPC occurring via an alkoxide or carbonate backbiting pathway creating the cyclic propylene carbonate as the product. (b) Chain scission reaction in PPC via
thermally induced cleavage of CO bonds creating carbon dioxide as one of the products. [40]
Polypropylene carbonate is usually produced by copolymerization of propylene carbonate and carbon dioxide at high pressures with a catalyst. The main component of the backbone is propylene carbonate. The molecular weight of this product can go up to 105 g/mol [17, 41]. There might be
ether linkages available in the backbone which are unwanted by-products in the polymerization. The concentration of ether links is usually less than 10 mol percent. Figure 2-3 shows the backbone structure of a typical polypropylene carbonate chain.
Based on the catalyst used and polymerization conditions, the backbone structure might change and this greatly influence thermal and mechanical properties of the polymer. The possible structures are head to head (HH), head to tail (HT) and tail to tail (TT). The HH and TT structures coexist together and it is not possible to have a PPC only with one of these two structures. On the other hand, HT configuration is the only type that can exist without any other configuration [17]. The effect of these configurations on polymer characteristics such as glass transition temperature and tensile strength has been studied elsewhere [42-45]. The mechanism of decomposition for PPC in influenced by its molecular weight, ether linkages in the backbone, the decomposition environment and backbone structure. Inert environment promotes chain unzipping whereas in oxygenated environment, chain scission is the main mechanism of decomposition [46]. A combustion reaction due to the presence of oxygen in oxygenated atmosphere makes decomposition faster in air [46]. Regiostructure of the backbones could affect decomposition too. The most common form for decomposition of HT structured backbones is chain unzipping into cyclic propylene carbonate which mostly occurs via either carbonate or alcoxide backbiting. HH and TT regiostructures prevent unzipping mechanism but can go through side-group rearrangement to allow unzipping to proceed. This process takes place at a slightly lower rate [17, 47, 48].
Different techniques were used to improve thermal stability of PPC. Some researchers suggested blending PPC with organic or inorganic fillers or other polymers [49-51]. In other studies, polymerization of the backbone with other component or end-capping of carbonate groups were suggested [52, 53]. Since the focus of this study is to accelerate degradation of polypropylene carbonate, none of these methods are going to be discussed here.
On the other hand, several studies have been performed in order to accelerate degradation of PPC and lower its degradation temperature [17, 54]. By adding photosensitive additive to PPC and exposing the mixture to UV light, thermal stability of the polymer will be reduced [54]. Photo-acid generators (PAG), such as diphenyliodonium or triphenylsulphonium salts, make PPC UV-sensitive and could lower its decomposition temperature. PAG will be decomposed to an organic cation and make a strong Bronsted acid. This acid can attack the backbone of PPC and accelerate its degradation [54]. Polycarbonates are acid sensitive and their degradation in the presence of acid
could occur faster [55]. Other components known as thermal acid generators (TAG), which are activated by heat, could be added to PPC for its catalytic effect on degradation. The mechanism would be the same as PAG [55]. It should be considered that for very low concentrations of acid generators, gas bubbles will nucleate and grow in the polymer when the film is UV exposed. These bubbles make polymer foams and will expand the volume of polymer. In making electrodes, bubble forming should be inhibited[17].
2.4 Porosity measurement
The void space present in the solids is described as porosity, which is a morphological characteristic that is independent of the material [56]. Several methods, based on pore size, could be used for porosity measurement. The following graph (figure 2-4) shows different type of porosity measurement methods.
Figure 2-4. Methods for pore size and pore size distribution measurement [57]
Imaging methods such as optical light microscopy, scanning electron microscopy (SEM) with energy dispersive X-ray spectroscopy (EDX), field emission scanning electron microscopy (FESEM) and transmission electron microscopy (TEM) are some of the useful techniques for understanding porosity nature. The abovementioned techniques are 2-dimensional imaging systems. 3-dimensional analysis techniques including atomic force microscopy (AFM) and nuclear
magnetic resonance (NMR) are also available for porosity measurement. Imaging methods coupled with computer image processing softwares, such as ImageJ or MIPAR, will provide a wide range of information. Pore size distribution, pore shape and size are among the characteristics that can be obtained by 2D imaging methods [57]. Among these techniques, SEM will be discussed and used in this study.
2.4.1 Scanning Electron Microscopy
Dimension, shape and size of the pores in porous materials can be obtained by image analysis coupled with SEM. Image analysis softwares use mathematical morphology algorithm to create a pore size distribution for a sample. The most important parts in image analysis are correct preparation of the sample and its scanning process, enhancing the image and pixel analysis [57, 58]. The major step in image analysis operation is to achieve a porosity threshold image for the precise measurement of porosity [57]. In MIPAR software, five different methods for choosing threshold exist: basic threshold, range threshold, adaptive threshold, E-M threshold and local threshold. In basic threshold, pixels are selected based on a comparison between their value and a certain pixel value. In range threshold, pixels are chosen if they are in a specific range of pixel values. In this method a minimum and a maximum should be specified. Adaptive threshold chooses pixels based on their relative intensity to the other pixels in their surroundings. Pixels in E-M threshold are chosen whether they are in a region in which neither of its pixels have fallen below a threshold pixel value distance from the nearest local maximum. Local threshold needs a B/W Companion image and select pixels based on the defined criteria for that image [59]. Porosity measurement by SEM in affected by different factors. Porosity threshold, pore shape and a small region selection could affect the calculations. The preparation of specimen could be effective in the results. If the samples are not conductive, they should be coated with an electrically conductive material with a very thin thickness. If not, during scan, sample with be charged and change the direction of electron beam. The main benefit of using SEM in comparison to optical microscopy is the high magnification that it would reach. But it is usually accompanied with an underestimation of the pore size since it can only detect the pores on the surface and not the whole pore volume [57].
2.4.2 Mercury Intrusion Porosimetry (MIP)
MIP is a porosimetry method which can detect pores in the size range of 3.5 nm to 500 μm. With this technique, pore size distribution, total porosity and the bulk and apparent density could be measured. It should be noted that this technique only provides the largest entrance of the pores and the inner pore size cannot be measured. The following figure 2-5 shows different type of pores. Since there could be no entrance to the closed pores, they also cannot be measured by MIP [60].
Figure 2-5. Various pore types[60]
The main hypothesis that is used in MIP is that the pore shape has cylindrical geometry. The pore size is governed by Washburn equation which is as follows:
𝑃 = 𝛾 1 𝑟 + 1 𝑟 = 2𝛾 cos 𝜃 𝑟
In which, 𝑃 is the pressure difference between in the curved mercury interface by characteristics of r1 and r2. r1 andr2 are geometrical parameters that are indicative of curvature of the interface.
are the γ and cosθ are mercury surface tension and the contact angle between mercury and the sample, respectively. Typical value for γ is 485 mJ/m2 and for θ is 140° [61]. By having these
values, pore size can be measured. However, this equation only gives an estimation of the pore size and pore shape, in reality it could be entirely different from cylindrical pore shape [60]. Since porous materials could easily absorb water or any other chemicals, evacuation of sample is needed before doing the test. Some errors in pore size measurement could occur due to the intrusion of mercury between sample films or inter-particle area of sample granules.
The main procedure for MIP measurements includes two steps. After cell evacuation in order to remove air pockets from sample, the cell is filled with mercury under reduced pressure. By gradual
increase of pressure, the biggest pores or the inter-particle area will be filled. Starting at around 3000 Pa, pore size data is captured. However, lower pressures could be used for starting measurement but it should be taken into consideration that a cylinder with 1 cm height would sense 1333 Pa from the mercury weight. Therefore a sample in a cylindrical cell with 1 cm height will have a pressure difference of 1333 Pa only because of the mercury weight [60]. Pressure in low pressure filling could reach to several atmospheres. Then, by applying isostatic pressure to the sample, total pressure can go up to 414 MPa [56]. The pressures are related to the intruded volume of the sample and pore size and volume can be calculated. Density of the material could also be calculated with MIP with rough estimation (2 to 5%). Pore size distribution of sample is one of the important data that could be derived from MIP. Typically, larger pores are related to inter-particle voids of material and smaller ones are the porous sections inside sample [60].
Although MIP could result in a vast range of data related to material porosity, it is a highly expensive test and very toxic [56]. That is why other imaging techniques test would be preferable to MIP.
2.4.3 Techniques for total porosity measurement
Other simpler techniques are available to measure total porosity of the sample. Gravimetry is a method that results in total porosity, without giving any specific data about pore size and pore size distribution and is measured by the following equation[62]:
Equation 2-1
𝛱 = 1 − 𝜌
𝜌
In this Equation 2-1 porous material is the porous electrode and the non-porous material in the base compound for electrode before degradation. For calculation of the volume, length, width and thickness of the sample film will be measured and by dividing mass weight to volume, density of each sample will be calculated.
Liquid displacement method is another technique for porosity measurement. By choosing a proper solvent, that has a reasonable wetting ability to penetrate to the pores, this test can be done. In fact, sample will be immerged in a cylinder filled with a liquid and the volume change in solvent can
be calculated. The volume of the liquid absorbed can be related to the total porosity in the sample [56].
Another method for porosity measurement by highly wetting solvent is called liquid saturation method. With this technique, the porous material is immersed in the liquid. The difference between the weight of dry and wet sample is indicative of porous part of the material. By converting the mass of the solvent to volume, total porosity of the sample will be calculated which in equal to total volume of the solvent divided by volume of the sample. This method basically follows Archimedes principle [63].
CHAPTER 3
EXPERIMENTAL
The experiments were performed in different stages. First, the decomposition in presence of catalysts in small amounts was studied. Then compounding with active ingredients and decomposition under Infrared lamps were performed.
3.1 Materials
3.1.1Polymers
Sacrificial agents in this study are two polypropylene carbonates, QPAC 40 in pellet form by Empower materials and Converge polyol 212, which is a liquid oligomer, by Novomer company. Molecular weight of QPAC 40 is between 100000 and 300000 g/mol and that for Polyol 212 is about 1000 g/mol. They were both received from Hutchinson company and used as they were. For matrix, two hydrogenated acrylonitrile butadiene elastomers were chosen, Zetpol 2010 with 35 to 37% of acrylonitrile and Zetpol 0020 with 50% acrylonitrile content by Zeon Chemicals L.P., which were used as received.
3.1.2
Catalysts
3 different catalysts were used to study their effect on decomposition temperature. Luperox®
101XL45 (2,5-Bis(tert-butylperoxy)-2,5-dimethylhexane) (peroxide),
2,4,5-trichloronbenzenesulfonic acid potassium salt (thermal acid generator or TAG) and Diphenyliodonium hexafluorophosphate (photo acid generator or PAG) by Sigma-Aldrich.
3.1.3 Solvents
To study the effect of catalysts on polymers separately, the various ingredients were mixed at different weight percentages in solvents. Anisole or methoxybenzene by Sigma was the primary choice for solvent which is mentioned in references [54]. For better solubility, THF, also by Sigma, was used.
3.1.4 Active
ingredients
Active ingredients in a lithium ion battery electrode can make insertion/disinsertion of lithium reversible within the electrode. Very high percentages of these materials are added to have higher
capacities [7]. They are all in the form of powder. All active ingredients were received from Hutchinson Company and used as received. Graphite is the main ingredient for anodes and the type which was used in this study was graphite AGP-6 by BTR new energy materials INC. The other active ingredients for anode are Lithium titanium oxide (LTO) and carbonated lithium titanium oxide (CLTO) which were obtained by John Matthey. The last active material, which is used in cathode is lithium iron phosphate (II) (LFP) which was provided by Sigma.
To make electrodes conductive and to have good mechanical properties, Carbon black was added [7]. The grade used in this study was SUPER C65 by TIMCAL.
3.2 Methods
3.2.1 Polymer/catalyst solutions
To observe the effect of catalysts on polycarbonate degradation, they were dissolved in a solvent with polymers. Catalysts were added between 1 to 3 weight% to polymers in a 20 wt% solution of polymer/catalyst in solvents. For better solubility, the mixture was put in a sonicator for 1 hour. After dissolution, a film was made and left in air for 24 hours to dry the solvent.
3.2.2 Compounding and electrode film production
To study the effect of catalysts on polycarbonate/HNBR compounds at the same time, a masterbatch with a composition of 6wt% HNBR, 33wt% QPAC 40 (PPC solid) and 61wt% Novomer 212 (PPC Liquid) was prepared in a 200 ml Brabender mixer. First, PPC solid and HNBR were mixed at 60℃ and 50 rpm. Since PPC liquid is a very viscous liquid and adding all of it at the same time might not give a homogenous result, it was added gradually to the mixture. By increasing the amount of PPC liquid, glass transition of the compound decreased. To avoid adhesive behavior, the operation temperature decreased. It went as low as 30℃.
In a smaller Brabender mixer, active ingredients were added separately to the HNBR/PPC mixture at 70℃ and 30 rpm rotation speed and were mixed for 10 min. Their content was 10 and 20 vol% of the primary compound.
Films with thicknesses between 50-200 μm were made using Calendering technique. Obtained films were put under infrared heating lamps either applied on a Teflon paper or on metal sheets
(Copper or Aluminum). If applied on a metal sheet, films can work as electrodes and were pressed at 100℃ for 5 min before decomposition.
3.2.3 Thermogravimetric Analysis (TGA)
TGA is a thermal analysis method based on measuring the mass variation in a sample while temperature changes. Sample is under a defined atmosphere (nitrogen or air). The mass variations could be due to decomposition, oxidation, or loss of volatiles [64]. In this research, for measuring decomposition temperature and activation energy of decomposition of pure polymers, polymer/catalyst mixtures and compounds, thermal gravimetric analysis was performed using TGA Q500 (TA Instruments, USA). The heating rate in all TGA experiments was of 10℃/min and samples were heated under air up to 800℃.
3.2.4 Fourier transform infrared (FTIR) and UV-VIS-NIR
To understand the range of infrared light in which polycarbonates absorb light the most, an infrared spectrometer using the method of the Fourier transform was used. The tests were completed using a Spotlight 200 FTIR instrument, equipped with a Germanium crystal ATR, from Perkin Elmer (Waltham, MA), with a resolution of 4 cm-1 and an accumulation of 16 scans. The wavelength range which is covered in this test is between 2500-28000 nm.
Since FTIR only covers wavelengths above 2500 nm, UltraViolet-visible-Near Infrared spectrophotometry was performed to have a full spectrum of light absorption for polycarbonates. For this purpose, Cary 7000 Universal Measurement Spectrophotometer (UMS) was used. This equipment gives results in terms of transmittance and reflectance percentages of the samples. By subtracting these two amounts from 100, the absorption of the samples will be calculated. Samples in this equipment should be in the form of transparent films or sheets. For QPAC 40, a free film by dissolving the polymer in THF and letting it dry for 24 hr in air was obtained. PPCL is a highly viscous liquid. To make a film out of it, it was first put in the oven to reach its melting point. Then it was applied on a Spectralon glass which is a reference material with a reference spectrum. By multiplying experimental reflection spectrum with the Spectralon's, the sample spectrum will be obtained. By putting the sample glass on a fridge and cooling it below glass transition temperature, it can be easily put in the machine.
3.2.5 Compound decomposition via Infrared radiation heating
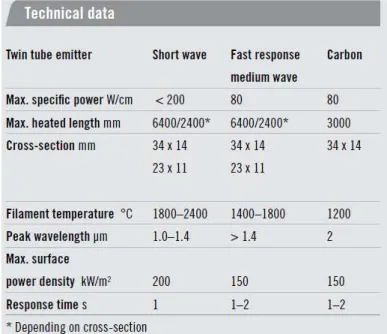
Infrared emitters were supplied by Heraeus Co. Three different types of lamps with three ranges of effective wavelength were used to provide heat to decompose sacrificial phase. Short wave, fast response medium wave and Carbon (long wave) were the lamps which decompositions were carried out under. Heraeus Carbon infrared emitters are designed with medium wave radiation and offer accelerated reaction times. Short wave emitters offer similar range of spectrum to halogen emitters but with better lifetime, strength and durability. Fast response medium wave emitters cover a spectrum between short wave and carbon lamps. Table 1 give technical data on the above-mentioned lamps. This table was adapted from Heraeus company website[65].
There is a black surface installed at the bottom of the chamber. The control temperature of the device is taken from the surface to regulate the power of the lamps. Since samples surface could have different energy absorption than the black surface underneath it, a thermal camera (FLIR brand) was used to detect samples temperature directly.
Table 3-1. Technical data of Infrared lamps used for decomposition
3.2.6 Porosity measurement
3.2.6.1
Scanning electron microscopy (SEM)
By using image analysis based on scanning electron microscopy and digital image processing, porosity of porous electrodes can be measured [66]. Various image processing techniques was used to determine pore size and pore size distribution [58, 67]. In this study, surface and cross section images of polymer electrodes with thickness of 100 μm were analyzed by SEM (FESEM, Hitachi S-4700). For image processing, MIPAR software was used to give pore size and pore size distribution of SEM micrographs.
3.2.6.2
Mercury Intrusion Porosimetry (MIP)
Mercury intrusion porosimetry is a technique which is universally used for measuring pore size and pore size distribution. Samples’ porosity is characterized by applying different levels of pressure to the samples soaked within mercury. The applied pressure is needed for intrusion of mercury in the pores and is inversely proportional to the radius of pores intruded by mercury [68]. This technique can measure pore sizes as small as 3.6 nm and as large as 200 μm [69].
Although this technique can not define the pore shapes, it can give the volume density of porous parts of samples [60]. Porous structure of polymer electrodes was determined using an AutoPore IV 9500 instrument (Micromeritics Instrument Corporation, U.S.A.) with a 15-ml penetrometer. Samples were placed into the cup of the penetrometer, which was closed by tightening the cap. The penetrometer and sample was transferred into the pressure chamber and pressure was applied in the range 0.015-220 MPa for measurements.
CHAPTER 4
RESULTS AND DISCUSSION
4.1 Thermal characterization of Polymer
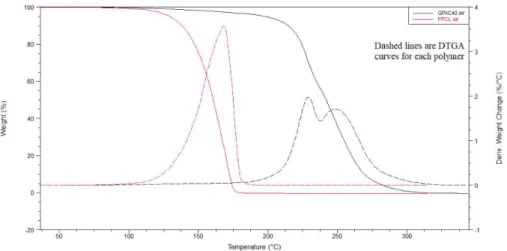
4.1.1 TGA of pure polycarbonates in different environments
Figure 4-1 shows TGA curves of the neat PPCL and neat QPAC 40 under air and nitrogen. As it can be seen from this figure, onset temperature which is the temperature at which degradation starts, under oxidative atmosphere (air) was shifted to lower temperatures for both polymers. In addition, the mechanism of decomposition depends on decomposition atmosphere, polymer molecular weight, ether linkages available in the backbone, and backbone regiostructure [17]. In oxygenated atmospheres, chain scission into combustion products, is the primary pattern for decomposition. In a nitrogen environment, chain unzipping from the ends of the polymer chain or unzipping following chain scission is the main form of decomposition. Ether linkages prevent chain unzipping and higher molecular weight decomposition fragments will be resulted. Regiostructure of the backbones could affect decomposition too. Different mechanisms exist depending on how end groups of each repeating units attached to each other (head to tail (HT), head to head (HH) and tail to tail (TT)). The most common form for decomposition of HT structured backbones is chain unzipping into cyclic propylene carbonate which mostly occurs via either carbonate or alcoxide backbiting. HH and TT regiostructures prevent unzipping mechanism but can go through side-group rearrangement to allow unzipping to proceed. This process takes place at a slightly lower rate [17, 47, 48].
-20 0 20 40 60 80 100 120 0 100 200 300 400 500 W ei gh t ( % ) Temperature (℃) PPCL air PPCL N2 QPAC 40 air QPAC 40 N2
The difference between degradation under nitrogen atmosphere and oxygen was studied elsewhere [70]. There are some differences in the initial steps. Oxygen will ease branching and radical formation by forming peroxide active sites. Peroxides will produce aldehydes, ketones and branched structures, mostly in the first stages of degradation [70-72]. Formation of peroxide at this stage helps increasing the rate of degradation under air in comparison to the nitrogen environment. Decomposition of QPAC 40 with higher molecular weight occurs at lower rate and at higher temperature. Lower temperature and higher molecular weight restricts the amount of end groups in the backbone and therefore unzipping does not start until high temperatures [70]. In PPCl, main degradation mechanism is chain unzipping after a small step of chain scission. For QPAC 40 two stages of high decomposition rate appears in DTGA graph. The first one shows the region in which chain scission mechanism is dominant and the second one, at higher temperature, is chain unzipping dominant region (Figure 4-2).
4.1.2 Thermal degradation of HNBR
To set a limit for the highest temperature in the decomposition process, a TGA test was performed on pure HNBR under air. Onset temperature of pure HNBR in oxygenated environment was calculated from TGA curve and is equal to 397 ℃. In the presence of 1% peroxide catalyst, onset
temperature of HNBR increased to 405 ℃, which shows that the catalyst did not have a negative effect on the matrix.
4.1.3 Catalyst effect on thermal degradation of polycarbonates
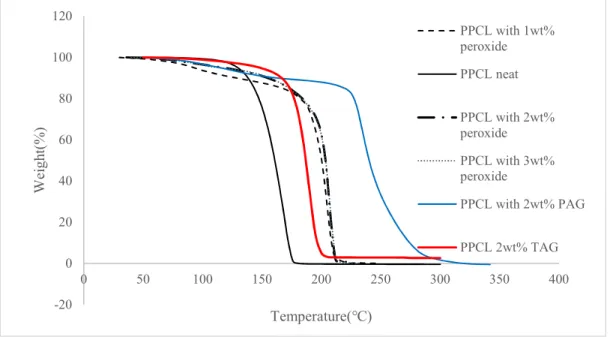
Peroxide formation in the first stages of degradation under air was shown elsewhere to be effective in increasing the degradation rate of polycarbonates [70]. To see if adding excess peroxide could positively affect QPAC and PPCL degradation, Luperox was added to them between 1 and 3 wt% and put in TGA equipment under air environment. Also, PAG and TAG were added to the polycarbonates to study their effect of degradation. Figures 4-3 and 4-4 show the results of TGA for PPCL and QPAC respectively under air in the presence of each catalyst.
Figure 4-3. TGA curves of PPCL under air with different catalysts
As it can be seen from Figure 4-3 and Figure 4-4, none of the catalysts decreases the onset temperature of PPCL and QPAC. In PPCL, all three catalysts increased the degradation temperature. As it can be seen from Figure 4-3 in case of peroxide and TAG, decomposition started at higher temperatures, but the weight loss rate is the same as the neat polymer. For the PPCL compound with PAG, weight loss rate is different from the neat polymer. It can be said that excess peroxide and generated acid available in the system reacted with the peroxides that formed during degradation and prevented degradation until higher temperatures. Therefore, chain scission in first
-20 0 20 40 60 80 100 120 0 50 100 150 200 250 300 350 400 W ei gh t( % ) Temperature(℃) PPCL with 1wt% peroxide PPCL neat PPCL with 2wt% peroxide PPCL with 3wt% peroxide PPCL with 2wt% PAG PPCL 2wt% TAG
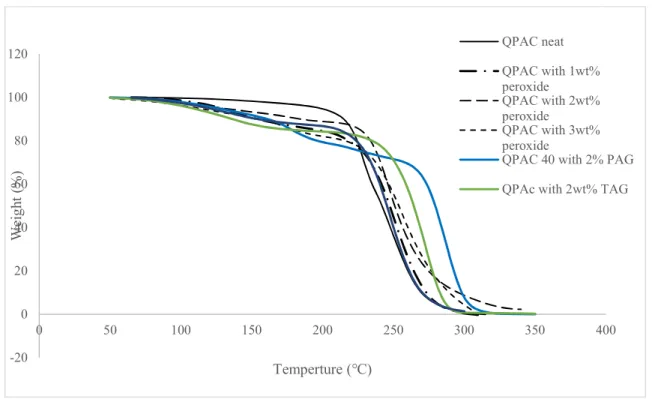
step, which is the primary form of degradation, is inhibited and the mechanism of degradation is mostly chain unzipping. In QPAC also, peroxide, TAG and PAG increased degradation temperature. The polyethers available in this polymer react with the generated acid from PAG and TAG and excess peroxide and by generating an alcohol ending in the chain, unzipping of QPAC chain is delayed [17].
Figure 4-4. TGA curves of QPAC under air with different catalysts
4.1.4 Energy of decomposition via Coats-Redfern method
To calculate the energy of decomposition in polymers, the following method was used: The reaction rate can be expressed by multiplying a function which is temperature dependent, (here K(T)) and a composition- or conversion- dependent term,
-20 0 20 40 60 80 100 120 0 50 100 150 200 250 300 350 400 W ei gh t ( % ) Temperture (℃) QPAC neat QPAC with 1wt% peroxide QPAC with 2wt% peroxide QPAC with 3wt% peroxide
QPAC 40 with 2% PAG QPAc with 2wt% TAG
𝑑𝛼/𝑑𝑡 = 𝐾(𝑇)𝑓(𝛼) Equation (4-1)
In this equation α is the conversion (weight of polymer consumed in the reaction/initial weight of polymer), t and T are time and temperature respectively. K(T) is the rate of reaction, which is considered to have an Arrhenius type relationship.
𝐾(𝑇) = 𝐴𝑒𝑥𝑝(−𝐸/𝑅𝑇) Equation (4-2)
A, E and R are the pre-exponential factor, the activation energy of reaction and the universal gas constant, respectively. Polymer degradation reaction can be assumed as a simple nth-order reaction and can be a function of conversion as shown in Equation 4-3.
𝑓(𝛼) = (1 − 𝛼) Equation (4-3)
By combining these 3 equations and assuming that the heating rate β, is constant, a new expression will be obtained
= (1 − 𝛼)𝑛 𝑒𝑥𝑝(−𝐸/𝑅𝑇) Equation (4-4)
All of the expressions that are offered for calculation of kinetic parameters in thermal degradation of polymers are based on Equation (4-4). By integrating this equation and assuming degradation a first order reaction, Equation (4-5) will be obtained, in which αmax is the degree of conversion at
the inflection point and Tmax is the inflection point temperature in DTGA curve. This equation is
called Kissinger and Ozawa equation.
𝑙𝑛
= 𝑙𝑛
.−
. Equation (4-5)
By obtaining Tmax and αmax for different heating rate and plotting the left side of equation 4-5 versus
1/Tmax, Ea and A will be obtained.
Another expression is available for the calculation of activation energy and pre-exponential factor, which has the benefit of using only one set of data with one heating rate. This equation is called Coats-Redfern Equation and is expressed in Equation (4-6)
𝑙𝑛
( )= 𝑙𝑛
..
1 −
. .
−
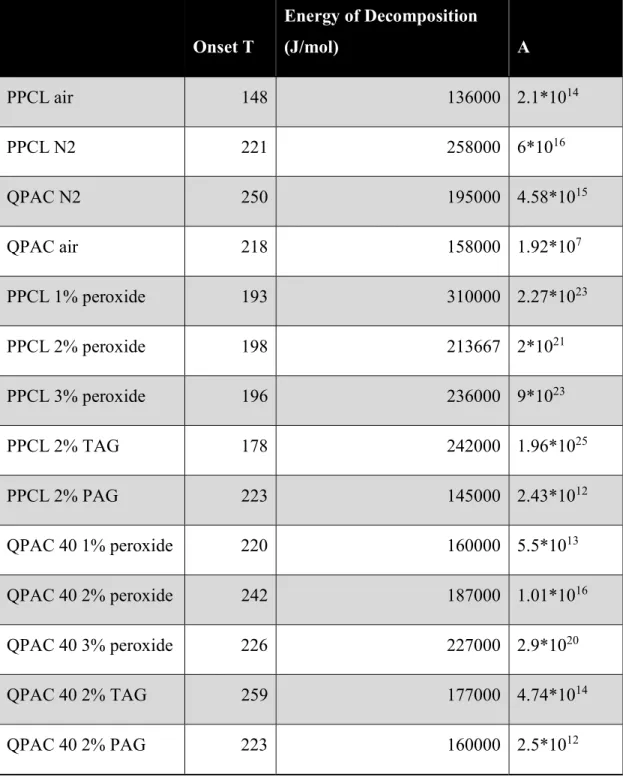
By plotting left side of this equation vs. -1/T, activation energy and pre-exponential factor will be calculated. Table 4-1 shows the onset temperatures and kinetic parameters calculated by Coats-Redfern method for pure and catalyst-containing samples. As it can be seen from this table, for pure polycarbonates, nitrogen inhibits oxygenation of the polymers at lower temperature and degradation temperature and energy are much higher than in air environment.
All catalysts increased activation energy to much higher amounts in comparison to pure polymers. These results confirm that these catalysts not only did not help reducing the degradation temperature, but they also worked as a kind of stabilizer of polycarbonates and slowed down the degradation reaction. For this reason, they were not added to the blends for further investigations.
Table 4-1. Pure and catalyst-containing polycarbonates kinetics parameters calculated using Coats-Redfern method for air and nitrogen environment
Onset T Energy of Decomposition (J/mol) A PPCL air 148 136000 2.1*1014 PPCL N2 221 258000 6*1016 QPAC N2 250 195000 4.58*1015 QPAC air 218 158000 1.92*107 PPCL 1% peroxide 193 310000 2.27*1023 PPCL 2% peroxide 198 213667 2*1021 PPCL 3% peroxide 196 236000 9*1023 PPCL 2% TAG 178 242000 1.96*1025 PPCL 2% PAG 223 145000 2.43*1012 QPAC 40 1% peroxide 220 160000 5.5*1013 QPAC 40 2% peroxide 242 187000 1.01*1016 QPAC 40 3% peroxide 226 227000 2.9*1020 QPAC 40 2% TAG 259 177000 4.74*1014 QPAC 40 2% PAG 223 160000 2.5*1012
![Figure 2-1. Charge/discharge process in Li ion battery with layered structured electrodes [12]](https://thumb-eu.123doks.com/thumbv2/123doknet/2340638.33805/20.918.150.764.197.482/figure-charge-discharge-process-battery-layered-structured-electrodes.webp)
![Figure 2-4. Methods for pore size and pore size distribution measurement [57]](https://thumb-eu.123doks.com/thumbv2/123doknet/2340638.33805/29.918.208.715.516.872/figure-methods-pore-size-pore-size-distribution-measurement.webp)