HAL Id: hal-02607962
https://hal.inrae.fr/hal-02607962
Submitted on 16 May 2020
HAL is a multi-disciplinary open access archive for the deposit and dissemination of sci-entific research documents, whether they are pub-lished or not. The documents may come from teaching and research institutions in France or abroad, or from public or private research centers.
L’archive ouverte pluridisciplinaire HAL, est destinée au dépôt et à la diffusion de documents scientifiques de niveau recherche, publiés ou non, émanant des établissements d’enseignement et de recherche français ou étrangers, des laboratoires publics ou privés.
To cite this version:
L.R. Lagadec, L. Moulin, Isabelle Braud, B. Chazelle, P. Breil. A surface runoff mapping method for optimizing risk assessment on railways. Safety Science, Elsevier, 2018, 110 (part B), pp.253-267. �10.1016/j.ssci.2018.05.014�. �hal-02607962�
1
Title: A surface runoff mapping method for optimizing risk assessment on railways 1
Lilly-Rose Lagadec1,2,3, Loïc Moulin1, Isabelle Braud2, Blandine Chazelle4, Pascal Breil2
2
1 SNCF Réseau (French Railway Company), Engineering & Projects Direction, Railways, Tracks & 3
Environment Department, 6 avenue Francois Mitterrand, 93210 La-Plaine-Saint-Denis, France. 4
2 Irstea, UR RiverLy, Lyon- Villeurbanne Center, 5 Rue de la Doua, CS 20244, 69625 Villeurbanne 5
cédex, France. 6
3 SNCF Réseau (French Railway Company), Engineering and Projects South-West, PIEG General 7
Studies, 54 bis rue Amédée Saint Germain, 33077 Bordeaux, France. 8
4 SNCF Réseau (French Railway Company), Engineering and Projects South-East, General Studies, 31 9
Avenue Albert-et-Elisabeth, 63037 Clermont-Ferrand Cedex, France. 10
Corresponding author: [email protected]
11
Abstract: 12
Railways are critical infrastructures for the transportation of people and goods and network failures 13
must be controlled in order to maintain safety and to limit economic losses. The railway network is 14
exposed to natural hazards and particularly to intense pluvial runoff. Due to the complexity of the 15
phenomenon, management of risks induced by pluvial runoff raises technical and scientific issues. An 16
innovative method for runoff susceptibility mapping, called IRIP for “Indicator of Intense Pluvial 17
Runoff”, has been created and adapted to the railway context. The objective of this paper is to 18
evaluate the relevance of the mapping method and to provide application advice. The mapping 19
method is evaluated by comparison with the results of a hydraulic diagnosis, on a 20 km railway line, 20
using quantitative and qualitative comparisons. On the basis of contingency tables, probabilities of 21
detection (POD, railway sections exposed and detected by IRIP) and false alarm ratios (FAR, railway 22
sections detected by IRIP whereas they are not exposed) are computed. POD range from 94 to 100% 23
and FAR range from 20 to 26%. Then spatial information provided by the maps is compared with field 24
observations and recommendations. It is shown that the mapping method can bring substantial 25
contribution to risk identification and that the IRIP method can allow pushing forward the current 26
risk reduction methods. Thus, the surface runoff maps open up new opportunities to manage surface 27
runoff, such as targeting mitigation actions at the origin of the hazard in partnership with the other 28
territory stakeholders. 29
2 Highlights:
31
The IRIP method “Indicator of Intense Pluvial Runoff” maps the surface runoff susceptibility. 32
The method performance and reliability are evaluated in the railway context 33
The IRIP method makes a substantial contribution to risk assessment 34
Surface runoff maps open up new opportunities to push forward the current processes 35
Keywords: Railway infrastructure; natural hazards; water surface runoff; risk assessment; 36
mapping method; evaluation 37
3 1. Introduction
38
1.1. Context 39
Railways are critical infrastructures for the transportation of people and goods (Maurer et al., 2012). 40
The French railway network operates about 30,000 km of railways and about 15,000 trains run daily 41
for freight and passengers. Railway network failures must be imperatively controlled in order to 42
maintain user and employee safety and to limit economic losses for the company, either direct cost 43
(reconstruction works after an incident, delay compensations) or indirect cost (foregone revenues 44
due to network unavailability, possible brand-image deterioration). Railway infrastructure is 45
composed of multiple interacting elements such as the fixed installations for electric traction, the 46
telecommunication installations, the traffic control installations, the tracks, the civil engineering 47
structures, and the earthworks. Earthworks are built to get a steady longitudinal profile of the tracks 48
and avoid the natural terrain fluctuations. Different transversal profiles can be created: 49
embankments, when the tracks are above compacted material layers; excavations, when the tracks 50
are below the natural terrain; mixed profiles, with an embankment on one side and an excavation on 51
the other, and flat profiles when no particular earthwork is undertaken (Figure 1). 52
53
Figure 1: Three types of transversal profiles of the railway infrastructure 54
Railways are exposed to water-related hazards since they cross natural water-flow paths (Chazelle et 55
al., 2014). Water-related hazards can be classified into different types: fluvial flooding when rivers 56
flow over their banks, coastal flooding when normally dry lands are flooded by sea water, ground 57
water flooding when the ground water table level rises above the natural terrain, and pluvial flooding 58
when rainfall generates floods on hillslopes outside the river network. This study focuses on pluvial 59
flooding. When rainfall intensity exceeds soil infiltration capacity, water can flow over the ground 60
surface (Beven, 2011; Dehotin et al., 2015a) and generate damage. Water surface runoff can reach 61
high velocities and densities by carrying materials. This phenomenon is influenced by multiple factors 62
(Le Bissonnais et al., 2005; Sivapalan et al., 1987): rainfall characteristics (intensity, duration, and 63
frequency), soil surface characteristics such as topography, land use (agricultural and urban areas) 64
and soil physical properties (type, permeability, erodibility, thickness). Once water is generated on 65
the surface, it can flow downstream and generate various hazards such as floods, mudflows, shallow 66
landslides, and erosion. 67
4
Railway infrastructure is particularly vulnerable to surface runoff given its characteristics. Electric 68
installations may experience failure when impacted by water. The tracks are composed of ballast 69
between the rails and the platform, which provide good mechanical properties but which can easily 70
be swept away by water flows (Amblard et al., 2015). Earthworks are also vulnerable to surface 71
runoff depending on their profile, length, slope or construction materials. They may experience 72
erosion, landslides or destruction (Figure 2). In order to protect the infrastructure, railways are 73
equipped with hydraulic structures. Their function is to ensure the natural water flows from 74
upstream to downstream and to manage water generated within the railway right-of-way. Hydraulic 75
structures can be transversal (aqueduct, nozzle, bridge) to make the water cross the railway. They 76
can be longitudinal (ditches, drains, dikes) to pipe water towards an outlet. Retention basins can also 77
be installed to dampen incoming and outgoing water volumes. 78
79
Figure 2: Illustration of surface runoff impacts on railways: from left to right, flood, landslide, and 80
breach in the embankment 81
From an operational point of view, the risks for the railway network are disrupting train circulation 82
and jeopardizing safety. Thus, risks induced by surface runoff are 1/ railway unavailability due to the 83
presence of obstacles (water, materials), 2/ railway unavailability due to the absence of an element 84
or of the whole railway (breach, destruction) and 3/ accelerated degradation of railway elements or 85
railway stability. To manage these risks, actions must be undertaken at every railway life-stage: 86
during new railway or new structure design, during maintenance, during operation by monitoring, 87
during crisis phases, and after a crisis for recovery and feedback. However, surface runoff risk 88
management generates technical issues as well as scientific issues. 89
1.2. Technical issues 90
Current issues in managing risks induced by surface runoff on railways lie in quantifying and 91
qualifying surface runoff. Quantifying refers to a flow rate estimate at a catchment outlet and 92
qualifying refers to a spatial assessment of areas where surface runoff is susceptible to occur. Flow 93
rates are computed in order to dimension hydraulic structures or to verify they have a sufficient 94
capacity. Surface runoff flow rate can be estimated for a catchment, thanks to historical discharge 95
5
data, by applying statistical methods on rainfall and runoff data. In nearly all cases, however, 96
catchments intercepted by railways are ungauged. In this case, pseudo-empirical formula can be 97
applied, such as the rational method (Thompson, 2007). The rational method allows computing the 98
flow rate by multiplying the catchment area, the rainfall intensity, and a surface runoff coefficient. 99
Uncertainties arise, amongst others, with the estimation of the surface runoff coefficient, which 100
varies from 0 (totally permeable) to 1 (totally impervious), and which relies on expert opinion. 101
Pseudo-empirical formulas are difficult to reproduce and not automated. So, they are difficult to 102
apply for long railway sections. Moreover, peak flow rate is not the only representative variable for 103
characterizing surface runoff since it can also carry mud and materials. This can clog hydraulic 104
structures and significantly reduce their capacity. Moreover, the environment surrounding the 105
railway is permanently evolving: land use can change (cultivation, urbanization), it can increase or 106
deflect the incoming water volumes and existing hydraulic structures can become insufficient. 107
The surface runoff phenomenon itself is difficult to study and there is no hazard reference map 108
available. There are different approaches in the scientific literature for surface runoff mapping. The 109
approaches based on topography analysis only (Pons et al., 2010) are rather simple but they do not 110
take into account the other parameters that influence surface runoff occurrence and intensity, such 111
as land use or soil types. The approaches based on indicator combinations (Cerdan et al., 2006; Le 112
Gouee et al., 2010) are more complex, but mainly focus on the erosion process and require accurate 113
soil data, which are not available on a large scale. The approaches based on physical modelling 114
(Dabney et al., 2011; Smith et al., 1995) are interesting since they can model the spatial and temporal 115
dynamics at catchment scale, but they also require numerous input and calibration data and are 116
hardly applicable on a large scale. Difficulties lie in the complexity of the surface runoff phenomenon. 117
Surface runoff is generated by rainfall whose location and intensity are still difficult to forecast with 118
current meteorological models. It is influenced by multiple factors and can occur in various forms 119
(flood, erosion, mud). Thus, data from observations and measurements remain scarce, although they 120
are essential to better understand the phenomenon and to calibrate and evaluate models. For these 121
reasons, there is generally no mapping of the surface runoff hazard available on a national scale. 122
1.3. Scientific issues 123
A method called IRIP (for “Indicator of Intense Pluvial Runoff”, French acronym) for surface runoff 124
susceptibility mapping was developed by Dehotin and Breil (2011) from IRSTEA (French National 125
Research Institute of Science and Technology for Environment and Agriculture). The IRIP method 126
proposes an innovative approach for considering surface runoff. The method allows the creation of 127
three maps representing three different phases of the surface runoff phenomenon: generation, 128
transfer, and accumulation. The territory understanding is thus simplified by a spatial segmentation 129
6
of the dominant processes, and the risk management can be optimized by adapting the mitigation 130
techniques depending on the areas. The mapping method has been designed to be simple enough in 131
order to be widely applicable, in particular in an operational context. It requires only three input 132
data: a digital elevation model, a land use map, and a soil map. The IRIP method provides an 133
operational method for surface runoff hazard mapping that can be used by regional organizations for 134
land planning objectives. By sharing these issues in part with the railway infrastructure manager, the 135
IRIP method has been adapted to the railway context in collaboration with SNCF Réseau. The maps 136
created by the IRIP method are intended for use as a tool for decision-making. However, decisions 137
can generate changes and induce costs in terms of planning or works, or affect safety aspects. Thus, 138
decision-makers must be aware of the map interpretation rules, their range of application, and their 139
uncertainties. For these reasons, the IRIP maps must be evaluated. 140
The scientific issue lies in the fact that, because of the surface runoff phenomenon complexity, there 141
is no database of surface runoff observation or measurement available on a large scale to evaluate 142
the surface runoff maps. So proxy data must be used for the evaluation. Proxy data are data which 143
are not directly related to the physical phenomenon but which inform on the phenomenon 144
occurrence, for example, data of surface runoff impacts. However, difficulties arise when comparing 145
model outputs with proxy data because of the indirect relationship. Some studies used data of 146
surface runoff impacts to evaluate or calibrate hydrologic models. Naulin et al. (2013) and Versini et 147
al. (2010) used impact data on roads to evaluate and calibrate their flash-flood warning model. 148
Defrance et al. (2014) and Javelle et al. (2014) used impact data to evaluate the performance of their 149
flash-flood warnings. The IRIP method has also been evaluated by comparison with impact data on 150
roads (Lagadec et al., 2016b) and on railways (Dehotin et al., 2015b; Lagadec et al., 2016a). During 151
these evaluation tests, good probabilities of detection were obtained but also high false-alarm ratios 152
because numerous areas where identified as susceptible to surface runoff but no impact has been 153
recorded. For these studies, the major issue lies in characterizing the structural vulnerability of the 154
transportation network, a key component when comparing hazards with effective impacts. For the 155
same hazard intensity, the effective impact can be reduced by a low structural vulnerability or 156
aggravated by a high structural vulnerability of the impacted network section. Use of proxy data also 157
brings further uncertainties due to biases in the data exhaustiveness, representativeness, and 158
location inaccuracy. So evaluation tests must go further in order to fully assess the IRIP method 159
performance. 160
7 1.4. Objectives
162
This paper has two objectives. The first one is to evaluate the surface runoff susceptibility maps 163
created with the IRIP method by comparison with the results of a hydraulic diagnosis performed on a 164
20-km stretch of railway. The evaluation focuses both on the performance of the IRIP method to 165
detect railway sections exposed to surface runoff and on the relevance of the spatial information 166
provided by the maps compared to the field reality. For this evaluation, the correspondence between 167
the IRIP maps and the results of the hydraulic diagnosis is analyzed, taking into account the structural 168
vulnerability of the railway infrastructure. The second objective is to provide practical solutions for 169
integrating the IRIP method into the current risk assessment process in order to improve the 170
management of surface runoff-related risks. Results of the IRIP method evaluation allow identifying 171
specific tasks of the risk assessment process to which the IRIP method can make a direct 172
contribution. Moreover, opportunities to improve risk reduction methods are discussed in the light of 173
the new information brought by the IRIP method. The IRIP method development benefits from an 174
industry-research partnership that makes it possible to go beyond a simple knowledge-to-application 175
transfer, and enables the co-generation of new knowledge and new concepts for the two parts 176
(Hatchuel et al., 2001; Klasing-Chen et al., 2017). Indeed, using data of the railway infrastructure 177
manager allows evaluating the IRIP method and learning about the surface runoff physical 178
phenomenon. Applying the IRIP method in an operational context makes it possible to identify 179
possible new developments of the method to answer operational needs. Moreover, using an 180
innovative mapping method opens up new possibilities for the management of surface runoff-related 181
risks for the infrastructure manager. 182
2. Materials and methods 183
2.1. The hydraulic diagnosis of the Bréauté to Fécamp railway line 184
The Bréauté to Fécamp railway, located in the Normandy region, is line 359000 of the French railway 185
network. The Bréauté to Fécamp railway is 20 km long. It is a single track line, non-electrified with a 186
maximum speed limit of 80 km/h. The railway connects the city of Bréauté, on the Paris-to-Le Havre 187
railway axis, to the port city of Fécamp. The railway was put into operation in 1856. Regarding the 188
hydrological context, the railway intercepts several catchments with a total area of about 55 km², an 189
altitude ranging from 6 to 146 m ASL (Above Sea Level). The area is composed of large plateaus 190
(south and start of the line) and a narrow valley (north and end of the line) (Figure 3). The catchment 191
soil is mainly composed of silt and clay on the plateaus, with colluvial deposit in the valley and the 192
bedrock is composed of chalk and flint stones. There is no perennial river in the catchment but 193
intermittently, during rainfall, small streams can be activated within the main valleys. The land use is 194
8
dominated by agriculture with rural households and the small city of Fécamp in the north has about 195
20,000 inhabitants. Due to its age, its location, and a low traffic level, this railway has been suffering 196
from an advanced level of deterioration. To ensure safety aspects, the railway traffic was slowed, 197
from 80 to 60 km/h, then to 40 km/h, and then was stopped. In the context of an Infrastructure and 198
Transport Regional Plan adopted by the Normandy region in 2009, the Bréauté to Fécamp railway 199
has been identified as a substantial means of transportation for regional development. Since then, 200
several analyses have been undertaken to optimize regeneration works. 201
202
Figure 3: The study area which includes the railway from Bréauté to Fécamp and all the catchments 203
intercepted by the railway 204
In this context of line regeneration, a railway line diagnosis was carried out in order to decide and 205
prioritize works. All the infrastructure elements were considered, from the platform, the rails, to the 206
earthworks and to the hydraulic structures. For the present paper, to evaluate the IRIP method, we 207
focus on the hydraulic studies. Due to the important constraints in terms of budget and time during 208
the diagnosis, the study only focused on drainage regeneration works. Hydraulic structures crossing 209
under the railway or retention basins were not studied. The diagnosis consists of assessing the level 210
of hazard exposure, and of assessing the capacity of the existing drainage structures, regarding their 211
level of deterioration. In a second step, recommendations were provided in terms of drainage design 212
and monitoring strategies. To this purpose, the Bréauté-Fécamp railway line was divided into 61 213
sections depending on their transversal profile type (embankment, excavation, mixed profile). This 214
division choice is consistent from a hydraulic point of view. The interaction type between the natural 215
9
surface runoff and the infrastructure strongly depends on the type of transversal profile. Among 216
these 61 sections, 17 have been selected for drainage regeneration works. 217
The results of the study performed on the Bréauté-Fécamp railway line do not only reflect the level 218
of surface runoff hazard exposure along the line, but is a combination of the risk assessment and the 219
budget, time and feasibility constraints. Recommendations for hydraulic works were required by the 220
infrastructure manager to respect certain constraints such as a lack of space for implementing the 221
sufficient drainage structures regarding the estimated flow rates and the mud inflows; time 222
constraints of the work period, which hindered feasibility studies for works outside the railway right-223
of-way and made it impossible to establish special procedures for water legislation which would have 224
taken too much time; and budget constraints, which obliged the study to focus only on the drainage 225
structures and not on the hydraulic structure crossing under the railway or other structures such as 226
retention basins. The study results however provide meaningful information about potential storm 227
runoff coming from the surrounding environment, and a fair source of comparison for the IRIP maps. 228
2.2. The IRIP method 229
2.2.1. Description 230
The IRIP method is described briefly here, but further information can be found in the literature 231
(Dehotin and Breil, 2011a; Lagadec et al., 2016b). The IRIP method combines indicators from 232
geographic information layers and produces three maps representing three processes of storm 233
runoff (Figure 4, Table 1): generation, representing areas with low infiltration capacity and which are 234
susceptible to generate water at ground surface; transfer, representing areas where surface water 235
can move downward, accelerate, and erode soils; and accumulation, representing areas where 236
surface runoff can concentrate following topography, where it can slow down and generate floods 237
out of rivers and deposits. Each map is created by combining five indicators. Each indicator is 238
classified into two categories: favorable, where 1 is attributed to the pixel, or not favorable, where 0 239
is attributed. This yields 5 binary maps. The maps are added to create a susceptibility map with 6 240
levels, from 0 (not susceptible) to 5 (very susceptible). For each of the three susceptibility maps, the 241
5 indicators are different. The generation map is created thanks to three indicators derived from a 242
soil map, one indicator derived from a land use map, and one derived from the topography. The 243
latter is a combination of the slope and the topographic index (Beven and Kirkby, 1979): 1 if both are 244
favorable, 0 if one is not favorable. The generation map is then considered as an input indicator for 245
the two other maps of transfer and accumulation in order to represent the necessity for the surface 246
water to be generated before being transferred and/or accumulated. Maps of transfer and 247
accumulation are created mainly by associating indicators based on topography, but with opposed 248
favorability conditions, in order to represent the opposed movement of acceleration and slowdown. 249
10
For example, the slope indicator is favorable for transfer in the case of steep slopes, and for 250
accumulation in the case of low slopes. The break of slope indicator is favorable for transfer in the 251
case of convex break of slopes and for accumulation in the case of concave break of slopes. 252
Topographic indicators are computed for each pixel relatively to the upstream sub-catchment in 253
order to follow the hydrological logic from upstream to downstream. The resolution of the 254
susceptibility maps retains the resolution of the Digital Elevation Model (rasterized topography map) 255
used as input data. To determine the favorability thresholds for topographic indicators, a 256
classification method is used (Rubin, 1967), in order to compute a relative threshold depending on 257
the study area. Thus, the method can be applied on various territories without a priori local 258
knowledge. 259
260
Figure 4: The indicator combination scheme of the IRIP method 261
11
Table 1: List of the indicators used in the IRIP method along with their conditions of favorability to 263
surface runoff 264
IRIP maps Indicators Conditional values
Generation
Soil permeability 0: Saturated hydraulic conductivity (Ks) ≥ 1e-6 m/s 1: Ks < 1e-6 m/s
Soil thickness 0: Thickness ≥ 50 cm 1: Thickness < 50 cm
Soil crustability 0: Crustability < 3 (Cerdan et al., 2006) 1: Crustability ≥ 3
Topography
0: Slope ≤ 0.5% AND topographic index ≤ (mean + standard deviation)
1: Slope > 0.5% OR topographic index > (mean + standard deviation)
Land use 0: Pastures, grasslands, and forests 1: Urban areas and agricultural lands
Transfer
Upstream generation susceptibility
0: Modal value of the upstream sub-catchment < 3/5 1: Modal value of the upstream sub-catchment ≥ 3/5
Slope 0: Slope ≤ 5%
1: Slope > 5%
Break of slope 0: Concave break of slope 1: Convex break of slope
Drained area 0: Drained area ≤ (mean + standard deviation) 1: Drained area > (mean + standard deviation) Soil erodibility 0: Erodibility < 3
1: Erodibility ≥ 3
Accumulation
Upstream generation susceptibility
0: Modal value of the upstream sub-catchment < 3/5 1: Modal value of the upstream sub-catchment ≥ 3/5
Slope 0: Slope > 5%
1: Slope ≤ 5%
Break of slope 0: Convex break of slope 1: Concave break of slope
Topographic index 0: Topographic index ≤ (mean + standard deviation) 1: Topographic index > (mean + standard deviation) Drained area 0: Drained area ≤ (mean + standard deviation)
1: Drained area > (mean + standard deviation) 265
2.2.2. Input data and parameterization for the study 266
Input data used for the study area are: a 5m resolution Lidar DEM from IGN (French National 267
Geographic Institute1), the European Soil Database at 500 meters resolution created from the LUCAS
268
12
database (Ballabio et al., 2016), and the regional land use map2 at a scale of 1/5000 in rural areas and
269
1/2000 in urban areas. Because high resolution input data were available and previous works had 270
been conducted in the Seine-Maritime County with the IRIP method (Lagadec et al., 2016b), a specific 271
parameterization of the method was proposed for this study. Two indicators were adapted along 272
with some favorability thresholds, which are the condition for a pixel to be set at 1 or 0. Concerning 273
the indicators, because of a strong disposition of the soil to slaking crust in this region (Cerdan et al., 274
2002), a slaking indicator was used in the generation map, instead of the erodibility indicator. The 275
erodibility indicator was used in the transfer map to highlight the erosion mechanism, which is 276
important in this territory. The erodibility indicator replaces the ground linear axes in the transfer 277
map. The ground linear axis indicator is used in the case of coarse resolution DEM, in order to 278
represent the effect of interception and redirection of surface runoff by roads, agricultural drainage 279
or even railways (1 for presence of a linear axis, otherwise 0). For this study, the use of a Lidar DEM 280
allows the detection of this kind of ground axes, so their effects of interception and redirection are 281
directly taken into account within the topographic indicators. 282
Concerning the favorability thresholds, they are summarized in Table 1. A soil is considered as having 283
low infiltration capacity for saturated hydraulic conductivity lower than 10-6 m/s. A soil is considered
284
as thin, and thus with a low storage capacity, for a thickness lower than 50 cm. The thresholds for soil 285
slaking ability and erodibility are set at 3 with respect to the pedo-transfer rules (Cerdan et al., 2006). 286
These thresholds are set by default in the IRIP method and are based on a literature review in the 287
pedology field (Dehotin and Breil, 2011a, 2011b). For this study, the thresholds that are adjusted for 288
the study area are those for the slope, the topographic index, and the drained area indicators. The 289
threshold of 5% was chosen thanks to discussions with local actors (SMBV Pointe de Caux3), who
290
generally observe intense surface runoff on about 5% slopes. A threshold of 0.5% is chosen for the 291
generation map, because below 0.5% the area is considered flat and surface runoff can infiltrate into 292
the soil. The thresholds of topographic index and drained areas are set at the mean plus the standard 293
deviation of the range of values over the study area, instead of using the classification method. The 294
classification method provides good results for coarser resolution DEM, but for this study using a 295
very high resolution DEM modifies the range of values, and the threshold must be more restrictive to 296
display less information and to simplify the interpretation of the maps. Note that the hydraulic 297
structures are not taken into account in the IRIP method, in particular those under the railway that 298
do not appear in the DTM. 299
2 Website to download the regional land use map and further information about its creation:
http://mos.hautenormandie.fr/
13
2.3. Comparison method of the IRIP maps and the hydraulic diagnosis results 300
The objective of the comparison is to evaluate the performance of the IRIP method to retrieve 301
railway sections exposed to surface runoff. Two types of comparisons are performed: a quantitative 302
comparison over the whole line, using statistical methods; and a qualitative comparison on three 303
railway sections to assess the relevance of the spatial information over the catchment. 304
2.3.1. Quantitative comparison 305
In this part, the question we want to address is: are the highest susceptibility levels of the IRIP maps 306
located on the railway sections selected for regeneration works? In other words, what is the 307
Correspondence rate between the IRIP maps and the hydraulic diagnosis results, over the whole 308
railway line? To answer this question, the railway was divided into 3 types of transversal profile 309
(embankment, excavation, and mixed profile) following the division performed during the hydraulic 310
diagnosis. For each profile type, the following information was summarized: its length (in meters), 311
the presence of an aperture under the railway (bridge or hydraulic structure), and whether or not the 312
section was selected for regeneration works. Concerning the IRIP information, the following 313
information was computed for each profile type: the number of pixels greater than or equal to 4/5 314
for the maps of transfer and accumulation that are located within a buffer area of 5 meters both 315
sides of the railway. This 10-meter width of analysis was chosen in order to take into account the 316
track, which is a single track, the sidetracks, and a part of the earthworks. As it is difficult to state 317
from which level of exposure a railway is susceptible to suffer damage, two hypotheses were tested 318
to consider a railway section detected by IRIP as exposed to surface runoff or not: condition no. 1, at 319
least 1 pixel of the transfer or the accumulation map greater than or equal to 4/5 located within the 320
10-m buffer area; and condition no. 2, at least 10% of the linear of the railway section is covered by 321
pixels transfer or accumulation greater than or equal to 4/5. This ratio was computed by the sum of 322
the pixel numbers of accumulation and transfer, multiplied by 5 (the length of a pixel), divided by the 323
section linear, and multiplied by 100 to get a percentage. This allowed having a rather permissive 324
condition (the first), and a more binding condition (the second). 325
To analyze the performance of the IRIP method, contingency tables were created and verification 326
indicators were computed. A contingency table is a matrix that represents the interrelation between 327
two variables (Hogan and Mason, 2012; Stanski et al., 1989). For this study, contingency tables were 328
computed between the number of sections that are detected by IRIP or not (lines) and the number of 329
sections that are selected for works or not (columns) (Table 2). The true positives (T+) are sections 330
which are detected by IRIP and selected for regeneration works. The false positives (F+) are sections 331
which are detected by IRIP but not selected for works. The false negatives (F-) are sections which are 332
not detected by IRIP but are selected for works. And the true negatives (T-) are sections which are 333
14
not detected by IRIP and not selected for works. Table 3 presents the indicators used for evaluating 334
the IRIP method performance. The probability of detection (POD) and the false alarm ratio (FAR) are 335
computed from the contingency tables. The best score is for a greatest POD combined with a lowest 336
FAR. In addition to this, Chi-Square tests are performed for each contingency table in order to assess 337
the statistical significance of the contingency tables. A Chi-Square test allows the assessment of the 338
statistical dependence between the IRIP maps and the diagnosis results, by comparing the observed 339
headcount of the contingency table to headcount got with a hypothesis of total independence. For 340
example, according to the tabulated Chi-Square values, if the computed Chi-Square is above 6.63, it 341
means that the probability of independence between the IRIP maps and the diagnosis results is less 342
than 1%. Finally, the false negatives and the false positives were explained through a brief 343
assessment of the vulnerability. 344
Table 2: The theoretical contingency table representing the interrelation between the number of 345
sections detected by IRIP and the number of sections selected for work 346
Selected for work
Yes No Detected by IRIP Yes T+ F+ No F- T- 347
Table 3: Summary of the indicators used to evaluate the IRIP method performance along with their 348
equation and interpretation. 349
Indicators Equations Interpretation
POD (𝑇+) (𝑇 +) + (𝐹−) Range: 0 – 1 Best score: 1 FAR (𝐹+) (𝐹 +) + (𝑇+) Range: 0 – 1 Best score: 0 Chi-Square ∑ (𝑂 − 𝐸)² 𝐸 O = Observed headcounts E = Expected headcounts
For 1 degree of freedom: P(X2>6.63)=0.01 P(X2>7.88)=0.005 P(X2>10.83)=0.001 350 2.3.2. Qualitative comparison 351
In this part, the question we want to answer is: do the field observations and the recommendations 352
fit with the spatial information of the IRIP maps of transfer and accumulation? In other words, on 353
which map and in which forms is the information from the field retrieved? The relevancy of the IRIP 354
maps is assessed in terms of location of the preferential water flow paths, of areas susceptible to 355
surface water accumulation and susceptible to erosion, and in terms of IRIP susceptibility levels. 356
15
Schemes from the hydraulic diagnosis are used to perform the comparisons. For each section 357
selected for works, the schemes represent the recommended measures along with the field 358
observations. The comparison is visual and qualitative because it displays the two maps, IRIP and the 359
diagnosis, of the same area side by side. Photos from the field allow supporting identification of 360
matching areas. Although all railway sections analyzed in the diagnosis were compared to IRIP maps, 361
this paper presents four sections. Two of them illustrate mainly the contribution of the accumulation 362
susceptibility map and the other two illustrate mainly the contribution of the transfer susceptibility 363
map. Finally, some patterns of storm runoff spatial dynamics and railway infrastructure configuration 364
can be identified from this comparison as being a configuration at risk. So interpretation guidelines of 365
the IRIP maps are provided in order to support forthcoming risk assessment of railway lines. 366
3. Results 367
3.1. Quantitative comparison 368
Table 4: List of the 61 railway sections along with their type of transversal profile (Emb: 369
Embankment, Exc: Excavation, MP: Mixte Profile), their length, whether or not they have been 370
selected for drainage regeneration works, the number of pixels with susceptibility levels greater than 371
or equal to 4/5 in transfer and in accumulation, the ratio of the number of pixel and the length, 372
whether or not the section has been detected by IRIP according to 2 conditions and whether or not 373
there is an aperture under the railway. 374
16 No. Type Linear
(m) Selected for works Σ Acc 4&5 Σ Trans 4&5 Ratio IRIP/linear (%) Detected by IRIP Condition 1 Detected by IRIP Condition 2 Aperture under the railway 1 Emb 230 no 0 0 0 no no no
2 Emb 225 no 3 8 24 yes yes yes
3 Exc 1020 yes 70 0 34 yes yes no
4 Emb 30 no 1 0 17 yes yes yes
5 Exc 290 no 22 0 38 yes yes no
6 Emb 520 no 0 0 0 no no no
7 Exc 340 yes 29 0 43 yes yes no
8 Emb 470 no 0 0 0 no no no
9 Exc 1010 yes 129 0 64 yes yes no
10 Emb 520 no 1 1 2 yes no yes
11 Exc 1250 yes 91 1 37 yes yes no
12 Emb 650 no 2 2 3 yes no yes
13 Exc 200 no 0 0 0 no no no
14 Emb 250 no 1 2 6 yes no yes
15 Exc 100 no 0 0 0 no no no
16 Emb 50 no 2 0 20 yes yes yes
17 Exc 440 no 24 0 27 yes yes no
18 Emb 250 no 0 2 4 yes no yes
19 Exc 250 no 5 0 10 yes yes no
20 Emb 460 no 0 1 1 yes no yes
21 Exc 300 no 11 0 18 yes yes no
22 Emb 200 no 1 1 5 yes no yes
23 Exc 500 yes 28 0 28 yes yes no
24 Emb 570 no 0 0 0 no no no
25 Exc 500 no 25 0 25 yes yes no
26 Emb 150 no 0 0 0 no no no
27 Exc 300 no 4 0 7 yes no no
28 Emb 330 no 2 2 6 yes no yes
29 Exc 1200 yes 130 0 54 yes yes no
30 Emb 200 yes 32 2 85 yes yes no
31 Exc 200 yes 26 1 68 yes yes no
32 Emb 150 no 0 0 0 no no no
33 Exc 550 yes 54 24 71 yes yes no
34 Emb 100 no 1 1 10 yes yes yes
35 Exc 830 yes 46 0 28 yes yes no
36 MP 330 yes 3 38 62 yes yes no
37 Emb 120 no 2 1 13 yes yes yes
38 MP 260 no 0 0 0 no no no
39 Emb 110 no 0 0 0 no no no
40 Exc 410 yes 1 17 22 yes yes no
41 Emb 150 no 0 0 0 no no no
42 Exc 160 no 28 23 159 yes yes yes
43 Emb 110 no 1 2 14 yes yes yes
17
375
For this comparison, the railway is divided into 61 sections which represent the different profile 376
types: embankment, excavation, and mixed profile. Sections range from 30 to 1250 m, with a mean 377
length of about 350 m. Table 4 presents the information for each section. The number of sections per 378
type of correspondence (T+, F+, F- and T-) is counted from this table. They are summarized in Table 5. 379
The first column of Table 5 presents the correspondences between the column “detected by IRIP 380
condition 1” and the column “selected for works” of Table 4. The second column presents the 381
correspondences between “detected by IRIP condition 2” and “selected for works”. Then POD, FAR, 382
and Chi-Square are computed for each column. For condition no. 1, the less binding, a score of 100% 383
of POD is obtained, which means that all the sections detected by the IRIP method are indeed 384
selected for drainage works. This POD is promising but must be analyzed with the associated FAR, 385
which is here 65%. This means that 65% of all the sections detected by IRIP are not selected for 386
works. Considering condition no. 2, which means a ratio IRIP/linear greater than or equal to 10, POD 387
remains rather high at 88%, but FAR decreases to 56%. For both conditions, the Chi-Square test 388
states that these headcounts are significant with probabilities of being due to chance of 1% and 389
0.01% respectively. To continue analyzing the IRIP method performance, the FAR percentages, which 390
are sections with a false positive correspondence, are further investigated. 391
392
45 Emb 270 no 0 5 9 yes no no
46 MP 230 no 0 14 30 yes yes no
47 Emb 100 no 2 2 20 yes yes yes
48 MP 80 no 0 0 0 no no no
49 Emb 110 no 2 1 14 yes yes yes
50 Exc 190 yes 0 1 3 yes no no
51 Emb 70 no 2 1 21 yes yes yes
52 Exc 200 no 0 3 8 yes no no
53 Emb 150 no 2 2 13 yes yes yes
54 MP 100 no 0 0 0 no no no
55 Emb 90 no 2 0 11 yes yes yes
56 Exc 400 yes 24 0 30 yes yes no
57 Emb 60 yes 1 2 25 yes yes yes
58 Exc 1100 yes 16 21 17 yes yes no
59 Emb 150 no 0 0 0 no no no
60 Exc 320 no 1 0 2 yes no no
18
Table 5: Number of railway sections among the 61 for each type of correspondence along with the 393
POD, FAR, and Chi-Square, for the 2 conditions for a section being detected by the IRIP method and 394
considering the infrastructure configuration or not. 395
Without considering railway configuration
Considering railway configuration Condition no.
1 Condition no. 2 Condition no. 1 Condition no. 2
T+ 17 15 35 33 F+ 30 19 12 8 F- 0 2 0 2 T- 14 25 14 18 POD 1 0.88 1 0.94 FAR 0.65 0.56 0.26 0.2 Chi-Square 7.02 10.09 24.46 27.31 396
Among all the 61 railway sections, some sections are exposed to surface runoff according to the IRIP 397
maps but they were not selected for works after the hydraulic diagnosis. Their transversal profile is 398
an embankment equipped with an aperture under the railway (for example, railway sections no. 2, 399
12 or 28). It can be considered that these sections are not vulnerable. Moreover, it can be considered 400
that if there is an aperture under the railway, this is due to the necessity to allow surface runoff to 401
flow down, and that the exposure to surface runoff is effective. Railway sections with this type of 402
configuration, embankment and aperture, can thus be converted from false positive to true positive. 403
New correspondences are computed and are presented in the two last columns of Table 5 along with 404
their POD, FAR, and Chi-Square. The result is a decrease of the FAR, from 65 to 26% for condition no. 405
1, and from 56 to 20% for condition no. 2. It is also interesting to notice a very high POD of 94% for 406
condition no. 2, which is the most binding one. The Chi-Square tests state that these results are 407
statistically very significant (24.46 and 27.31). Explanations for the false negatives and the remaining 408
false positive are provided below. 409
3.1.1. Analysis of the false negatives and the false positives 410
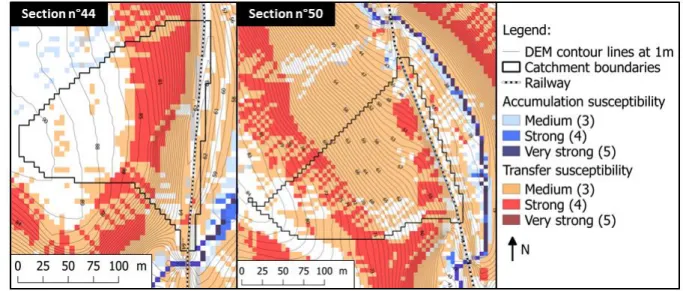
First, we will focus on false negatives, which are railway sections no. 44 and 50 (Figure 5). Railway 411
section no. 44 is a deep excavation up to 15 meters high with woody vegetation. This earthwork is 412
considered to be fragile and is subject to particular attention since an important landslide occurred 413
on the left side. During a field visit, water stagnation was observed on the tracks, and the current 414
draining ditches were clogged by mud. These explanations actually fit with the IRIP map. Transfer 415
susceptibility levels of 4/5 are located all over the left side of the excavation, where the landslide 416
occurred, and accumulation susceptibility levels of 3/5 are located on the tracks where water 417
19
stagnation was observed. The other example, railway section no. 50, is an excavation up to 3 meters 418
high and with an upstream surrounding of wood and grassland. This section was selected because a 419
few shallow landslides have occurred on the left side. The hydraulic diagnosis stated that the 420
landslides could have been influenced by rabbit holes. This can indeed aggravate consequences when 421
surface runoff occurs but also can induce landslide by itself. It has been decided to create open 422
ditches to help evacuate water. This earthwork has a transfer susceptibility level of 4/5 computed by 423
the IRIP method. These examples show that, in some cases, high susceptibility levels of transfer must 424
be taken into account not only when they are directly located on the tracks but also when they are 425
on the earthwork sides. Moreover, in the case of railway section no. 44, accumulation susceptibility 426
levels of 3 could also be considered for water stagnation issues. These two cases fit globally with the 427
IRIP maps, but do not satisfy any of the two conditions stated for a railway section being considered 428
as exposed to surface runoff according to the IRIP method. These cases illustrate how the IRIP pixel 429
configuration along with their susceptibility levels could indicate an exposure to different types of 430
surface runoff impacts (landslide, water stagnation, mudflow, flood…). For example, the quantity of 431
stagnant water could be verified in the field to propose an eventual relationship with the IRIP 432
susceptibility levels. Further tests should be performed to go further with this suggestion. 433
434
Figure 5: The two false negatives correspondences, where the conditions to consider a railway 435
section as exposed to surface runoff, according to IRIP, are not satisfied but where regeneration 436
works have been recommended. 437
False positives represent 12 railway sections with condition no. 1 and 8 railway sections with 438
condition no. 2. These false positives mean that the IRIP method detects an exposure of the railway 439
to surface runoff but that no regeneration works were undertaken. Among the 8 remaining false 440
positives with condition no. 2, two of these railway sections (no. 17 and 61) are train stations and 441
20
they present low vulnerability according to the hydraulic diagnosis. They have large areas able to 442
store eventual water stagnation and are protected by large ditches. Railway sections no. 5, 19, and 443
21 actually present very small catchment areas, of 8700, 5400 and 4900 m² respectively, and 444
according to the diagnosis, railway tracksides would be large enough to store and evacuate the 445
quantity of water that could be generated by these small catchments. Railway section no. 42 446
presents a very high degree of exposure to surface runoff according to the IRIP method, but it has 447
not been considered for works. This section has actually already been subject to particular 448
modifications because of flooding problems. These modifications were undertaken in partnership 449
with local regional organizations and the railway section has been equipped with a large aperture 450
under the railway and a retention basin. So it can be considered that the section is effectively 451
exposed to surface runoff but that it is sufficiently protected and thus less vulnerable. Railway 452
section no. 25 was considered as less susceptible to landslide during the first field expertise, with 453
observed traces of past shallow landslides maybe due to rabbit holes. But, this railway section has 454
been retained for further analysis and thus was not selected for regeneration works. Finally, railway 455
section no. 46 presents high susceptibility levels of surface runoff transfer according to IRIP but the 456
hydraulic diagnosis does not mention particular exposure to surface runoff. It would be interesting to 457
get more details thanks to a deeper field analysis. 458
This quantitative comparison between the IRIP maps and the diagnosis results makes it possible to 459
show the global performance of the IRIP method to detect railway sections exposed to surface 460
runoff. Results are promising but show there is a need to focus on specific sections to better 461
understand the meaning of IRIP detection (or not) in view of local configuration, and to improve the 462
correspondence between runoff hazard assessment and selection by experts of railway sections at 463
risk. The analysis must be pursued with a qualitative comparison at the catchment scale in order to 464
better assess the contribution of the IRIP maps to understanding the environment surrounding the 465
railway. 466
21 3.2. Qualitative comparison
468
3.2.1. Railway section no. 9 469
470
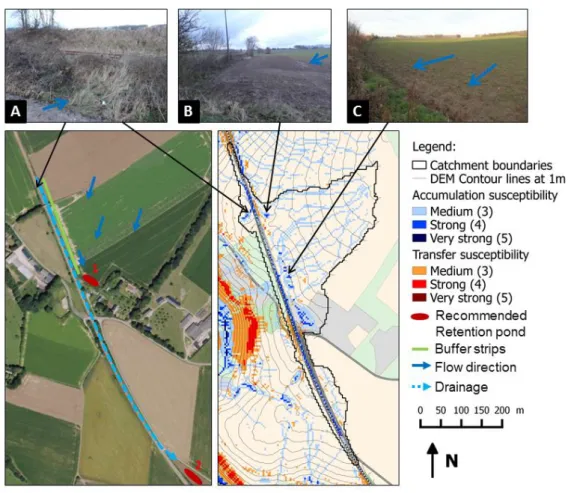
Figure 6: Comparison of the IRIP susceptibility maps of surface runoff transfer of accumulation with 471
the hydraulic diagnosis for railway section no. 9. 472
Figure 6 presents a 940 linear meter-long railway section, established in an excavation. The map on 473
the left-hand side shows the measures recommended by hydraulic diagnosis. The dashed blue line 474
represents the section which needs work, the dark blue arrows represents the directions of the 475
preferential surface runoff paths observed in the field. The green line represents the location for the 476
installation of a buffer strip, made with grass or hedges, to slow down surface runoff and to stop 477
mud accumulating on the tracks. The two red spots show two solutions for installing a retention 478
pond. The first location should retain surface runoff before reaching the tracks. The second location 479
should receive surface runoff after having been drained along the track sides in order to avoid 480
problems downstream. The map on the right-hand side shows the three highest levels of storm 481
runoff transfer and accumulation susceptibility. The black line represents the catchment boundaries, 482
that is, the area from which the railway section can potentially receive water from precipitation. 483
First, the IRIP map shows a high susceptibility to storm runoff accumulation on the tracks, with the 484
22
dark blue pixels, which is consistent with the choice of the section selected for works. High 485
accumulation susceptibility can also be retrieved at the edge of the excavation which is consistent 486
with the recommendation of installing a buffer strip and with the photos from the field, which show 487
signs of moisture and mud deposits (photos B and C). One can also see a wider area of storm runoff 488
accumulation at the location of the first solution for the retention pond, which let us state that it 489
could be a better solution for protecting infrastructure than no. 2, which was designed for improving 490
the situation downstream of the railway. The directions of the preferential paths for surface water 491
identified on the field are retrieved on the IRIP maps with levels of accumulation of 3 and with far 492
more details. Moreover, in the northern part of the railway section, on the left-hand side of the 493
railway, a very small catchment is detected (photo A) with a high susceptibility to storm runoff 494
accumulation. This susceptibility is confirmed by the photo A and by the aerial photography which 495
show mud deposits. At this point, the railway is established in a small embankment and is not 496
equipped with any hydraulic system which makes the railway vulnerable to storm runoff. This point 497
can be considered as at risk although the catchment is so small that significant water inflow is 498
unlikely. Finally, the IRIP maps agree with the diagnosis and provide more information in the 499
environment upstream of the railway. 500
23 3.2.2. Railway section no. 33
502
503
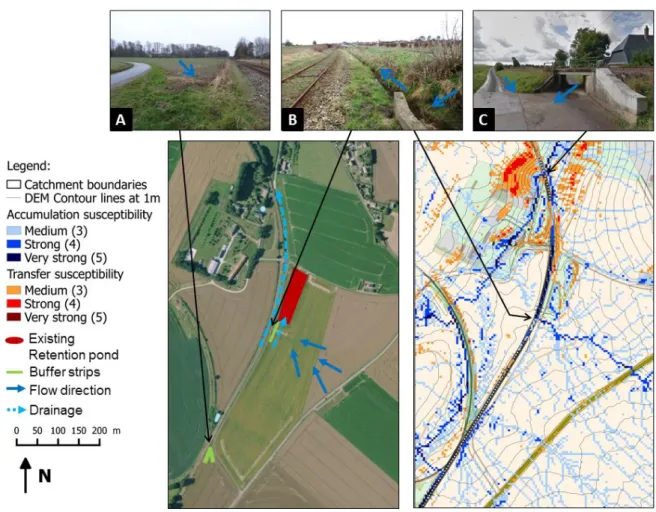
Figure 7: Comparison of the IRIP susceptibility maps of surface runoff transfer of accumulation with 504
the hydraulic diagnosis for railway section no. 33. 505
Figure 7 presents another railway section of about 800 linear meters. The section is established at 506
ground level in the southern part, in an excavation in the middle part, and on an embankment in the 507
northern part. On the left-hand side map, two recommendations for installing buffer strips are 508
indicated with the green lines and the red square indicates an already existing retention pond. On 509
the right-hand side map, a main path of storm runoff arriving on the railway from the right hand side 510
is detected by the IRIP map of accumulation susceptibility with levels of 4 and 5, a part is flowing in 511
the retention pond and another part is flowing in the drainage system along the railway (photo B) 512
which is consistent with the flow direction observed on the field and the selected railway section for 513
regeneration works. Regarding the significant size of the catchment intercepted by the railway 514
(about 1.2 km², too large to be displayed but computed on the map), the drainage system capacity 515
might not be sufficient considering the potential storm runoff inflow. The regeneration works only 516
consider drainage works explaining why no solution for installing a hydraulic structure crossing the 517
railway has been proposed. However, building a crossing structure at the intersection with the main 518
24
surface runoff path could be interesting. According to the IRIP maps, the natural surface runoff path 519
is not to be intercepted by the railway and redirected toward the northern direction, but is to 520
continue on the other side of the railway and to connect with the important water flow path 521
downstream, indicated with high accumulation susceptibility levels. The question can be asked 522
whether the railway infrastructure manager is responsible for the management of the entire volume 523
of surface runoff coming from the upstream catchment or if it is responsible only for ensuring its 524
natural flow from upstream to downstream. Here, a risk of drainage ditches overflowing can be 525
expected. Such an incident could generate floods on tracks, erosion of the railway platform and 526
erosion of the embankment at the exit of the longitudinal drainage, near the higher levels of storm 527
runoff transfer (photo C). At another location, on the southern part of the railway section, an 528
important surface water flow path is detected by the IRIP map: it corresponds to the 529
recommendation for a buffer strip (photo A) but no particular flow direction has been indicated. 530
Particular attention should be paid at this location which is exposed to surface runoff inflows. The 531
IRIP maps reveal the storm runoff spatial organization in the surroundings of the railway. Such 532
information can considerably support hydraulic experts in designing solutions to protect the railway 533
from storm water inflows. 534
25 3.2.3. Railway section no. 35
536
537
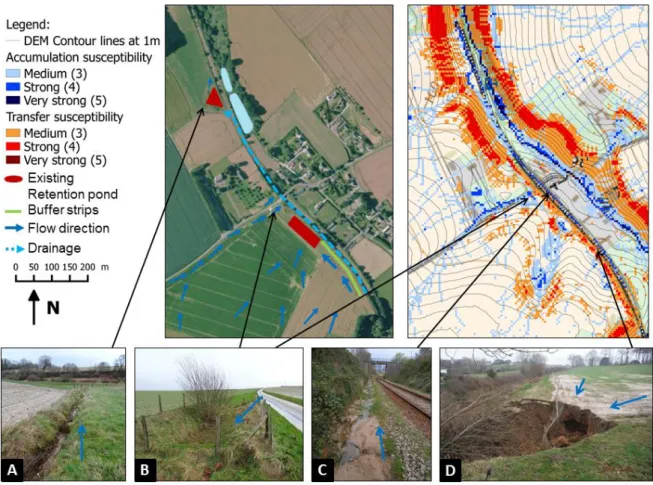
Figure 8: Comparison of the IRIP susceptibility maps of surface runoff transfer of accumulation with 538
the hydraulic diagnosis for railway section no. 35. 539
Figure 8 represents the third railway section. It is 1150 linear meters long and is established in an 540
excavation. The catchment intercepted by this section is located in the left-hand side, with several 541
storm runoff flow paths arriving perpendicularly to the railway. The important flow path, on the 542
right-hand side, flows northward laterally to the railway but downstream. Anyway, the small town on 543
the aerial photography and the downstream cities are frequently impacted by pluvial flooding. That is 544
why two large retention ponds (light blue patches) can be seen on the northern part – they have 545
been built by the agglomeration. Concerning the railway, the IRIP map presents strong accumulation 546
susceptibility levels all along the section, meaning a high risk of track flooding (illustrated on photo 547
C). Within the catchment, the flow directions indicated on the IRIP map agree with those observed in 548
the field. Two already existing retention ponds belonging to the railway company protect the railway 549
from storm runoff inflows. A small retention area has been set up to limit water coming from the 550
road (photo B). However, on photo D, there were no protective structures and a landslide of the 551
excavation occurred. This incident was due to a water stagnation area at the edge of the 552
26
embankment (mud deposits can be seen on the photo), which weakened the embankment, and a 553
storm runoff inflow (small flow path upstream) on an area susceptible to runoff acceleration (orange 554
and red pixels), which generated a landslide on the embankment slope. The deposit of materials on 555
the tracks is a major risk of collision for a train, leading to a derailment risk. This location is 556
recommended for installing a buffer strip which reflects this particular sensitivity. Along this railway 557
section, this is the only location where the IRIP map indicates alternating patterns of high 558
susceptibility to accumulation and transfer in the direct surrounding of the railway and where there 559
is no protection. The other areas with high transfer susceptibility are farther away from the railway, 560
or not directly linked with an important flow path. Finally, on this Figure, a lot of information is 561
provided by the IRIP map, and an assessment of the local railway configuration is essential to identify 562
locations at risk. 563
3.3. IRIP maps interpretation guidelines 564
The comparison between the hydraulic diagnosis results and the IRIP maps shows a good agreement 565
of areas exposed to surface runoff and areas with recommended works inside and outside the 566
railway right-of-way. This allows the extrapolation of some patterns of surface runoff spatial 567
connectivity with the railway infrastructure. Here are four examples of configurations of hazards and 568
vulnerability which lead to considering a railway section as being at risk. First, high accumulation 569
levels located on rail tracks could mean a risk of flooding if the railway is established in an excavation. 570
Secondly, high accumulation levels at the ridge of an excavation are a sign for potential surface water 571
stagnation and could generate a risk of a landslide of the excavation slope by material saturation of 572
water. Thirdly, high transfer susceptibility levels on the slope of an excavation could indicate a risk of 573
landslide if the transfer area is related to a surface water flow path indicated in the accumulation 574
map. Fourth, a surface water preferential path crossing a railway embankment transversally is a risk 575
for embankment backfilling and destruction, so at those locations experts must ensure that an 576
aperture exists within the embankment (for example a rail bridge as illustrated in Figure 7, photo C). 577
3.4. Summary and limits of the comparison 578
This study presents two degrees of evaluation of the IRIP method: a statistical analysis and a spatial 579
analysis. The spatial analysis shows the agreement between the IRIP spatial information and the field 580
observations. The statistical analysis shows that the IRIP method is an efficient tool to detect railway 581
sections exposed to surface runoff for relatively long linear distances. For the quantitative analysis, 582
two conditions have been tested for considering a section as exposed to surface runoff or not, one 583
permissive condition and one more binding. Moreover, we attempted to take the structural 584
vulnerability of the railway into account, considering that embankments with apertures under the 585
railway are configurations with low vulnerability. Considering that apertures are indicators of surface 586
27
runoff occurrence, these configurations are changed from false positives to true positives. Finally, it 587
makes POD varying from 94 to 100% and FAR from 20 to 26%, along with extremely significant Chi-588
Square. However, we must recall some hypotheses that were made for this study and which must be 589
taken into account in the interpretation of the results. 590
For this study, certain indicators and thresholds were adapted regarding the IRIP default 591
parameterization, such as erodibility, slaking crust ability or the thresholds of slopes and topographic 592
indexes. These changes are justified by a good knowledge of the local environment behavior 593
acquired during previous studies and discussions with local actors. However, the hypotheses made as 594
a result of IRIP method previous evaluations could be not applicable in the same way for other study 595
areas. So additional tests must be performed to confirm the choices made for this study, or to find 596
another parameterization which could better fit the comparison data, or else to analyze a possible 597
change for other hydrological contexts. Concerning the repeatability of the results, input data are 598
critical points. Indeed, good quality and high resolution data are important, but not available for all 599
territories. Among the three input data required for the IRIP method, deciding which one is the most 600
important in terms of quality depends on the objective of the study. For example, for territory 601
planning or certain technical implementations regarding mitigation, the generation map will be 602
relevant in order to know the poor infiltration capacity areas. Thus, quality of soil and land use data 603
would be the most important. For an objective of impact assessment, the maps of transfer and 604
accumulation would be the most relevant, so quality of the topographical data is the most important. 605
Indeed, three indicators out of five are computed from topography for the map of transfer and four 606
out of five for the map of accumulation. Figure 9 provides elements for discussing the required 607
resolution of the topography. It shows two IRIP maps of the same part of the study area created with 608
a meter resolution DEM (left) and with a 5-meter resolution DEM (right). The map with the 30-609
meter resolution shows the mains surface runoff preferential paths (blue), which are the main 610
talwegs along with transfer areas (orange), which are located mainly on the steepest talweg sides. 611
The map with the 5-meter resolution is the one used for the current study and shows so many details 612
that it is difficult to distinguish them at this scale. Further details can be observed on the hillslopes 613
with the accumulation map, and information about surface runoff transfer susceptibility is more 614
localized. Finally, the spatial information of the two maps overlaps globally, but provides different 615
types of information that should be used regarding the objective of the analysis. For example, an IRIP 616
map with a high resolution can be used for local analysis, and a coarser resolution IRIP map could be 617
used for very long railway stretches (above about 100 km of railway) with very large catchments, or 618
to have a global understanding of the environment behavior. In general terms, the input data 619
resolution should not be larger than the resolution of the physical phenomenon. 620
28 621
Figure 9: Surface runoff susceptibility maps created with the IRIP method on the same area using two 622
different resolutions of digital elevation model: 30 meters (left) and 5 meters (right). Although the 623
two maps overlap globally, different information can be obtained using different input data. 624
This study demonstrates the satisfying performance and the relevance of the IRIP method to perform 625
hazard assessment. The IRIP maps can make a substantial contribution to identifying railway sections 626
exposed to surface runoff and to better understanding the surrounding environment of the railway. 627
4. Discussion 628
The previous part presents interesting results about the correspondence between the surface runoff 629
maps created with the IRIP method and the results of the hydraulic diagnosis, both with the 630
quantitative and the qualitative comparison. Here, we discuss how the IRIP method can practically 631
contribute to the current hydraulic risk assessment process. First, the current process is described, 632
and then steps are identified where the IRIP method can directly contribute and where there is an 633
opportunity to push forward the current methods. 634