Vous avez des questions? Nous pouvons vous aider. Pour communiquer directement avec un auteur, consultez la première page de la revue dans laquelle son article a été publié afin de trouver ses coordonnées. Si vous n’arrivez pas à les repérer, communiquez avec nous à [email protected].
Questions? Contact the NRC Publications Archive team at
[email protected]. If you wish to email the authors directly, please see the first page of the publication for their contact information.
https://publications-cnrc.canada.ca/fra/droits
L’accès à ce site Web et l’utilisation de son contenu sont assujettis aux conditions présentées dans le site LISEZ CES CONDITIONS ATTENTIVEMENT AVANT D’UTILISER CE SITE WEB.
READ THESE TERMS AND CONDITIONS CAREFULLY BEFORE USING THIS WEBSITE.
https://nrc-publications.canada.ca/eng/copyright
NRC Publications Archive Record / Notice des Archives des publications du CNRC :
https://nrc-publications.canada.ca/eng/view/object/?id=7cb9a7ac-ed5f-4e40-ba17-95122a0929c1 https://publications-cnrc.canada.ca/fra/voir/objet/?id=7cb9a7ac-ed5f-4e40-ba17-95122a0929c1
NRC Publications Archive
Archives des publications du CNRC
Access and use of this website and the material on it are subject to the Terms and Conditions set forth at
Drying shrinkage and moisture movement in an autoclaved cellular
concrete
DRYING SHPJ NKAGE AND HOI STURE !vIOVETvIENT IN AN AUTOCLAVED CELLULAR CONCRETE
by E.M. Hoyle and E.G. Swenson
This is a report of an investigation to determine the shrinkage and moisture movement properties of a high-pressure
steam-cured cellular concrete. This material will hereafter
be referred to as cellular material セaセN This investigation was
carried out by the Division of Building Research at the request of the Canadian manufacturer of the cellular concrete.
A previous report on this material reported the
following data: 24-hour absorption; capillary absorption; vacuum
saturation; absorption at various relative humidities.
The samples specified for testing were specially cut slabs on which thermal conductivity tests had previously been
made by the Building Services Section, of DBR. These samples
had, therefore, been subjected to nrevious drying to constant
weight at 105°c. Although i t is recognized that such
prehe-ating may radically alter the volume change properties of such a material, drying shrinkage and moisture movement tests were carried out on these samples, as originally requested. Consequently they were again dried at 105 C. before testing.
It was decided to depart from existing practices and
methods of test, in Which, for example, a sample is saturated
by soakir.g in water for 24 hours followed by drying at 50 or
55 percent relative humidity. The latter condition was not
considered to be sufficiently desiccating to represent some
field exposures. Soaking for a limited period is also not
considered a reproducible procedure for cellular materials with
very high moisture capacity. It was decided therefore to use
vacuum saturation as the starting point in the Het condition. Specification B.S.2028:1953 of the British Standards Institution for drying shrinkage, for example, requires soaking
in water £or four days followed by drying at 50
!
lOco and at17 percent relative humidity. Moisture movement determinatiDn
requires resoaking of the dried samples.
Extensive study of reports by Otto Graf (1), and
others (2,3,4) gives insufficient information on volume
change characteristics of high-pressure steam-cured cellular
concretes. Furthermore, literature studies indicate that the
requirements and methods of testing for drying shrinkage and moisture movement vary widely and may be inadequate,
2
-was consequently expanded. Additional experiments were carried
out to investigate certain properties of this material which became evident during this study:
(1 )
(2)
(3)
Length change sensitivity to small moisture
changes during drying at QPUᄚセ[
Apparent growth of autoclaved samples containing moisture;
Small difference in volume change between a high-pressure steam-cured material and an air-cured product.
The moisture movement, shrinkage, and Ugrowth" of the
material were found to be very slow processes and i t was thus necessary to place a time limit on these experiments.
2. MATERIALS
The sample bars of cellular material "A'· used in the following tests were cut from 2- by 18- by l8-inch slabs on which thermal conductiVity tests had been previously made. The density of this material was 34.6 lh/ft).
Another cellular material which was cured normally,
hereafter referred to as cellular material
'·B'·,
was usedprimarily as a reference material in some of the exneriments.
Samples of cellular material
"B"
were 1- by 1- by 6-inch bars,fitted with inserts and used for volume change studies in 1954.
These samples were also subjected to drying at 105°c, Cellular
material "B" had a dr-y density of 41.5 lh/ftr3. In experiment s
on thermal expansion, bars made of mortar, haydite concrete,
and ordinary concrete, were also used for reference. All these
bars were 1 by 1 by 6 inches and were fitted with inserts for length measurements.
3.
METHODS OF PREPARATION AND TESTING3.1 PREPARATION OF BARS WITH INSERTS
Bars of セ・ャャオャ。イ material "A" were cut by ordinary
power saw to the dimensions 2 by 2 by 6 inches. Half-inch
diameter holes were drilled in each end of these bars to such
a depth that the distance between inserts would be 5
±
1/32inch to accommodate the bars in the standard comparator. The
inserts were cem6nted by a mortar made of one part of fine
sand, specially prepared, and one part of high early strength
cement, and mixed to a creamy consistency. The base of each
insert rested on the bar material so that the cementing material would not be involved in length changes.
The size of the bars was selected for convenience. It
3
-have a bearinc on the results obtained insofar as rates are concerned.
3.2 DRYING TO CONSTANT HEIGHT
After curing the cementing material for one week, the bars were heated in a forced draft oven at 105°c. to constant
weight and length. The bars were cooled in desiccators charged
with magnesium perchlorate.
It was soon found that appreciable linear volume changes occurred with very small gains or losses in moisture
from the nominal dried state. The constant weight and length
values taken were subject therefore to some degree of error
or variation. It was found that a 24-hour heating period
was sufficient providing no accidental moisture gain occurred. Attention is again drawn to the B.S. Specification 2028:1953 in which the method of cooling, after oven drying
at 50 セ 10C., requires placing the samples in a desiccator
containing solid calcium chloride or a saturated solution of
calcium chloride. This 。ーー・セイウ to cause serious discrepancies
in the dry values for sensitive materials like cellular material
"A".
3.3 VACUUH SATURATION
Vacuum saturation was achieved by an apparatus con-sisting of a vacuum pump connected, through double traps of calcium chloride, to a large vacuum desiccator by means of a
two-way stopcock. The latter was connected to a distilled
water supply by tubing previously filled with water. After
evacuation of the dry samples the vacuum system was shut off
and the water introduced to a level just below the top of the
samples. Following a period of several hours to allow water
to penetrate, the samples were completely covered with water
and allowed to stand for at least one day. The percentage
of water was calculated from the difference between the surface dry weight and the original dry weight.
Another procedure was found to be just as effective for this material, that of using a tap aspirator operated
from the water line. A cycling technique was used and the
values obtained were comparable with the first method. Readings
of volume and weight changes were taken three days after the sample was first wetted and thus constituted normal vacuum saturation procedure.
3.4 CONDPrIONING AT PRESCRIBED rvrOIS'I'URE CONTENTS
The "wetting series" involved the adding of calculated amounts of water to the dried samples by soaking and aspiration,
4
-air was evacuated by mouth, to collaDse the bag around the sample
and the open end then secured by a clamp. These samples were
left sealed in this fashion for about six to seven weeks at
72
to
75
0F . until constant length Has obtained. Because of a verysmall vapour loss through the nolythene bags, weiGht constancy
could not be achieved. The moisture content was calculated
from the weight at each selected time for constant length.
In the "drying series", the bEll's were dried from the
vacuum- saturated condi ti on by exoosur-e to laboratory condi ti ons
(72
to75°R
and20
to30
percent relative humidity), using afan. This was sufficient to dry down to the lowest moisture
content required. The bars were then placed in double
Doly-t.ne ne bavs and conditioned in the same manner as the "wet t Lng
series" to obtain equilibrium conditions.
3.5
CONDITIONING AT VARIOUS RELATIVE HUI'1IDITh,SEighty percent relative humidity was obtained by
means of a specially built box re0ulated by an electronic
controlling 。dセ。イ。エオウN This aDparatus operates, altern8tely as
required, a humidifying and dehll.111idifyin:- chamber by means of
an Aminco-Dunmore cell and electronic relay. The system was
buffered with a saturated solution of aim.on Lum suLphat e and
the air was stirred by a fan. Regular wet- and dry- bulb
readings gave values'of
80
i
Ii
percent relative humidity.The temperature in this chamber was constant at
75°F.
A condition of
50
percent relative humi.dl t.y Hasobtained in a controlled hluuidity room ッー・イ。エ・セ nt
50
セ 1ner-cent r-e Lat(. l ve humf.d Ltr'J. . -' • andc.L _ " / ' ) 0 ', L , /.' 1 . ,GZZ[ᄋョゥャNGセN1_" •..セ ' . '.• - •.!., Y'''I('Y''.• ' I I , "C)l-,n-n' ..._ ... , .I ' : · ,.J -...J \ LGセエ.A
10
:!:
3
percent relative humic!ty ano '(c:!.u F'.3.6
LENGTH AND HEIGHT TvIEASUREI,IL-:NTSStandard length comparators were used, with an accuracy
of 0.0001 inch. Reproducibility was in the order of 0.0001 to
0.0002
inch. A standard reference bar Has used during allmeasurements, which were セpP・ at room temperatures varying from
7')/{_ toセBM 7')0"_,.L. .. " 0 l "LGェセセ GセLエウ '-'orp i-<",nn to 1-'}(, ne ar-o st 0 1 -'r"m
I _ J I . ;'j ...j , . ) ( , , - , , - . - , _ _ -,, i . , .. " J ; - . , - ' o . J U セ ... lセス Cl io
1:. .:.:, , - L「セ
r
BヲNAfセjL⦅イヲR 1\Ii.n.v
ゥ|NセᄋG[t セ -.TNャセZgtjセセI :.;TOl-r_."'-"-- ..•
.--,-_._---The sam-ole e wer-c (]ried to cons tant length, this being
the nractice required by the B.S. Specification
2028:1953
forprecast concrete blocks. Constant Height usually followed as
a matter of course. It was found that evon very slivht0,' , _ )
moisture gains after drying, resulting from exposure during
handling or from a lowered efficiency of the desiccant, were reflected in considerable lenp:th changes in cellular material
5
-"A" s oe cLmen s , From exper-Lenc e it '"Jas f':lunc' that 21f hours
wa s suff' ic ient fo r drying: to minimum Lerig th arid Height , but the extreme sonsitivity of linear chane to moisture made it necessary to rene at daily drying and measuring for about one
week. Dry weights and lengths were 81so extremely sensitive
to small variation in the drying temperatures.
Ff.gur-e 1 shows the effect of such small moisture
ch arige s on the lengths of cellu.lar mat e r-La I "A" bars. 'I'hes e
results emphasize the importance of rigid control of
techn-iques of dryinc to constant length and Height for such materials.
The B.S. Specification (2028:1953) requiring drying
at 50 セ 100. and 17 percent relative humidity (over-saturated
c a.Lc Lum chloride) is probably de s l gne d to prevent the danger of
phy s Lc a L c hange s in the material wh Lc h may occur in 1050c . , and
which may change absorption セイッー・イエゥXウN The samples of cellular
mat e r-La I
"A"
on wh i.ch tests Here oricinAlly requested hadpre-viously been heated to 1050 0 . , and this rnater-La I had been cured
under hieh pressure steam conditions. For these reasons, a
different procedure wus followed in エセ・ present tests. Saturated
calcium chioride at 5000., is expected to provide a relative
humidi ty of 17 Dercent in the procedure outlined in the B. S.
Specification but wou Ld give a relative hum.i.d L
t:r
of about 35-oercent at 18.500. - the approximate temperature of measuring
Le ngth s ,
!+.2 SLO\'J' GRO\JTH OF VACUUN-SA'rTJRA'rED saiカiplェセs
'I'vlO 2- by 2- by 6-inch bars of cellular material "A"
wer-e Lmme r s ed in water except for the top Nセ inch. Vacuum was
then applied by aspirator for 3 hours, broken for セ セッオイL again
as pi r-ate d for 3 hours, anri f Lnal.Ly left imrnersed ov..r-nl ght at
normal air nressure. This procedure was repeated four to five
times Der Heek for about six weeks. The samples Here measured
and weighed periodically. The gradunl growth of these samnles,
as distinguished from the normal length increase セオッ to moisture
content, is shown in Fig. 2. The actual increase in expansion
Dbove the normal vacuum saturation value is 23.9 percent for a
J.12-day period, and appears to continue at a diminishing rate.
Figure 2 also shows the gercent increase in moisture content over this neriod.
The lack of reproducibility in tho vacuum-saturated moisture content data is due to the inherent difficulty in reproducing saturated surface dry conditions.
It was first assumed that the growth was caused by
mech ani ceI extension of the s amp Le due to ne r-LodLc :jPD1ics.tlon
of v ac uum , 'rho slight increase in moisture content j;; not
com-patible however, with the considerable growth. The truo
6
-into the finer gel pores of the hardened cement paste.
Sub-sequent results indirectly bear out this hypothesis.
4.3
voluiセ CHANGE AT VARIOUS MOISTURE CONTENTSSeventeen cellular material ItA It bars fitted with inserts
were dried at
105°C.
to constant weight and length. Seven ofthe bars were used in a wetting series test and the remainder in a drying series test.
directly contents values. and then moisture
In the wetting series, water was added to the dry bars
by pipette, or by soaking, to give a range of moisture
from about
5
to about 90 percent of vacuum-saturatedIn the drying series the bars were vacuum-saturated dried in the open laboratory to obtain a range of
contents from about 90 to about
5
percent.The bars so adjusted were ゥセセ・、ゥ。エ・ャケ sealed in
double polythene bags and stored at room temperature for 6
weeks to attain equilibrium. Measurements of length and weight
were taken at
6
and7
weeks. Determinations of moisture movementand shrinkage for cellular material nAil were made first at 8
weeks and finally at 6 months.
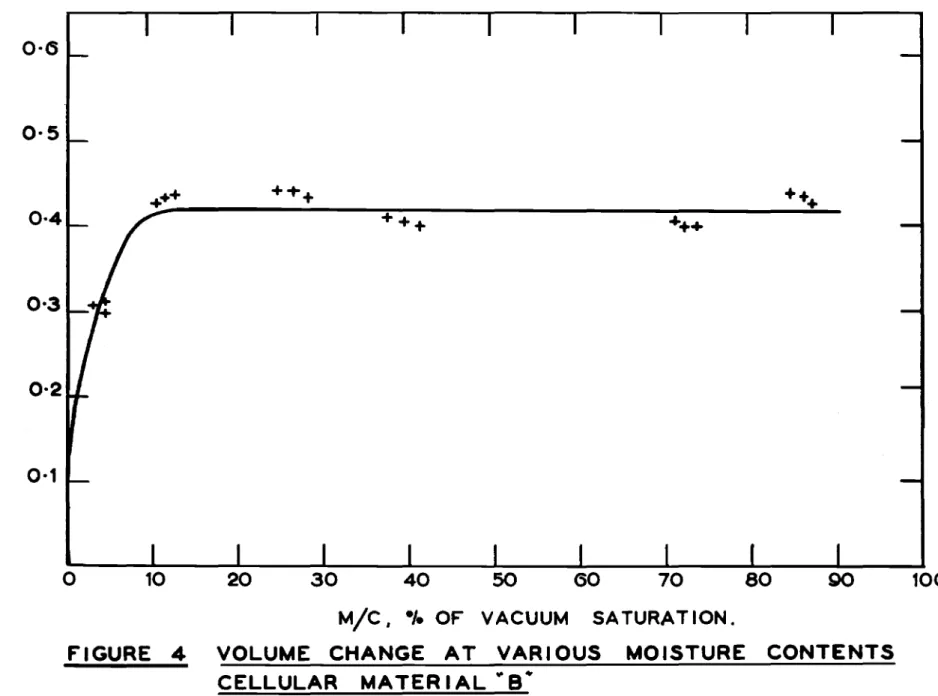
For purposes of comparison a wetting series was
car-ried out on cellular material "BII
•
The data are recorded in Table I for cellular material
"An and in Table II for cellular material ItEn, the latter based
on two months' measurements only. The plotted values for the
two materials are shown in Figs.
3
and4
respectively.For cellular material "A" the initial wetting series gave a length change considerably greater than the corresponding drying series.
To check this anparent contradiction, selected samples
from both series were re-dried and their cycles reversed.
These samples, together with the uninterrupted samples, were
finally weighed and measured after approximatel
b
six months.Following this they were all dried again at
105
C.to constantlength and weight. The final length and weight were considerably
different from the initial oven-dried values.
The calculated values of drying shrinkage and moisture
movement, as shown in Fig.
3,
indicate that volume change is,in general, independent of the method Whereby the various
moisture content conditions are obtained. The exception appears
to be the initial wetting series, which may have received a slightly more severe initial heating.
7
-The differences in percent volume change calculated in
initial dry Heights and final dry セNLイ・ゥlャャエウ are quite ma r-ke d ,
sUG[esting that heating and wetting treatments affect subsequent
volume changes (Table I).
The value of drying shrinkage and moisture movement for
cellular material "A" over the 5 to 90 percent moisture content
ranges is, therefore, a minimum of
0.3
percent, and is probablynear 0.4 percent for untreated samples of this material. The
value obtai ned for cellular material "BIt was 0.41 percent.
4.4
DRYING SHRINKAGE AND MOISTURE MOVEMENT AT VARIOUS RELATIVE
HUMIDlrrIES
Two series of cellular material ftAft
bars were subjected
to relative
humidities of 80, 50 and 10 percent, with two orthree bars at each condition o
In the wetting series, the bars were first dried to
constant length, then placed in the various conditions of relative
humidi ty for determining moisture movement. Lengths and weights
were measured periodically until a/parent equilibrium was
reached, usually in about
6
weeks.In the drying series, the bars were vacuum saturated,
then placed in the various conditions of relative humidity for
drying shrinkage determination. 'I'he d at um for this series was
the セイ」・ョエ expansion after 42 days in the vacuum-saturated state
in order
to
include the Zセッキエィ factor described in (b).The data are given in Table III. Figure 5 shows the
considerable hysteresis between the wetting and drying series which is similar to the hysteresis observed in the next section
on moisture content versus relative humidityo
Since the growth in the samples was not complete at
42 days, the drying shrinkage shown in the data is somewhat
less than the absolute value would be.
Figure
6
shows a very simple relationship between thelogarithm of relative humidity and percent expansion for both
the drying and wetting series for periods of time 「・セッョ、 11 dayso
485
MOls'rURE CONTENT
AN"])RELATIVE HD:"IIDITY
rヲNセ[iniQi ONSHIPSThe data in Tables IV and V on the relationship between moisture content and relative humidity are derived from the same tests carried out for shrinkage and moisture movement at relative
humidities of 80,50, and 10 pe r-c ent , These data are p Lot t.ed
S
-The hysteresis between wetting and drying appears to
increase Hi.th incre asine; r-eLat t vc hurm :' i ty (Fig. 79.) 0 The
straight line relationships in Figs. 8a and Sb, plotting the
Loga rLt.hm of moisture content against relative humidity, appears
to indicate a simple r-elatioDship between these two conditions.
In Fig. 7b 1s plotted the decrease in moisture content
with increase in pF, based on suction determinations. This
shows that a very slight drop in relative humidity (from 100 to
99092
percent) corresponds to a loss of nearly 60 percent of thetotal moisture that the material is セ。ー。「ャ・ of taking up. The
wetting nortion of this curve was net determined for cellular
material· "All, but with cellular material HB" there was found in
previous tests to be a very pronounced hysteresis in this region.
During this investigation i t was observed that the
initial oven-dry length could not be reproduced.after intermediate
wetting. An irreversible expansion had occurredo This is
illustrated by the data in '}'able VI.
Since all oven drying Twas done セ⦅ョ a f'or c ed draft oven
at lOsoG. this irreversible length change was recognized as a
function of the wetting and dryinG cycle, and not as a result
of fluctuations in the c"eg1":,e of drying. From thi s i t follows
that the magnitude of shrink2[!e and molsture ュッカ・ュ・ョエセ expressed
as a difference between wet and dry lengths: would decrease
wi th the number' of cycle s , This is true senerally for
cement-itious セイッ、オ」エウN
Superimnosed upon this irreversible lenpth change due
to ovening is the slow growth of cellular material
"A"
in-themoist state.
For cellular-type materials it would appear necessary to develop a nrocedure to determine drying shrinkage and moisture
movement on samp Le s not pr-evLo us Ly conditioned in any way.
Actual calculations would then be made on data obtained from
companion specimens which had been dried in the c onverrt LonaL
manner.
セ⦅N 70 1 Dry Stateon Bars of cellulnr rnat er-LaI t',.'\'1 dried to
constant length and wo lgnt wer-e measured at lOSOG., cooled to
5
0 G•. ano-J 8 aBlYl• .measure.d \,omnara t.v e c.e er-nn na .a on s were ma cer< t · ,t
.
t l ,j G セ L
on bars of cellular material
"B'",
mortars c onc r-e t.e , and haydi teconcrete. The calculated coefficient8 of bhe rmal, .sxpan s l bn in the
'I'he s e da.t:B. セQ re
Lt n705 'I'her-maL Expansion at Var101.:Ls i\ioistUI'EO cッョエ・ョエウョセ The bars
セ セャャセセNtセセGQBヲaセセZ\[\セイM、セMiiBLLセLLMLMLM。jLᄋ BGヲMBエセGエBB、MBGセセイMイ]ZZ[BセMセセセZQセセ] ..., dO
0.:. 」ᄋセNL u i a r rnavel le-..:.. l.L·U .in -"0., ,,_.1 '''l.d..:l:1 n a o o e e n c o n : 1<=
tioned in double pclythene bag3 。セ various moisture 」ッョエ・ョエウセ
(1) by adding moisture to oven-dried samples [キ。エセゥョァ series)p
and (i1) by dryi.ag I'rorn the vacuum-ss at ur-at ed st ate in the open
laboratory
t
dry:Lng series)i' "';El::"e cooLed to SoC. and heat e d to55°c.
resnGstivelY9 in each case length and weight measurementsbeing taken"
Pfter on ini::.181 condition:i.nr" period these samples
were weighed and mea sur-e d about onee a week for six weeks by
whi.c h time appar-e nt equi LtセjjBャQIュェ。、 been r-eac.hed0 The grmvth
or e.xpans l.on previously obs erve c had dLrai.nishe d to snch a
degree that it was po s s Lb Le to nredict9.cGc.U:'f-lteJ,y any Lncre a s e
in length with time. Below a certain moisture 」ッョエ・ャGセd however;
small lOSSeS in moisture エセャZゥGイIセ⦅Lセィ the DO:.ythene b22)3 resulted In
definite cecPGases Iii Lerigtn as wou:u':i. oe eX'j,3 ted . s ee 403).
These changds FセR セイ。X・、 in Figs. 10 and II for
cellular mater-LaI JlA[ゥBセLョ 1;')1'1iGh t.n0 percent expansion is
plotted against t.Lme " and :In:·,'h'"_:,h. l.he vo Lurne oharige clue to
」ッッQQセァ and heating is showno
In Fig. 10, for SXセョQXX with moisture contents from
approximately ・Zセ to 9 r)Clcent" i,',1)··1 tc i:J··5) the thermal expansion
is unlf'or-m , At 101.vcr moi.stur-e contents" as in QイNェセLVN small losses
in rnoi.st ur-e nr-oduc e a c or.si de r-abI.e decrease in lengths thus
count er-act l ng anY' t ne rme l expens:!.o!:l in th9 met e r t s L, The datum
for this fieul's 1;-Jas c st ab l lshe d .cLt 710Fnr 2l:d ZSZZGュセLjN。イjNNケ for
subS G Cll18n t f 1{Z|ャiセ・ So
In FiZ0 11,; for the d:r'y:1.n'." s e.ru e s f""()lil 1)··1 tel ョMセL
the t.her-ma; expansion VUl1JAS Dr-O
L!rlf";;;ln
BセSZ[ゥッセセ
;bout 'U'/')G;'GeJltmoistlIT8 」」セエgョウGセ d」セLUセ the ncrnsl 、Aセケ ウィLイゥョャセZョセS n gヲヲウ・セ
the t.her-meL eXDaY131ori ,
:n
ァVョ・イ・ャセ for both materials. the thsrmal coefficienti s L n d epo n d en t o i' t e-nper - a. .c u r - e {セZM・。、ゥ・ョLエ v l J " lth i , n エィᄋZNセ l"'ange o ba e r-ved ,
5°0.
to :1'.5')Co It is a l s c i!iCle.peflc=te11t of mo ' st.: ..QQセ・ cont ent T,'lfithirlthe foL'lowLnrr limLt s : for XウQセNャajNXNイ イョ。セXイゥ。ャ "-A.'I ,. about Go percent
tuc cャNNセInl'C1.J"'_\,.! 41-,;:'·'r·-':.n+:, J " J . L -..JV J U 9 . ! . . . l . 18 ....(0 _L '--.'.f'cr (...r.e.L...Ll.A. ...Tlulorc : LNLッBエ・ャGャLセBQJ.lltJ _ ....-".J セャᄋッゥエ ; ) . t :... '1'00. MセョBB[ZG・ョᄋGBrJc:-.L ... ..I.. V
inde-- 10 -pendent of drying or wetting.
In summary, the coefficeints of thermal expansion
for cellular material
"A"
are as follows:bone dry
5.2
x 10-6
in • .Ln.
j"/0,
.L'.4
to 80%M/C
5.6
x 10-6
"
V8.c. sat 'd.
6.4
x 10-6
"
5.
SUBJ"IARY AND COI1IrIENTSThese experiments deviated in one resDect from most
work in the field, in that the datum for moisture movement and
drying shrinkage was taken from the constant length determined
at the oven-dried state of 105°c. Owing to the previous history
of the materials tested, such a course would seem to be
reaso-nable, but due to the irreversible length changes evolved by such severe drying and small moisture changes at near zero
moisture content, a datum based on dry lengths is obviously
unreliable. This is well illustrated in Fig. 1 and in sections
4.1
&
4.6
of the report.As an alternative it would appear that a datum based
on vacuum saturation length values would offer a more stable
result yet in section
4.2
it is shown that very large lengthchanges take place with time at this condition.
Section
4.7
and Figs. 10 to 13 show that lengthequilibrium is not achieved at intermediate moisture contents
over a wide range. The rate of change is, however, smallest at
such moisture contents. The datum for cellular concretes should
be established from the most stable condition possible, and this
would confine the selection to preconditioning at either a constant relative humidity or a constant degree of saturatiou.
セイッュ section
4.3
the shrinkage and moisture movementvalues at various relative humidities are similar, in the case
nf' cellular material
"A",
though length equilibrium requiresa waiting Deriod of about six months. The moisture contents
referred to in
4.3
are almost all in excess of the moisturecontents corresDonding to relative humidities as high as 80 percent.
The relationship between volume change due to drying shrinkage or moisture movement at various relative humidities
is per-h ap s the most relevant for a cellular concrete, for i t
is under conditions of fluctuating relative humidity that the
material is most likely to be used. Sections
4g3, 4.4,
and4g5
show that volume change reaches a maximum at 80 to 100percent relative humidity from oven dry and that this value
- 11
-a moisture content of
5
percent gives apnroximately the ウ。セ・volume change as a moisture content of 100 percent. There ゥウセ
of course, the slow growth wi th time uhe nomerion which has already
been discussed, and under this influence volume changes would
differ very much between the high and Low moisture content
material. Section
4.6
again emphasizes the need to ensure thatlnaterials subjected to testing do not receive excessive heating
or wetting prior to testing. It would also seem to infer that
any previous mild wetting 8Ild drying cycling Hould tend to reduce the magnitude of the volume change assessed at the time
of test. For cellular material
"A"
the vacuum-saturated moisturecontent is
134
percent of the oven-dry weight. Assuming vacuumsaturation to represent 100 percent moisture content the lnaterial can lose 60 percent of its moisture by suction methods with a corresponding drop of only 0.08 percent in relative humidity. For this large loss of moisture the volume change is practically
negligible. A further loss in moisture accounting for about
96
percent of that at vacuum saturation results in a slightvolume change. This latter condition would apply to the
moisture content at 80 percent relative humidity. Regarding
the thermal expansion of cellular material "All, experimental
evidence shows no definite variation between the dry state and a large range of intermediate moisture contents through to the
vacuum-saturated state. For cellular material "Bit there is some
evidence of increased thermal expansion at intermediate moisture
contents. In general, the values for cellular material "A" are
similar to those of other concretes while those of cellular
material !tBtt is
30
to40
percent higher (Fig.9).
It is now proposed to develop a procedure for moisture movement and drying shrinkage determination using control samples
for moisture content and dry weight. Thus the volume change
testing would be made on samples which had received no previous conditioning.
The need for such an undertaking has become obvious
from a review of the available literature on the subjecto There
is at present a marked inconsistency of opinion on what 」ッョウエセ
itutes a comprehensive procedure. Previous work has, in genera19
failed to ive information on behaviour at Low moisture contents
TABLE I
VOLUI\lli CHANGE Arr VARIOUS NOIS'rURE CONTENTS
Cellular Material "A"
... _-0-'"._,_' "-._._-....-,'....⦅MセN
---
.'--"----
...,...セNNLLセM⦅ ..セ...---INITIAL DRYING
(2
Months)
FINAL DRYING
(6
Months)
-
セM⦅N__
.
Dry Ht.
Moisture
%
EXPI:'lnsion
Moisture
%
Expansion
Reversed Cycle
gm.
Content
from
Content
from
\'1-Now hTetting
%
of Vac.
Oven Dry
1a
of Vac.
Oven Dry
D- Now Drying
Sample No.
s。エセSat.
1
237.6
SNセ
.318
1.8
NRセMT2
230.5
31.
.334
27.4
.302
w
3
225.1
62.8
.332
57.3
.318
w
7
236.8
16.8
.300
4.1
.276
8
236.9
74.8
•
SPlセ53.8
.290
9
238.7
47.2
.306
28.5
.286
10
239.1
-_.
__
88.6
....334
66.4
.292
⦅MMMセMMM⦅NBL ...セN⦅ ...セM -...,..
MLNNN⦅NGセNBNLNBBNMNM ..,セN⦅セNセBB ...Mセ ...GセNMMBGM •••セL••••• --_.-••._... , _...⦅MMMMセ ...[NMNNMM\GNセセ ."'.- -,'••• - . , _ .• , ' - _. . . • , NBセ ...- '" .. ><"'"'"" ...•••.,, .-INITIAL WE'rTING
FINAL WE'rTING
- セMMM⦅ ...
_
...'_..13
RlセSN7
2.3
.320
1.8
.254
11-1-
238.7
16.0
.368
3.4
0288
-15
242.6
16.8
.360
-
-
-16
238.3
31.9
.372
27.1
.288
D17
238,,1
34.1
• 35L
I·23.4
NRュセ18
240.0
52.7
.368
31.5
.300
I19
244.0
70 09
.392
67.0
0306
D
I20
242 08
89 .. 3
.410
84.9
.304
D It21
24-3.5
7702
0396
60.9
.296
i
22
238.1
91.7
.406
7203
.306
i • _ _ _ _. ⦅セNL ... .,___...,.,_, _ _ ,N⦅NセッNNM⦅ ... _..._ ...セ__セ N ____N⦅セ .... __,__ ...セ... _ •.セ⦅N . JTABIE
II
VOLUHE CHANGE AT
VAHIOUS HOISTURE
CONTENT'S
-CelI "
'. GLMセ MセエN・N 1.I•.dT1
Moisture Content;&
of vcc , Sat, 'II
c170 ,E -"--.xnsnSlon IFrom Oven Dry
,308
e306
.302
T3
T5
T9
T13
T16
87.8
90.093.9
97.8
12.8
11.6
10.5
28.3
26.6
24.9
41.3
39.4
37.5
73.6
72.0 71.087
0185.8
84.3
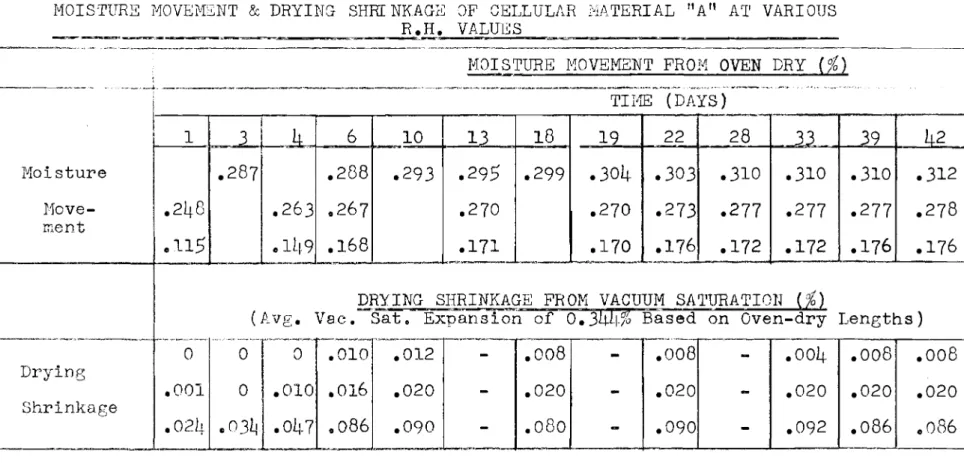
TABLE III
MOISTURE l\10VEl'-fSNT
&DRYING SHRCNKAGL<:: OF CELLULAR
セGャャ|terialIIA II
A'l'VARIOUS
セ⦅セNセN⦅セャAN
VALUES
1+.-I
R!1i.!.!
80%
Moisture Move-ment ---- .--..⦅MMMMMセLMセ⦅N⦅N⦅N⦅MN⦅N --
MMMMMMセMT>!OISTURE IVJOVEMENT FROH OVEN DRY
HHセI --: -. _ - - - . _ - _ . , . , . , . _ - _ . _ , - - - _ . _ - - - - _ . -.• __ •.•セLNNLNN ...⦅ セ ⦅ ..MMセ .._ . -...M N N N M M M M M N L ⦅ N セ ⦅ .•_ - _ .•セセ ...セ... -.,.._ ... "-,,-,>,., ••-,... ,-_ ...⦅MMMN⦅MMセ .•.. - .... ITINE (DAYS)
;I
I ャセ39
42
i
1
lL.-1L.
6
セ10
13
18
19
22
28
I
.287
.288
.293
.295
.299
.304
.303
.310
.310
.310
.312
I.248
.263 0267
.270
.270
.273
.277
.277
.277
.278
.115
.lL19.168
.171
.170
.176
.172
.172
.176
.176
-
- _..⦅iMセ ⦅セ⦅ .. _ _ _ " - - - 0 . _h . -_ _ ... ___DRl'ING SIilUNKAGE FROM
vacuumセaGiGuration ((il)(Avg. Vee.
Sat. Expansion of0.34L1-%
Based on Oven-dry Lengths)-,..---.- - - ' - " - - '
-
.008
-
.008
-
.004
.008
.008
-
.020
-
.020
-
.020
.020
.020
-
.080
-
.090
-
.092
.086
.086
.016
.020
.010
.012
---.--- ----_·_---1--' -._._..-.--
MMMMMセMMM0 0 0
.0011
0
.010
•
PRAセセ⦅N
⦅Pセ⦅GMW
...0._0_8--'6
.090
ShrinkaQ"et:» DryingTABLE IV
M!C OF CELLULAR MATERIAL ...A'" AT VARIOUS RH VALUES
Wetting From Oven Dry
Conditioned Original Stable
H!C as
M/C % H/C%
Sample
Average
Base(!on
No.
to
RHDry Wt. Moist Wt
% Dry Wt.
Of
Sample
Vac , Sac ,(gm. ) (gm. )
M!C
sIt
80%
233.0
242.6
g
=
4.12
35
80%
236.5
246.2
セ]
4.10
23
.5
311
80%
236.6
246.2
9.6
=
4.06
4.3%
3.2%
1236.6
31
80%
670.4
700.0
29.6
=
4.42
lb"(O.Lj.32
80%
759.3
795.7
36.4
4.79
1759.3
-31
50%
670.4
690.7
3.03
32
50%
759.3
781.5
2.92
3.07%
2.3%
315
50%
243.1
250.7
3.13
324
50%
238.8
246.4
3.18
Sl
22%
670.4
686.6
2.42
32
22%
759.3
776.3
2.24
2.33%
1.7%
S12
10%
239.9
RセMTNQ1.75
323
10%
237.4
241.4
1.68
1.71%
1.3%
TABLE
v
Mle
OF CELLULAR MP.TERli\L ItA' t AT VATIIOUS BEVALUES
Drying From Vacuum Saturation
Dry
In.
Hie
(gm.)%
Mle
on
%
Mle
on
'10 RH
Sample (gm. )
Dry
\tit.Vac. Sat.
s6
236.6
14.2
5.8
4.3
80
s14
238.7
13.4
25
235.5
8.9
3.75
2.79
50
18
240.0
8.8
21
243.5
5.6
2.2
1.64
10
17
238.1
5.0
TABLE VI
IRREVE:RSIBLE LENGTH CHAN GES DUE TO OVENING
セvettedSAHPLES
Cellular Material ItA n
Gain in
Gain in
Length From Length From
Wt. Gain
Wt. Loss
D- Drying
Sample
1st to 2nd 2nd to 3rd
From Original From Original
1:J-
セj・エエゥョァOvening
Ovening
G
L
Series
1
28
L 0.9
gm,D
2
25
51
L 1.0
gm,D
- w
3
23
67
L 0.6
gm,D
- w
7
12
L 0.8
gm, D8
28
L 0.9
gm.D
9
22
L 0.8 gm.
D
10
46
G 0.6 gm.
D
13
31
G 0.9
gm,W
14
42
G 1.9
gm ,w
16
43
34
G 0.4
gm,w
- D
17
36
G 0.2
gm, W18
39
G 1.4 gm.
W19
47
62
G 0.3 gm.
\-J -D
20
60
45
G 0.3
gm, 1rJ -D
21
67
G 0.8
gm,w
22
90
G 1.2 gm.
1:J -·0.5
·04
• 0 I+
/NI:>/V/PUAL;:,o/lIT5
- - - TR£NOCURVE-o
0·1
ッᄋセ0·3
M/CJ%
0/
VACUUM SATURATION0·4
FIGURE...
I
L E.N GTH
CI-l AN GE..S
of
DR IE.D CE.LLULAR MATERIAL
''I::
sセ
- - - 5
セU+
e
+ - - - -
+----+----: -
+
- - - t
-
---.J..--::..=:..l.
GZMZGZZZBZ[ᄋセMMMMMBMセMi - - I ...---
...
- . - . セ セMエG• _ _ -
+_+-
+
'T N⦅NMMセセMMM..,,--+--.
.",.,....
""
.
..,,-セセK
セセ
0'3セ
\ jセ
\!)<:
セ ...+
+
0·1
o
2 4 0 8 10 1'2 14- 1(0 18'2.0
'2'214
Rセ 78 30 3234
NSセ .3840
4'2TIM£-
IN
PAYS
FIGURL
'2
0·4
+
+
セ
++
+
+
セ•
+
•
'"'q....
セ,
e·
セ0·,3
•
A
e
•
e
e
\.l,
•
セ
e
セ
0·2
""
...
セoNi
++
•
o
o
10
'20
30
40
moiAェイオセᆪCONT£NT,
.50
so
70
80
90
%
of
VACUUM
SATU£.ATIOI'I
100
LfGfN£':• PRYING SERIL5 INITIAL
o
/I , , ; :INAL+
Qvᆪttinセ SE.R.I£5' IIVITIAL@
1/ " F I N A L@
PRYItV(; ( I NIT I ALLY
IVer)
セ rllE-TTllt/tiI
( I f '
I7J:fY)
FIGURE-
3
VOLUME..
CJ.lANGE- AT
VARIOUS
MOISTURE... CONTE-NTS
0·(5
0·5
+++
+++
+++
0·4
+++
セKK We
Z セ %0·3
u
z
l-e
0·2
z
w
-'
%
0·1
o
10
20
30
40
50
GO
70
100
M/C, ./. OF VACUUM SA TURAT ION.
FIGURE
4
VOLUME
CHANGE
AT
VARIOUS
MOISTURE
CONTENTS
'1.5. ...
MNセNN[MNセL
'80
セ
R.I-!.
--:Ju.l
.,""", ··"" __
セ⦅Nセ⦅iMM l a _ - - ' 1 ' - _ Cfl \ MNセMN⦅ I I50
%
R.J.I.-2
-( \ , - - 1'-_ MMセM .... - - - -.L _ _+-- - - - -
-!- -'- -
セMw
セMMGQGセセエ]エ]ゥZヲ]T]エ⦅tXセotEセrセN
jNiセᄋZZMLj]]Aセ]fヲヲ]ヲ]ヲ]h
a:
0·3
u
'\
1 1 1 - / 1
Z
I
"
50
%
R.II. - ;
/1---- '
'-'t"--
-1--
-t-- _.t-J_l..J_
7
1
MBGMセMセMセMiMMMᆳ
/0
%
R.I-!.
r
I:r
I-セz
aJ
..J
0·2 t---;--+---+--+----+--+--+-+--+-+----+-+---f--+---f--+---1f---+--t---+--t---t
セ
V
V-O· 1
I
2
4
(Q/0
%
R.
1-/.
' / j
IVE TTl NG
FROM
OV£N
PRY
PP'YING
VACUUM
5ATVp,ATION
8
to
1'214
16
1820
2'2
'24
'2"
2830
31
343"
3840
42
TIME...
DAYS
&R.,.,I-IfjguセeNMN
EXPANStON
CE...LLULAB
.5
4
GUGセrinkageNNN
MATE..81AL
"A"
0·4
DRYING
FPtOM
VACUUM
SATURATION
/
/
/
I
0'2
il
0·3
PE.R
CE.NT
E.XPANStON
r
0 ""'""----...-w---Io---....
セMNNNNNNiMMMMMMM
...
0·1
IVETTING
FROM
OVeN
ORY
}
/
/
セ
/
J..
'r/
\Iセ
u.l>
_
20
1 - - - -
<)/
C'v
セ/
セ - - - - + - # - - + - - - t セI
セ/
セ
/
c!
/
/
/
-::E
.30
エMMMMMMMMMKMMセセᆳ
:J:r
100...-
----r ...,... . . . - - -...90
t - - - + - - - ¥ - - - - + - - . . . , . . . . - - - 1t-
80
t +-:z
LLJ70
エMMMMMMMMMKMMMMMMMMイMMMMiエMMMMhセMMMMMエ
Uce
60
エMMMMMMMMMKMMMMMセlNNNNヲMMMiMiMMMMMMMQ
u.l
Q.50
I - - - l - - - I...>-
40
.-
-c:::.
figuセeNNN
6
E..XPANSI0N
AND
sセrinkageNNNAT VARIOUtS
R
E..
LA
T 1V
E...
セU M I [71
T
Y
VA
L U E...5.
-:
セYᄋGQ 100 I I I I .3.01·0
1·0 0 t:::'E!>Q.. Q.E..po12.T 73 \\ IICE.LLULAR
MATE.RIAL
A
roo
i i i(b)
DRYING ey SUCTIONセ
9°
セK
セ
80
セ
セ
7°
セ
セ \,jセ
'0
セ
セUP
\.i'
セ
40
i ' , %RHpF
0/
10 '20 30 40 .50 GO70
80 セoRELAT / VE. J-IUM/O/TY
%
+/
セ
O1l:{ltl
, , /
o
,.,,.1&,.,/
tVfj,
/+
, , // ' +
,*
.f
セ
FIG U
R
E...
S
7
(4).
(b)
M/c,
R.I-I.
RE.LATIONSI-IIP
FOR
セ
.5.
0 セセ
セ セTᄋッセ
セ
3·0
セ
\.) セ'2·0
セ
セiNo
"' I I ,セ
,
,
,
l
0, , , ,o
(a.)
\V E. TTl N Gセ
DRY 1N GATVARIOUS
%
R.H. CONDITIONS(a)
DRYING FROM VACUUM SATURAT ION. IO_r-_ _...,. ... - - -__- - _ - - - _ - - _ 0_Z
e.;
O 7_ t-: 6_ :::> セ 5_ CI) セ 4 -:::> :::>o
<
^セM 14o
oJ!
, 2 U-
セ I MエMMMMM[NMMMMエMMMMMKMMMMKMMMセMMMセMMMMi 0_e
セ
7_(b)
WETTING TO VARIOUS 01. R.H. CONDITIONS.;:6-<
a: :::> 5_t-<
CI) 4oJ!
2 ,o
-
セ 10°1. 20°1. 30°1. 40°1. 50°1. esO°/e 70°1. 80°1. RELATIVE HUMIDITY.FIGURE..S
6 (4)
セ
(b)
MOISTURE- CONTE-NT
AT
VARIOUS
セ
R.H.
CE.LLULA8
mateNNセGal
fAA
8·0
7·0
G·O
C) I 05'0
...
X lL. 0<,
z
-
4·0
z
I-Z3'0
w
U LL LL W2·0
0
U .J セ1·0
セa::
w
:c
.-\...
y---CELLULAR MATERIAL A 8F"IGURE 9
THERMAL COEFFICIENT
OF
EXPANSION
FOR
VARIOUS
S '2'2 APPA
es
NTRATE.
·1
GROIVT/{l ...
S 2/ APPAt?£NT
RATe...
7
G/ZOIVTJ./\V -
t
\VETTING
0·42 セ セ\V-2
0·40 セ +-MMMMNNNNNNNN[コ[セNNNNN[NNNMセセNMNャMMGMMM0·4'2
0·40 PGNSセ L---'-_-L----'-_...J...-...L_...L----L-:--...]MNNlNNNNZセセNMiMMセ
セセ
セ
セセ
セ
"
<, . セ セ セ /+-0PGSFセ
セ
1;\
S\
S\
"'1
イセ
5 /8 AppARE.NT\V-3
セセ
セ
セ セ
セ
R.,ATE.."1
GR.OII/TfI_ セ+
セ
セ セ
セ
J
:
n
;-セ
0·% : +-+z
0'34.
I.«
セセセ
セ I セ セ U ;-"
o ,... \(\ '}. -0·.38 セ\'1-4
セ
セ セ S/7
Af'f'AIZ£NTセ
セ
セセ
RATE... ,,/ GR,OIVrl-l:r
0'3"
セ セ セJ--
+
+ =to:セ
'-.!)0'.54
z
セ セ セセセ
セ
uJ
セ Q Q OKセ r-, セ -.a 'S)セ セゥ
I"
S /4 API'AIZE.)/T ...J <, 'Il ......
<,o
oGSャセ
\) \.) \) \) \)w-s
セセ
セ
セ セ
セNアa
TE... . / 6£O/IITII セセMZイN]j
: •
+セ
PᄋNSセ
+0'34-
I I I I I セ セ セセ
セ
セセ
r-, セ t\, C'I セ セ セ Q If\'"
.
セ
セ
セ セ セ.
... S /3 Aff'AI2£/VT0'34-
\'1-(0
<,セ
セ
セ
セ セ RATE.-'; C?120lVTH + セ セ + セ セWMセM
-
MMセ
__
0'..32
'+I
I
0')0
+ +44 4"
48
.50
51
54
S'
.58
100
セQ64
6', 108 70
-tZ
'+T t M L 11\1 DA
YS
(A.17£P' MOI6TV/l.£., Oセ APPEP)FIGURE.
10
THE..RMAL
E.XPANSION
AT
vaセiousmoistuセeNN
CONTlNT5',
CELLULAR
MATE.RIAL
''I:
57
A?fAP,eNT RATE.. <>1 ':.J;,oiVTHスセ
I5+ S(D
t'AYS
t7RYfNG SERIE.S
セ
セ
o.
.32
セ セ
17 -
.3
I 0-30-+
t--セ
o·
'28 _IL.--...&.._... . . . I . . _ I . . . - . . . . I . . _ L . -..._ I o . o . . -... ..._ " " ' - - - "LJ
--Jセ
セ
セ
\-,セ セ
",
セ
I'
'2
セセ
セ
."
セN
"'
BNKMMKセ|
'\J 9 \ " V\ S 8 A?PAR£NT0'32
t
セ
-
セ
l
セ
セ セ
セ
RATe.セi
s eowru.
セ
0'.30
-+
----+ ---+
-or----r--.L.---a----"'--;...:-Z
0 -28
_11...-...&...1...-...&...1...-....1.._1...-...1.-_1...-....1.._ _... _<£
:r
o
0'32セ
o
0'30o
·28
セ...
_ . L . -..._ L . -..._ L . -..._ L . -..._ L . -... _F I GU
RE..
11
TJ.lERMAL
EXPANSION
AT
VARIOUS
MOISTURE,
\VE TT
I
NG
5E.RIE.S
40°F
130°F
セ
セセ セイッャセセュ
T-I -s r-, セ tt') I:'C)_ \g• '-S)• セ- セ AppAR£NT \,)セ
セ エエIセ t--...,PMSセF
セ セ \)\,) セ RAT£ セセ
'f
セセ
セ
.5
"I
GI2.01J/TH O'30
t
+
+T
-1
:\:r-
--I0-28
I - T I IJ
セ
\.!) セセ
セセ
セ
z
...セ
r-, セ<t
PPTG{セ
t'4 () セ tt'\Q セT-.3
0 -IC\ 'f\ '-S) ... ... C) ":r
セ
.......
+.
セ APPAR£NTセ
セ \,) '-.)0-44
セ セセ
セセエ
セ
\)RATE-+
セ ] .セ
- / GlZolJJTHOO42t
+
+
セ セ:r
t
t-
i⦅Gエセ
\!)0·40
I \ I IZ
|セ
uJ -I+
-s.
00-..5
0 I I I I I I40 4'2
44
4" 48
'0
!J'2 ...54
5"
..58 "0
ftJ'l
"4 ""
Tt ME..--
1N
l'
AY
£
(APTE-IZ. N101'GTLJRE, AOOE.P)FIGURE-
1'2
THE..RMAL
E.XpANSION
AT VARIOUS
MOISTURE...
CONTE.NTS,
0'48 PGTセ