HAL Id: hal-00299344
https://hal.archives-ouvertes.fr/hal-00299344
Submitted on 29 Jun 2006
HAL is a multi-disciplinary open access
archive for the deposit and dissemination of
sci-entific research documents, whether they are
pub-lished or not. The documents may come from
teaching and research institutions in France or
abroad, or from public or private research centers.
L’archive ouverte pluridisciplinaire HAL, est
destinée au dépôt et à la diffusion de documents
scientifiques de niveau recherche, publiés ou non,
émanant des établissements d’enseignement et de
recherche français ou étrangers, des laboratoires
publics ou privés.
Seismic risk mapping for Germany
S. Tyagunov, G. Grünthal, R. Wahlström, L. Stempniewski, J. Zschau
To cite this version:
S. Tyagunov, G. Grünthal, R. Wahlström, L. Stempniewski, J. Zschau. Seismic risk mapping for
Germany. Natural Hazards and Earth System Science, Copernicus Publications on behalf of the
European Geosciences Union, 2006, 6 (4), pp.573-586. �hal-00299344�
www.nat-hazards-earth-syst-sci.net/6/573/2006/ © Author(s) 2006. This work is licensed under a Creative Commons License.
and Earth
System Sciences
Seismic risk mapping for Germany
S. Tyagunov1,3, G. Gr ¨unthal2, R. Wahlstr¨om2,3, L. Stempniewski1, and J. Zschau2
1University of Karlsruhe (TH), Kaiserstrasse 12, 76128 Karlsruhe, Germany 2GeoForschungsZentrum Potsdam, Telegrafenberg, 14473 Potsdam, Germany
3Center for Disaster Management and Risk Reduction Technology (CEDIM), Am Fasanengarten, 76128 Karlsruhe, Germany
Received: 12 January 2006 – Revised: 20 April 2006 – Accepted: 20 April 2006 – Published: 29 June 2006
Abstract. The aim of this study is to assess and map the
seismic risk for Germany, restricted to the expected losses of damage to residential buildings. There are several earth-quake prone regions in the country which have produced Mw
magnitudes above 6 and up to 6.7 corresponding to observed ground shaking intensity up to VIII–IX (EMS-98). Com-bined with the fact that some of the earthquake prone areas are densely populated and highly industrialized and where therefore the hazard coincides with high concentration of ex-posed assets, the damaging implications from earthquakes must be taken seriously. In this study a methodology is pre-sented and pursued to calculate the seismic risk from (1) intensity based probabilistic seismic hazard, (2) vulnerabil-ity composition models, which are based on the distribution of residential buildings of various structural types in repre-sentative communities and (3) the distribution of assets in terms of replacement costs for residential buildings. The es-timates of the risk are treated as primary economic losses due to structural damage to residential buildings. The ob-tained results are presented as maps of the damage and risk distributions. For a probability level of 90% non-exceedence in 50 years (corresponding to a mean return period of 475 years) the mean damage ratio is up to 20% and the risk up to hundreds of millions of euro in the most endangered commu-nities. The developed models have been calibrated with ob-served data from several damaging earthquakes in Germany and the nearby area in the past 30 years.
1 Introduction
Germany is a relatively densely populated country with over 80 million inhabitants, mostly living in urban areas. Al-though situated far from tectonic plate boundaries, a large
Correspondence to: S. Tyagunov
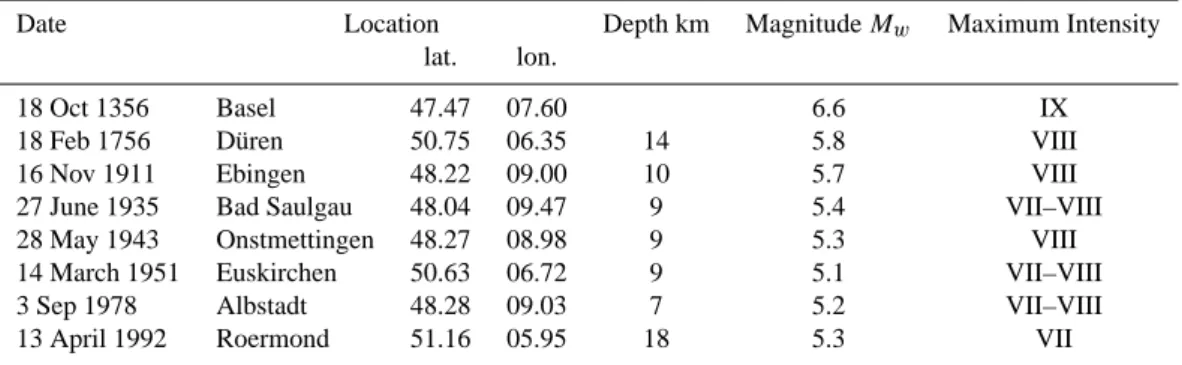
part of the country is related to earthquake prone zones with shallow foci. These have impact on the disaster preparedness and risk mitigation activities. Destructive seismic events are infrequent, however. The past seismic history (Table 1) has manifested the serious threat from earthquakes. Current esti-mates relate about one quarter of the total area of the country, with about one third of the population, to zones where the level of seismic intensity is degree VI (which corresponds to slight damage to normal buildings) or higher with a proba-bility of non-exceedence of 90% in 50 years, i.e., the hazard level used for seismic building codes for normal structures. In some areas the estimated hazard level is up to VIII–IX. Throughout this study, which relates to macroseismic inten-sities, the European Macroseismic Scale, EMS-98 (Gr¨unthal, 1998) is referred to. The building stock of German communi-ties contains to some extent modern buildings constructed in accordance with requirements of the national seismic code, but pre-code buildings are predominant. Due to the gener-ally good workmanship the latter are only to a smaller por-tion vulnerable with respect to the existing hazard level. The combined aspects of the distributions of the seismic hazard, seismic vulnerability and exposed assets provide the neces-sary framework for analyses of the seismic risk. Such an analysis for all of Germany is the objective of the present study, conducted in the frame of the Center for Disaster Management and Risk Reduction Technology (CEDIM) by the two groups of the Universit¨at Karlsruhe (TH) and Geo-ForschungsZentrum Potsdam (GFZ).
Assessment of risk is a necessary and important first step for any other disaster prevention activities. The topical-ity of this problem is reflected in numerous publications. The first systematic earthquake risk estimation studies were performed at the end of the 1960s and beginning of the 1970s. Publications of that period (e.g., Cornell, 1968; Al-germissen et al., 1972; Grandori and Benedetti, 1973; Keilis-Borok et al., 1973; Whitman et al., 1975; Lomnitz and Rosenblueth, 1976) laid ground for future activities. In the
574 S. Tyagunov et al.: Seismic risk mapping for Germany
Table 1. Damaging earthquakes on the territory of Germany and close to its borders. Parameters of these earthquakes from Gr¨unthal and Wahlstr¨om (2003).
Date Location Depth km Magnitude Mw Maximum Intensity
lat. lon.
18 Oct 1356 Basel 47.47 07.60 6.6 IX 18 Feb 1756 D¨uren 50.75 06.35 14 5.8 VIII 16 Nov 1911 Ebingen 48.22 09.00 10 5.7 VIII 27 June 1935 Bad Saulgau 48.04 09.47 9 5.4 VII–VIII 28 May 1943 Onstmettingen 48.27 08.98 9 5.3 VIII 14 March 1951 Euskirchen 50.63 06.72 9 5.1 VII–VIII 3 Sep 1978 Albstadt 48.28 09.03 7 5.2 VII–VIII 13 April 1992 Roermond 51.16 05.95 18 5.3 VII
recent decades, especially during the International Decade for Natural Disaster Reduction (IDNDR, 1990–2000), there has been growing recognition of the problem in the world community. The change in emphasis from hazard to risk, gingered up by a sequence of disastrous earthquakes world-wide, caused the development of procedures and techniques for seismic vulnerability, damage and risk analysis on dif-ferent geographical scales, e.g., PELEM (1989), Chen et al. (1992, 2002), Kiremidjian (1992), Papadopoulos and Ar-vanitides (1996), King et al. (1997), McCormack and Rad (1997), Zonno et al. (1998), FEMA-NIBS (1999), Facci-oli and Pessina (2000), RADIUS (2000), Shakhramanian et al. (2000), Spence (2000), Bendimerad (2001), F¨ah et al. (2001), Coburn and Spence (2002), Lang (2002), Frolova et al. (2003), Giovinazzi and Lagomarsino (2004), Mouroux et al. (2004), Schwarz et al. (2004), Trendafiloski and Miluti-novic (2004), Di Pasquale et al. (2005), Wang et al. (2005) and many others. Different interpretations of the risk con-cept can be found in different publications, though the gen-eral consensus is that risk is a quantified possibility of losses. Two principal methods, deterministic and probabilistic, are used in risk assessments. The main difference is due to the seismic input, with a specified earthquake scenario (magnitude, location, intensity distribution, etc.) in the for-mer case and probabilistic seismic hazard assessment in the latter case. The deterministic method, calculating the ef-fect of a single earthquake on a community or a region, has been frequently applied by the insurance industry or for other purposes of disaster preparedness. Each of the types of approaches has advantages and disadvantages, and they are rather complementary to than substitutes for one another. Both approaches are considered in this study. A comprehen-sive discussion and comparison of probabilistic and deter-ministic methods for hazard and risk applications is offered by McGuire (2001).
The methodology of the risk analysis, including hazard, vulnerability and exposed assets, depends on the geograph-ical scale of the task. For local studies of urban areas, the
seismic input should account for the influences of the local soil conditions (microzonation), inventory of buildings and asset values in a detailed manner (element by element or with representative units). As for studies on a regional or national scale, such as the present one, more generalized methods of analysis are practical.
Previous loss estimation studies for some earthquake prone communities of Germany have been performed by All-mann et al. (1998) and Schwarz et al. (2002a, b, 2004), but the present study is the first aimed at mapping of seismic risk for Germany as a whole and comparison of different parts of the country with respect to their seismic risk exposure.
2 Seismicity and seismic hazard
The seismic activity of Germany is, in a global sense, low but not negligible. Parametric national earthquake cata-logues starting in the 9th century were established by Ley-decker (1986) and Gr¨unthal (1988). The catalogues have since been updated and were unified in 1990. Gr¨unthal and Wahlstr¨om (2003) extended the catalogue to neighbouring parts of Europe north of the Mediterranean region and cal-ibrated the event strength in terms of the physically based moment magnitude, Mw, which is also the mostly used
con-cept for seismic hazard assessment. Whereas the eastern Mediterranean is the most seismically active region in Eu-rope, some of the highest seismic activity in Europe north of the Alps is found in Germany. Significant is the crustal zone of weakness along the river Rhine, i.e., from the Upper Rhine Graben from Basel to Frankfurt am Main over the Middle Rhine zone to the Lower Rhine Embayment, which contin-ues in the Netherlands and NE Belgium. The strongest docu-mented earthquake in this zone occurred near Basel in 1356, Mw=6.6, I=IX, with the epicentre just south of the current
German border. Other notable historic earthquakes occur-ring on the territory of Germany and close to its borders are listed in Table 1. Clear paleoseismic evidence for repeated occurrences of pre-historic earthquakes in the Lower Rhine
Embayment reaching Mw=6.7 has been found (Camelbeeck
and Meghraoui, 1998; Camelbeeck et al., 2000; Vanneste et al., 2001). There is also a zone of enhanced seismicity in Saxony-Thuringia in the east of the country. The northern part of Germany has the lowest seismicity, but no part can be regarded as aseismic.
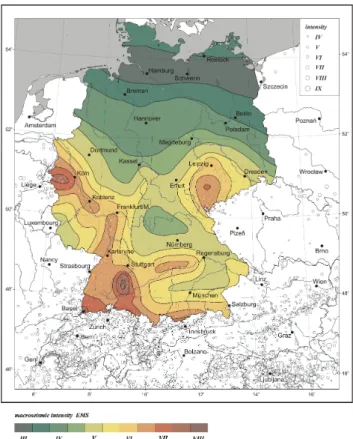
The spatial distribution of the seismic hazard is presented in the map in Fig. 1, given in terms of macroseismic inten-sities for a non-exceedence probability of 90% in 50 years (Gr¨unthal and Bosse, 1996; Gr¨unthal et al., 1998). The lat-ter study is extended to Austria and Switzerland. The main earthquake prone zones are clearly observed in the map. The hazard data on which the map is based are given for a 0.1◦×0.1◦ spaced grid of points over the country. In the present study, these values are interpolated to give a repre-sentative intensity value for each of the 13 490 separate ad-ministrative communities in Germany. This is done in or-der to be able to combine the hazard with the vulnerability and exposed assets, which are provided on a community base (Sects. 3 and 4, respectively).
3 Seismic vulnerability
The seismic vulnerability in the study is considered exclu-sively in the structural sense, implying the ability of build-ings and structures to resist damage from earthquakes. There are two principal approaches to vulnerability assessment, ob-served vulnerability and predicted vulnerability. The former refers to assessment based on statistics of past earthquake damage, whereas the latter refers to assessment of the ex-pected performance of buildings based on engineering com-putations and design specifications or, lacking this informa-tion, on engineering judgement (Coburn and Spence, 2002). Obviously the second way is more applicable for areas of low and moderate seismicity, where, as a rule, there are no or insufficient observational data of the damage. This is the case for Germany with the experience of only a few well de-scribed or analysed damaging earthquakes in the historical time. Still there has been growing interest in recent years amongst engineers concerning the seismic vulnerability of the existing building stock in the country, e.g., Sadegh-Azar (2002), Schwarz et al. (2002a, b, 2004, 2005), Meskouris and Hinzen (2003), Raschke (2004). The experiences gathered in these studies are taken into account for the vulnerability and damage analyses in the present study.
3.1 Vulnerability classes and vulnerability functions for buildings
The subject of the vulnerability analysis in the study is the residential building stock of communities. Residential build-ings prevail in the built environment of German communities and, therefore, their structural vulnerability can be used as an
Fig. 1. Earthquake hazard in Germany in terms of European Macroseismic Scale intensities for a non-exceedence probability of 90% in 50 years; epicentres of tectonic earthquakes as background (Gr¨unthal and Bosse, 1996; Gr¨unthal et al., 1998).
appropriate indicator of the expected seismic performance of the whole building stock.
The vulnerability analysis is conducted in terms of the EMS-98 (Gr¨unthal, 1998), where six vulnerability classes are introduced, denoted alphabetically from A (highest vulnera-bility) to F (lowest vulneravulnera-bility), to describe the ability of different types of structures to withstand seismic loads. Tak-ing into consideration that the seismic performance of build-ings can be influenced also by other factors than the general structural type, such as constructional and architectural fea-tures, quality, age, local soil conditions, etc., the EMS-98 classification gives not only the most probable vulnerability class, but a range of classes for most types of constructions. The vulnerability classes A to D are the ones representing the residential building stock in Germany.
For all the vulnerability classes the damage probabil-ity matrices (describing conditional probabilities of differ-ent damage grades for a given level of seismic input) were constructed following the ideas of the EMS-98, where the description of the damage distribution in terms of “few”, “many”, “most” is given in the definitions of the intensity de-grees. These quantitative terms represent narrowly overlap-ping intervals (“few” – 0–20%, “many” – 10–60%, “most”
576 S. Tyagunov et al.: Seismic risk mapping for Germany
Fig. 2. Idealized damage occurrence probability distribution based on the EMS-98.
– 50–100%) and they describe the probable distribution of damage to buildings of equal vulnerability at a certain level of seismic intensity. The intensity definitions of the EMS-98 provide the description of the damage occurrence probabili-ties for the different vulnerability classes only for the highest damage grades. The Guidelines to the EMS-98 advise that in an idealized case a normal distribution of damage grades di about the mean damage value d0would be expected. Fig-ure 2 presents an idealized damage occurrence probability distribution with d0=dmax−1.5 and σ =0.75, which was mod-elled in accordance with the definitions of the EMS-98. The damage grade dmax corresponds to the maximum observed
damage for a given vulnerability class of buildings and for a given intensity; d0 and σ are the parameters of the nor-mal distribution (mean value and standard deviation). One should keep in mind that the range of the damage grades di
is constrained to be 0–5, therefore the shape of the damage distribution (Fig. 2) is changed as the mean damage value d0 approaches one of the bounds, which cannot be exceeded and where, accordingly, the bulk of the distribution is gradually “piled up” (Gr¨unthal, 1998).
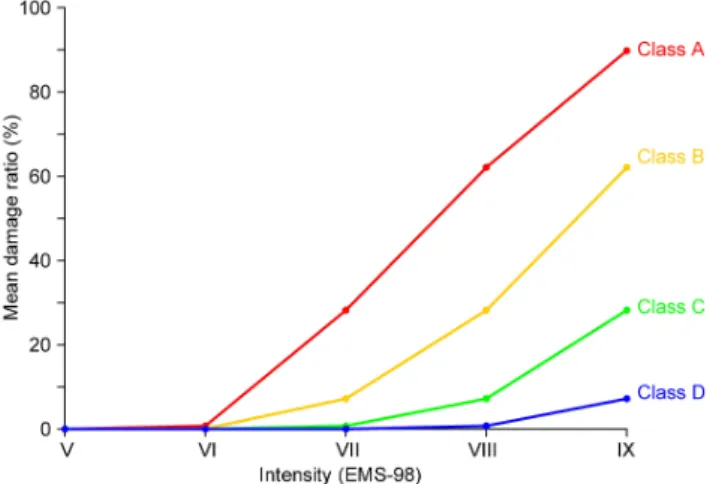
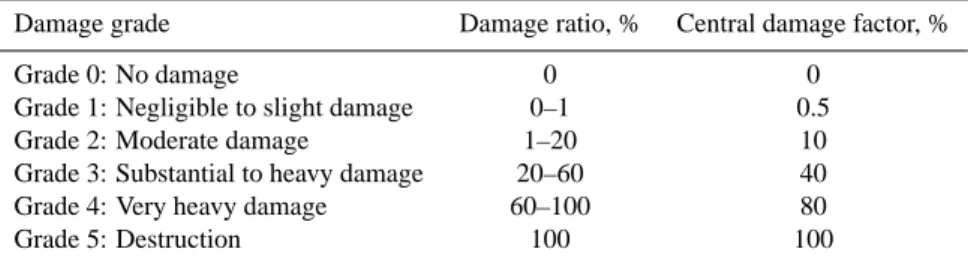
The vulnerability functions for the vulnerability classes were constructed in terms of the mean damage ratio, which represents the cost of repair over the cost of replacement, ver-sus the intensity of ground shaking. The damage ratio range was assigned to the damage grades of the EMS-98 as pre-sented in Table 2. The constructed vulnerability functions for the vulnerability classes A to D are shown in Fig. 3. 3.2 Vulnerability composition modelling for communities The developed large-scale approach, which is aimed at a comparative analysis of the seismic risk for the whole coun-try, considers the administrative communities/municipalities in terms of basic spatial units (grid cells). It is presumed that each unit can be characterized by homogenous
proper-Fig. 3. Vulnerability functions for the EMS-98 vulnerability classes A–D.
ties meaning that all the computational parameters (including hazard, vulnerability and exposed assets) are uniformly dis-tributed within the unit.
In the frame of such an approach, where communities are considered as units at risk, the interest is rather the vulner-ability composition of the existing building stock of com-munities than the seismic performance of single buildings. Therefore, the principal core of the developed methodology is modelling of the vulnerability composition of the existing building stock of communities. The vulnerability composi-tion is understood as the percentage of buildings correspond-ing to the different vulnerability classes in a community.
For constructing the vulnerability composition models we used information derived from field observations, available databases and the literature. The list of communities, the building stock of which was investigated for constructing the vulnerability composition models, is presented in Ta-ble 3. The communities are of different size and all located within earthquake prone zones of the country. For K¨oln and Schm¨olln (located in the spot of higher seismicity south of Leipzig; cf. Fig. 1), which were the case study cities consid-ered in the frame of the DFNK (Deutsches Forschungsnetz Naturkatastrophen – German Research Network Natural Dis-asters) project, we used additional information from Schwarz et al. (2002a, b, 2004). For the other communities listed in Table 3 the necessary information about the vulnerability of existing residential buildings was collected using simplified visual screening procedures. One of the main objectives of these field studies was to investigate the structural and ar-chitectural features of different building types with respect to the vulnerability classification of the EMS-98. Another objective was to survey the vulnerability composition of the residential building stock of communities of different size. The collected information in combination with the data from the INFAS database (2001) serves as the base for developing the vulnerability composition models. The general scheme
Table 2. Classification of damage grades and damage ratio according to the EMS-98.
Damage grade Damage ratio, % Central damage factor, % Grade 0: No damage 0 0
Grade 1: Negligible to slight damage 0–1 0.5 Grade 2: Moderate damage 1–20 10 Grade 3: Substantial to heavy damage 20–60 40 Grade 4: Very heavy damage 60–100 80 Grade 5: Destruction 100 100
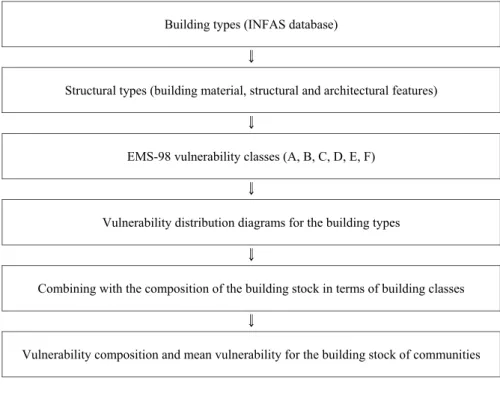
of the procedure of the vulnerability analysis of the building stock of communities is presented in Table 4.
The INFAS database (2001), in particular, contains infor-mation about the composition of the building stock of every community of the country in terms of building types, namely, single- or two-family houses, multi-family houses, terrace houses, blocks of flats, row houses, multi-storey buildings, farmhouses, office buildings and industrial buildings. In-formation about the year of construction and quality of the buildings is also available in the database. The database pro-vides both the number of buildings of different type, age and quality and their percentage in the total building stock, though without inter-correlation of the different characteris-tics. At the current stage only the building type is used; the information about the age and quality can be used for refin-ing the models. The INFAS database (2001) gives no direct information about the seismic vulnerability of the buildings. Therefore, for the purposes of damage and risk analyses the data are to be converted from building types to vulnerabil-ity classes. The above-listed types of buildings are analysed with respect to their building material, and constructional and architectural features. Taking into account these factors and using the EMS-98 vulnerability classification, vulnerability distribution diagrams for all the residential building types are constructed (Table 5). The modelled vulnerability dis-tribution diagrams are assumed to be representative for all communities of the country.
Combining the vulnerability distribution diagrams for the different residential building types with the INFAS database (2001) describing their composition in the building stock of communities, the vulnerability composition for all commu-nities can be estimated and the corresponding vulnerability histograms constructed. In this manner, the procedure of the vulnerability analysis (Table 4) is applied to all communities of the country.
As stated above, in terms of the EMS-98 vulnerability classification the existing residential building stock of Ger-man communities is represented by the vulnerability classes A to D. The classes B and C are predominant, but the compo-sition is different in different communities. The mean struc-tural vulnerability of the building stock was calculated for each of the 13 490 communities of the country and a
corre-Table 3. Communities, the building stock of which was investi-gated for constructing the vulnerability composition models; the community classes are given in Table 6 and are based on the IN-FAS database (2001).
Community Location Population class lat. lon. Albstadt 48◦130N 9◦000E P4 Ettlingen 48◦550N 8◦250E P4 Haßmersheim 49◦180N 9◦080E P3 Karlsruhe 49◦000N 8◦230E P4 K¨oln 50◦560N 6◦550E P5 L¨orrach 47◦370N 7◦390E P4 Neckarzimmern 49◦190N 9◦080E P2 Offenau 49◦140N 9◦090E P2 Schm¨olln 50◦540N 12◦220E P3 Simonswald 48◦060N 8◦030E P3 St. Peter 48◦010N 8◦010E P2 Waldkirch 48◦050N 7◦570E P3
sponding GIS layer is generated. It was found that the mean vulnerabilities of communities vary within the interval of the values corresponding to the vulnerability classes B and C. In other words, the integral damage estimates for the communi-ties are expected to fall in the interval between the vulnerabil-ity functions corresponding to the classes B and C (Fig. 3). Combining the vulnerability models with the seismic input in the frame of the developed algorithm, the distribution of the damage to the building stock (in terms of damage grades) can be obtained for any given community. Further, as an inte-gral parameter, the mean damage ratio can be estimated. The mean damage ratio for the whole building stock of a commu-nity is treated as the arithmetic mean of those of all buildings in the affected community. Statistical analyses show that the building stock of larger communities (urban areas) is gener-ally characterized by a less vulnerable composition of build-ings than that of smaller communities (rural areas).
578 S. Tyagunov et al.: Seismic risk mapping for Germany
Table 4. Scheme of the vulnerability analysis for the building stock of communities.
23
Table 4: Scheme of the vulnerability analysis for the building stock of communities.
Building types (INFAS database)
\
Structural types (building material, structural and architectural features)
\
EMS-98 vulnerability classes (A, B, C, D, E, F)
\
Vulnerability distribution diagrams for the building types
\
Combining with the composition of the building stock in terms of building classes
\
Vulnerability composition and mean vulnerability for the building stock of communities
Table 5. Vulnerability distribution of the residential building types.
24
Table 5: Vulnerability distribution of the residential building types.
Residential building type Vulnerability distribution model D C B A Farmhouses
Single- or two-family houses Row houses Terrace houses Multi-family houses
Blocks of flats Multi-storey buildings
3.3 Representative vulnerability models for communities
The found consistent pattern of relatively higher structural vulnerability composition of the building stock for smaller, rural communities in comparison with larger, urban commu-nities prompts an approach for vulnerability estimation on a large scale (national or regional), which is especially
use-ful in cases where detailed information about the building stock composition is lacking. As already described in sev-eral papers, e.g., Tyagunov et al. (2004, 2005), Wahlstr¨om et al. (2004), the method is based on the assignment of the communities of the country into population classes.
The assignment of the 13 490 communities of Ger-many into five population classes and the corresponding
Table 6. Vulnerability composition models of the building stock of communities.
Population class Percentage of buildings of different (number of inhabitants) vulnerability classes (EMS-98)
A B C D P1 (<300) Few Most Few Few P2 (300–3000) Few Most Many Few P3 (3000–30 000) Few Many Many Few P4 (30 000–300 000) Few Many Most Few P5 (>300 000) Few Few Most Few
Definitions of quantity: “few” – 0–20%, “many” – 10–60%, “most” – 50–100%
vulnerability composition models are presented in Table 6. For each of the community classes the vulnerability com-position models describe the building stock in terms of the EMS-98 vulnerability classes.
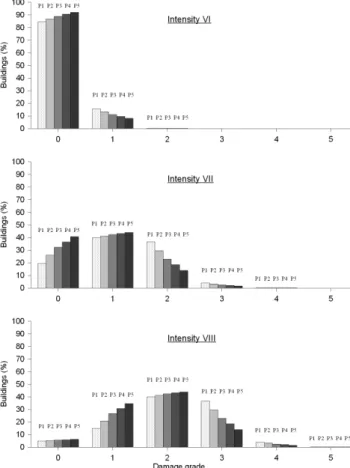
For the representative community classes the damage probability matrices are constructed as the combination of those for the structural vulnerability classes with the vul-nerability composition models. The histograms in Fig. 4 illustrate the probable distribution of damage grades in the building stock of communities of the five different popula-tion classes for three levels of the seismic input (intensities VI, VII and VIII). With the use of the damage histograms both the mean damage grade and the mean damage ratio for the whole building stock can be estimated as the arithmetic mean of those of all buildings in the affected community. The corresponding vulnerability (damage) functions for the five representative population classes are constructed in terms of the mean damage ratio versus seismic intensity (Fig. 5). The seismic intensity should here be interpreted as the mean seis-mic input for the area of the affected community. It can be seen that the vulnerability (damage) functions for all the rep-resentative community classes (Fig. 5) lie between the vul-nerability functions for the classes B and C (Fig. 3).
4 Asset values
Strong earthquakes can affect various aspects of the commu-nity life, and risks apply to physical (damage to buildings), social (casualties and injuries) and financial losses. In this study, only primary economic losses due to the structural damage to residential buildings are considered. As a rule, residential buildings are dominant in the building stock of communities and, therefore, the damage to them is an apt in-dicator of the total earthquake impact on a community. A more complete picture would be obtained if other compo-nents of the physical environment are considered, such as commercial and industrial buildings, and the infrastructure, as well as other probable disaster consequences, like
casu-Fig. 4. Damage distribution diagrams for communities of different population classes for the seismic input corresponding to different intensities – VI (a), VII (b) and VIII (c).
Fig. 5. Vulnerability (damage) functions for the representative com-munity classes.
alties, damage to building contents and inventories, business interruption, etc. But this is beyond the scope of the present study.
The information about the replacement costs in all German communities was collected by the Asset Estimation Group
580 S. Tyagunov et al.: Seismic risk mapping for Germany
Fig. 6. Distribution of exposed values in terms of replacement costs for residential buildings (millions of euro) in communities of Ger-many (Kleist et al., 2004, 2006).
of CEDIM (Kleist et al., 2004, 2006) and is used also in the analyses of the other kinds of risks in the project. This pro-vides a good basis to compare the losses quantitatively, sim-ilar to a study accomplished for the city of K¨oln (Gr¨unthal et al., 2006). The asset estimates are based on available statisti-cal data and are quantified as total replacement costs for the reference year 2000. In our case, only the data for residential buildings are used.
The total asset values in a community depend on the number of inhabitants, the values varying considerably from small villages (order of millions of euro) to large cities (or-der of many billions of euro). The mean value, µ, and stan-dard deviation, σ , of the estimated distribution of replace-ment costs per person for communities of the whole coun-try are µ=42 600 EUR and σ =10 700 EUR. The parameters for the communities located in the seismically hazardous zones of the country (from 0 to 3 according to the national seismic code of DIN 4149, 2005) are µ=46 000 EUR and σ=10 200 EUR. The distribution of the exposed assets for the communities of Germany is depicted in Fig. 6.
Fig. 7. Estimated distribution of the mean damage ratio (percent-age) in communities of Germany for a non-exceedence probability of 90% in 50 years.
5 Probable seismic damage and seismic risk
For the assessment of the probable seismic damage and losses from potential future earthquakes in the country, the hazard, vulnerability and asset data are integrated on a GIS platform. The damage and loss estimates presented in the paper are calculated with the use of the vulnerability models based on the representative community classes described in Section 3.3.
Combining the seismic hazard input (Sect. 2) with the dis-tribution of communities of different classes and the corre-sponding vulnerability models (Sect. 3.3), the distribution of the probable damage to the residential building stock of the country is obtained for every community as the distribu-tion of potentially damaged buildings with different damage grades (by analogy with Fig. 4) depending on the hazard in-put (Fig. 1). The integral damage estimates for communities can be presented in terms of either the mean damage grade or the mean damage ratio. The distribution of the mean damage ratio in communities calculated with the use of the represen-tative vulnerability functions (Fig. 5) is shown in Fig. 7.
Fig. 8. Estimated distribution of the seismic risk (millions of euro) in communities of Germany for a non-exceedence probability of 90% in 50 years.
Combining the damage estimates (Fig. 7) with the asset values (Fig. 6), the distribution of the seismic risk is obtained (Fig. 8). The maps of the probable seismic damage and the seismic risk relate to the same probability level as the hazard map (Fig. 1), i.e., a probability of non-exceedence of 90% in 50 years. Both the damage and the risk are valid for the residential building stock.
A visual comparison of the maps in Figs. 1, 7 and 8 in-dicates that the distributions of the probable damage and the seismic risk generally follow the hazard distribution. How-ever, there are some clear distinctions between the damage and the risk maps, because the damage map (Fig. 7) depicts the mean damage ratio of the building stock in the commu-nities, whereas Fig. 8 also considers the number of buildings and the amount of exposed assets in a community.
The obtained estimates of the mean damage ratio for the different communities (Fig. 7) vary from 0 to about 20% for the used probability level, which corresponds to a mean re-turn period of 475 years. The corresponding risk estimates vary from zero to hundreds of millions of euro (Fig. 8). For
Fig. 9. Distribution of the observed seismic intensities from the Roermond earthquake (1992) in communities of Germany and in nearby Netherlands.
the considered hazard probability level, there is no risk in areas with the expected level of intensity V or less, which causes no damage to buildings. However, the damage level would increase for higher hazard levels. No risk exists in uninhabited areas, where there are no asset values. On the contrary the highest level of risk (cf. Fig. 8) is generated by the combination of higher intensities of the given hazard level and a higher concentration of exposed assets. The 15 com-munities with the highest obtained seismic risk are listed in Table 7.
6 Scenario approach and calibration of the models
The probabilistic hazard-based assessment and mapping of seismic risk provide the possibility of a comparative analysis of risk distribution in the whole country to identify the most endangered communities. For the estimation of the level of the probable damage and losses from single seismic events the scenario approach can be useful. In this study the de-terministic scenario approach is used for the calibration of the developed models. The damage and economic losses for three past earthquakes provide the data for the calibration, namely the Albstadt earthquake of 3 September 1978, Roer-mond earthquake of 13 April 1992 and Waldkirch earthquake of 5 December 2004 (Table 8).
The results of the calculations are very sensitive to the level of the ground motion. The seismic input is modelled with the use of available macroseismic data collected in the affected area. For the Roermond earthquake the data from Haak et al. (1994) and Meidow and Ahorner (1994) have been used. The distribution of observational data (Fig. 9) was combined with the spatial grid of community boundaries.
582 S. Tyagunov et al.: Seismic risk mapping for Germany
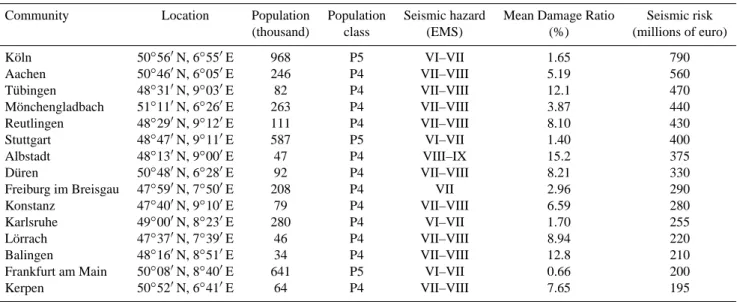
Table 7. Communities with the highest risk values; estimated losses due to the probable damage to the residential building stock for a 90% non-exceedence probability in 50 years.
Community Location Population Population Seismic hazard Mean Damage Ratio Seismic risk (thousand) class (EMS) (%) (millions of euro) K¨oln 50◦560N, 6◦550E 968 P5 VI–VII 1.65 790 Aachen 50◦460N, 6◦050E 246 P4 VII–VIII 5.19 560 T¨ubingen 48◦310N, 9◦030E 82 P4 VII–VIII 12.1 470 M¨onchengladbach 51◦110N, 6◦260E 263 P4 VII–VIII 3.87 440 Reutlingen 48◦290N, 9◦120E 111 P4 VII–VIII 8.10 430 Stuttgart 48◦470N, 9◦110E 587 P5 VI–VII 1.40 400 Albstadt 48◦130N, 9◦000E 47 P4 VIII–IX 15.2 375 D¨uren 50◦480N, 6◦280E 92 P4 VII–VIII 8.21 330 Freiburg im Breisgau 47◦590N, 7◦500E 208 P4 VII 2.96 290 Konstanz 47◦400N, 9◦100E 79 P4 VII–VIII 6.59 280 Karlsruhe 49◦000N, 8◦230E 280 P4 VI–VII 1.70 255 L¨orrach 47◦370N, 7◦390E 46 P4 VII–VIII 8.94 220 Balingen 48◦160N, 8◦510E 34 P4 VII–VIII 12.8 210 Frankfurt am Main 50◦080N, 8◦400E 641 P5 VI–VII 0.66 200 Kerpen 50◦520N, 6◦410E 64 P4 VII–VIII 7.65 195
Table 8. Comparison of calculated losses with observational data.
Considered earthquakes Monetary losses observed from the past earthquakes total/residential buildings (millions of euro)
Estimated losses due to damage to the residential building stock from the modelled earthquakes for the current time
(millions of euro) Albstadt, 3 September 1978 (Mw=5.1, h=7 km, Imax=VII–VIII) ca. 140/unknown 172 Roermond, 13 April 1992 (Mw=5.3, h=18 km, Imax=VII) 36/51) 131) Waldkirch, 5 December 2004 (ML=5.4, Mw=4.8, h=12 km, Imax=VI) ca. 3/unknown 0.8 1)Impacts in Germany.
The seismic input for a community is calculated as the mean of the observed intensity values within its boundaries. The representative intensity values are calculated only for the af-fected communities of Germany; the impact of the earth-quake in the Netherlands is not considered here. Since the detailed macroseismic data for the Albstadt and the Wald-kirch earthquakes are lacking, the macroseismic fields are modelled with the use of the regional empirical relationships determining the attenuation of seismic intensity as a func-tion of magnitude, depth and epicentral distance (Stromeyer and Gr¨unthal, 2004). Intensity values are calculated for the centres of all affected communities. The influence of local soil conditions and possible site-effects are not considered. As an illustration, the modelled intensity distribution for the Albstadt earthquake is shown in Fig. 10.
For the calculation of the damage and losses the con-structed macroseismic fields are combined with the vulner-ability and asset data. Damage to the building stock is esti-mated with the use of the representative vulnerability compo-sition models described in Sect. 3.3. A retrospective compar-ison should take into consideration the changes in the com-munities in the past years (including the population, building stock, price level, etc.). In our present dataset, however, not all such information is available. Therefore, certain assump-tions are made in the computaassump-tions. In particular, the popu-lation distribution in the communities is taken from the cur-rent databases. The replacement costs for buildings (Sect. 4) are also taken without retrospective calculation. Therefore, the results of these calculations can be considered as a first estimation of the probable losses for the case that a similar earthquake would occur nowadays.
The obtained results for the three earthquakes are pre-sented in Table 8. The losses from the Roermond earthquake are given only for the territory of Germany.
A comparison of the computed loss estimates with avail-able information about the observed earthquake losses (e.g., Berz, 1994; Gr¨unthal, 2004) shows that the level of earth-quake losses can be estimated adequately with the use of the developed models, although the accuracy of the estimation of possible earthquake impacts is limited in the frame of the generalized large-scale approach. Obviously, a more detailed consideration of the problem (at the scale of microzonation) would improve the accuracy of the results. In particular, more accurate assessments of the intensity distribution, tak-ing into account local soil conditions and applytak-ing synthetic modelling, would be valuable.
7 Conclusions
A GIS-based methodology for assessment of seismic vulner-ability, seismic damage and seismic risk on a national scale was developed and applied to Germany. The damage is based on probabilistic seismic hazard assessment and vulnerability composition modelling for the residential building stock of communities. For the seismic risk, exposed assets in terms of replacement costs for residential buildings are combined with the obtained damage distribution. For the vulnerabil-ity, population classes represent all communities, whereas the values for the hazard and the assets are those for the indi-vidual communities.
There is a tendency of increased mean structural vulnera-bility of the building stock for the smaller communities, and therefore the mean damage ratio is expected to be higher in smaller communities than in larger ones if the intensities for a given hazard level are the same. There are, however, ex-ceptions to the general rule, i.e., communities for which the vulnerability estimation based on representative population classes is not adequate. The values of the mean damage ratio for communities are estimated to be 0–20% for a probability of non-exceedence of 90% in 50 years.
The lower damage distinguishable for larger communi-ties in comparison with nearby (i.e., similar hazard level) smaller communities observed in Fig. 7 is reversed in rel-atively higher seismic risk values (Fig. 8) due to the much higher concentration of exposed assets. The effect of lower vulnerability is thus more than compensated by higher val-ues of assets for these communities in the risk map. At the end, the full combination of hazard, vulnerability and assets determines the risk. The obtained values of the seismic risk in the communities of Germany vary between zero and hun-dreds of millions of euro. The communities with the highest risk values are listed in Table 7.
The calibration of the obtained results with the observed losses from several damaging earthquakes proves the
robust-Fig. 10. Distribution of the seismic intensities resulting from the modelled scenario earthquake in Albstadt (1978).
ness of the developed approach, which enables the estimation of the probable damage and losses from future earthquakes.
The conducted study is implemented in terms of mean val-ues. However, the estimates of the damage and risk are as-sociated with the various uncertainties in their components, i.e., the hazard and vulnerability for the damage, and the haz-ard, vulnerability and assets for the risk. These uncertainties have not been treated in this study.
The developed methodology addresses large-scale seismic risk assessment using relatively large computational cells, the communities. The use of smaller computational cells (e.g., postcodes in urban areas) would give more differen-tiated results. Also for the scenario approach, applied to calibrate the probabilistic risk estimates with actual obser-vations, there is a need for more detailed and differentiated input data.
Acknowledgements. This work is part of the Center for Disaster
Management and Risk Reduction Technology (www.cedim.de), a joint venture between the GeoForschungsZentrum Potsdam (GFZ) and the Technical University of Karlsruhe (TH). We thank the GFZ Potsdam and the TH Karlsruhe for financial support. We would
584 S. Tyagunov et al.: Seismic risk mapping for Germany
like to thank our colleagues from other groups of the project, particularly the Asset Estimation Group for preparing the database of assets and M. M¨uller of the Data Management and GIS Group for technical support. Suggestions from three reviewers and the editor helped improve the article.
Edited by: H. Kreibich Reviewed by: three referees
References
Algermissen, S. T., Rinehart, W., Dewey, J., Steinbrugge, K. V., Lagorio, H. J., Degenkolb, H. J., Cluff, L. S., McClure, F. E., Scott, S., and Gordon, R. F.: A study of earthquake losses in the San Francisco Bay Area: Data and analysis, Washington, D.C., NOAA, 1972.
Allmann, A., Rauch, E., and Smolka, A.: New paleoseismologi-cal findings on major earthquakes in Central Europe: Possible consequences for the earthquake loss potential in Germany, in: Proc. of the 11th European Conference on Earthquake Engineer-ing, Balkema, Rotterdam, 1–7, 1998.
Bendimerad, F.: Modeling and quantification of earthquake risk: Application to emerging economies, in: Mitigation and Financ-ing of Seismic Risks, edited by: Kleindorfer, P. R. and Sertel, M. R., Kluwer Acad. Publ., 13–39, 2001.
Berz, G.: Assessment of losses caused by the 1992 Roermond earth-quake, the Netherlands, Geologie en Mijnbouw, 73, 281, 1994. Camelbeeck, T. and Meghraoui, M.: Geological and geophysical
evidence for large paleoearthquakes with surface faulting in the Roer Graben (northwest Europe), Geophys. J. Int., 132, 347–362, 1998.
Camelbeeck, T., Vanneste, K., Verbeeck, K., Meghraoui, M., Pelz-ing, R., Hinzen, K., Dost, B., and van der Berg, M.: Long-term seismic activity in the Lower Rhine Embayment. European Cen-ter for Geodynamics and Seismology Workshop “Evaluation of the potential for large earthquakes in regions of present day low seismic activity in Europe”, Han-sur-Lesse, Belgium, March 13– 17, 2000, 35–38, 2000.
Chen, Y., Chen, X. L., Fu, Z. X., Ying, Z. Q., and Yang, M. D.: Es-timating Losses from Earthquakes in China in the Forthcoming 50 Years, Seismological Press, Beijing, 60 pp., 1992.
Chen, Y., Chen, Q. F., Liu, J., Chen, L., and Li, J.: Seismic Haz-ard and Risk Analysis: A Simplified Approach, Science Press, Beijing, 228 pp., 2002.
Coburn, A. and Spence, R.: Earthquake Protection, Second edition, John Wiley & Sons Ltd., 420 pp., 2002.
Cornell, C. A.: Engineering seismic risk analysis, Bull. Seism. Soc. Am., 58, 1583–1606, 1968.
DIN 4149 (2005): Bauten in deutschen Erdbebengebieten. Lastan-nahmen, Bemessung und Ausf¨uhren ¨ublicher Hochbauten, Nor-menausschuß im Bauwesen (NABau) im DIN Deutsches Institut f¨ur Normung e.V., Berlin, 2005.
Faccioli, E. and Pessina, V: The Catania Project: Earthquake dam-age scenarios for high risk area in the Mediterranean, CNR-Gruppo Nazionale per la Difesa dai Terremoti, Roma, 2000. F¨ah, D., Kind, F., Lang, K., and Giardini, D.: Earthquake
scenar-ios for the city of Basel, Soil Dyn. Earthq. Engrg., 21, 405–413, 2001.
FEMA-NIBS: Earthquake Loss Estimation Methodology, HAZUS 99, Technical Manual, Federal Emergency Management Agency and National Institute of Building Sciences, Washington, 1999. Frolova, N., Larionov, V., Sushchev, S., and Ugarov, A.: Extremum
system for earthquake risk and loss assessment, in: Proc. of the Conference Skopje Earthquake – 40 Years of European Earth-quake Engineering, Ohrid, Macedonia, CD-ROM, 2003. Giovinazzi, S. and Lagomarsino, S.: A macroseismic method for
the vulnerability assessment of buildings, in: Proc. of the 13th World Conference on Earthquake Engineering (13 WCEE), Van-couver, BC, Canada, 1–6 August, paper no. 896, 2004.
Grandori, G. and Benedetti, D.: On the choice of the acceptable seismic risk, Earthq. Eng. Struct. Dyn., 2, 3–9, 1973.
Gr¨unthal, G.: Erdbebenkatalog des Territoriums der Deutschen Demokratischen Republik und angrenzender Gebiete von 823 bis 1984, Akademie der Wissenschaften der DDR, Ver¨off. Zen-tralinst. Physik der Erde, Nr. 99, 139 pp., 1988.
Gr¨unthal, G. (Ed.): European Macroseismic Scale 1998, Cahiers du Centre Europ´een de G´eodynamique et de S´eismologie, Vol. 15, Conseil de l’Europe, Luxembourg, 99 pp., 1998.
Gr¨unthal, G.: Die Erdbebenzonenkarte als Bestandteil der neuen DIN 4149, in: DGEB/DIN Gemeinschaftstagung, Auslegung von Bauwerken gegen Erdbeben – Die neue DIN 4149, Leinfelden-Echterdingen, Beuth Verlag, 3–24, 2004.
Gr¨unthal, G. and Bosse, Ch.: Probabilistische Karte der Erd-bebengef¨ahrdung der Bundesrepublik Deutschland – Erdbeben-zonierungskarte f¨ur das Nationale Anwendungsdokument zum Eurocode 8, GeoForschungsZentrum Potsdam, STR 96/10, 24 pp., 1996.
Gr¨unthal, G. and Wahlstr¨om, R.: An Mw based earthquake
cata-logue for central, northern and northwestern Europe using a hi-erarchy of magnitude conversions, J. Seism., 7, 507–531, 2003. Gr¨unthal, G., Mayer-Rosa, D., and Lenhardt, W. A.: Absch¨atzung
der Erdbebengef¨ahrdung f¨ur die D-A-CH-Staaten – Deutschland, ¨
Osterreich, Schweiz. Bautechnik, 10, 753–767, 1998.
Gr¨unthal, G., Thieken, A. H., Schwarz, J., Radtke, K., Smolka, A., and Merz, B.: Comparative Risk Assessments for the City of Cologne – Storms, Floods, Earthquakes, Nat. Hazards, 38, 21– 44, 2006.
Haak, H., van Bodegraven, J. A., Sleeman, R., Verbeiren, R., Ahorner, L., Meidow, H., Gr¨unthal, G., Hoang Trong, P., Mus-son, R. M. W., Henni, P., Schenkov´a, Z., and Zimov´a, R.: The macroseismic map of the 1992 Roermond earthquake, the Netherlands, Geologie en Mijnbouw, 73, 265–270, 1994. INFAS Database: Das DataWherehouse, Bonn, INFAS GEOdaten
GmbH, www.infas-geodaten.de, 2001.
Keilis-Borok, V. I., Kantorovich L. V., and Molchan, G. M.: Seis-mic risk and principles of seisSeis-mic zoning, in: Computational and Statistical Methods for Interpretation of Seismic Data, Moscow, Nauka, (in Russian), 3–20, 1973.
King, S. A., Kiremidjian, A. S., Bas¨oz, N., Law, K., Vucetic, M., Doroudian, M., Olson, R. A., Eidinger, J. M., Goettel, K. A., and Horner, G.: Methodologies for evaluating the socio-economic consequences of large earthquakes, Earthq. Spectra, 13, 565– 584, 1997.
Kiremidjian, A.: Methods for regional damage estimation, in: Proc. of the 10th World Conference on Earthquake Engineering (10 WCEE), Madrid, Spain, 19–25 July 1992, Balkema, Rotterdam, Vol. 11, 6753–6762, 1994.
Kleist, L., Thieken, A., K¨ohler, P., M¨uller, M., Seifert, I., and Werner, U.: Estimation of building values as a basis for a com-parative risk assessment, in: Disasters and Society — From Haz-ard Assessment to Risk Calculation, edited by: Malzahn, D. and Plapp, T., Proc. of an International Conference at the University of Karlsruhe (TH), Karlsruhe, Germany, 26–27 July 2004, Logos Verlag Berlin, 115–122, 2004.
Kleist, L., Thieken, A., K¨ohler, P., Seifert, I., Borst D., and Werner, U.: Estimation of building values as a basis for comparative risk assessments, Nat. Hazards Earth Syst. Sci., in press, 2006. Lang, K.: Seismic vulnerability of existing buildings. Dissertation,
Inst. of Struct. Eng., Swiss Federal Inst. Technology, Zurich, 196 pp., 2002.
Leydecker, G.: Erdbebenkatalog f¨ur die Bundesrepublik Deutsch-land mit Randgebieten f¨ur die Jahre 1000–1981, Geol. Jb., E36, 3–83, 1986.
Lomnitz, C. and Rosenblueth, E. (Eds.): Seismic Risk and Engi-neering Decisions, Elsevier, Amsterdam, 425 pp., 1976. McCormack, T. C. and Rad, F. N.: An earthquake loss
estima-tion methodology for buildings based on ATC-13 and ATC-21, Earthq. Spectra, 13, 605–622, 1997.
McGuire, R. K.: Deterministic vs probabilistic earthquake hazards and risks, Soil Dyn. Earthq. Engrg., 21, 377–384, 2001. Meidow, H. and Ahorner, L.: Macroseismic effects in Germany of
the 1992 Roermond earthquake and their interpretation, Geologie en Mijnbouw, 73, 271–279, 1994.
Meskouris, K. and Hinzen, K.-G.: Bauwerke und Erdbeben, Vieweg Verlag, 470 pp., 2003.
Mouroux, P., Bertrand, E., Bour, M, Le Brun, B., Depinois, S., Masure Ph. and the RISK-UE team: The European RISK-UE Project: An advanced approach to earthquake risk scenarios, in: Proc. of the 13th World Conference on Earthquake Engineer-ing (13 WCEE), Vancouver, BC, Canada, 1–6 August, paper no. 3329, 2004.
Papadopoulos G. A. and Arvanitides, A.: Earthquake Risk Assess-ment in Greece, in: Earthquake Hazard and Risk, edited by: Schenk, V., Kluwer Acad. Publ., 221–229, 1996.
di Pasquale, G., Orsini, G., and Romeo, R. W.: New developments in seismic risk assessment in Italy, Bull. Earthq. Eng., 3, 101– 128, 2005.
PELEM (Panel of Earthquake Loss Estimation Methodology): Es-timating Losses from Future Earthquakes, National Academy Press, 248 pp., 1989.
RADIUS: Risk Assessment Tools for Diagnosis of Urban Areas against Seismic Disasters, Geneva, Switzerland: IDNDR Sec-retariat, United Nations, 38 pp., 2000.
Raschke, M.: Die Korrelation zwischen Erdbebenst¨arke und Bauw-erkschaden und deren Anwendung in der Risikoanalyse, Disser-tation, Bauhaus-Universit¨at Weimar, Shaker Verlag, Aachen, 193 pp., 2004.
Sadegh-Azar, H.: Schnellbewertung der Erdbebengef¨ahrdung von Geb¨auden, Dissertation am Lehrstuhl f¨ur Baustatik und Baudy-namik, Rheinisch-Westf¨alische Technische Hochschule Aachen, 156 pp., 2002.
Schwarz, J., Raschke, M., and Maiwald, H.: Seismische Risikokartierung auf der Grundlage der EMS-98: Fallstudie Ostth¨uringen, Zweites Forum Katastrophenvorsorge, DKKV, Bonn und Leipzig, 325–336, 2002a.
Schwarz, J., Raschke, M., and Maiwald, H.: Seismic risk studies
for central Germany on the basis of the European Macroseismic Scale EMS-98, in: Proc. of the 12th European Conference on Earthquake Engineering, Elsevier Science Ltd., paper no. 295, 2002b.
Schwarz, J., Maiwald, H., and Raschke, M.: Erdbebenszenarien f¨ur deutsche Großstadtr¨aume und Quantifizierung der Schaden-potentiale, in: Deutsches Forschungsnetz Naturkatastrophen (DFNK) Abschlussbericht, edited by: Merz, B. and Apel, H., 188–200, 2004.
Schwarz, J., Langhammer, T., and Kaufmann, K.: Quantifizierung der Schadenspotentiale infolge Erdbeben – Teil 1: Rekonstruk-tion des Bebens in der Schw¨abischen Alb vom 3 September 1978, Bautechnik, 8, 520–532, 2005.
Shakhramanian, M. A, Larionov, V. I., Nigmetov, G. M., and Sutschev, S. P.: Assessment of the seismic risk and forecasting consequences of earthquakes while solving problems of popula-tion rescue (theory and practice), Moscow, 180 pp., 2000. Spence, R.: Recent earthquake damage in Europe and implications
for loss estimation methodologies, in: Implications of Recent Earthquakes on Seismic Risk, edited by: Elnashai, A. S. and An-toniou, S., Japan-UK Seismic Risk Forum, 3rd Workshop, Lon-don, 6–7 April, CD-ROM, 2000.
Stromeyer, D. and Gr¨unthal, G.: Intensity attenuation for seis-mic zones in Germany considering uncertainties (poster), 29th General Assembly European Seismological Commission (Pots-dam/Germany 2004), SCF-0 Engineering Seismology, 155, 2004.
Trendafiloski, G. and Milutinovic, Z.: GIS-oriented method for elaboration of probabilistic earthquake scenarios, in: Proc. of the 13th World Conference on Earthquake Engineering (13 WCEE), Vancouver, BC, Canada, 1–6 August, paper no. 1809, 2004. Tyagunov, S., Stempniewski, L., Gr¨unthal, G., Wahlstr¨om, R., and
Zschau, J.: Vulnerability and risk assessment for earthquake-prone cities, in: Proc. of the 13th World Conference on Earth-quake Engineering (13 WCEE), Vancouver, BC, Canada, 1–6 August, paper no. 868, 2004.
Tyagunov, S., Stempniewski, L., Gr¨unthal, G., Wahlstr¨om, R., and Zschau, J.: Vulnerability and risk analysis for earthquake prone communities, in: Structures and Extreme Events, Proc. of the IABSE Symposium, Lisbon, Portugal, 14–16 September, IABSE Report, Vol. 90, paper no. 139, 2005.
Vanneste, K., Verbeeck, K., Camelbeeck, T., Paulissen, E., Meghraoui, M., Renardy, F., Jongmans, D., and Frechen, M.: Surface-rupturing history of the Bree fault scarp, Roer Valley graben: Evidence for six events since the late Pleistocene, J. Seism., 5, 329–359, 2001.
Wahlstr¨om, R., Tyagunov, S., Gr¨unthal, G., Stempniewski, L., Zschau, J., and M¨uller, M.: Seismic risk analysis for Germany: Methodology and preliminary results, in: Disasters and Soci-ety – From Hazard Assessment to Risk Calculation, edited by: Malzahn, D. and Plapp, T., Proc. of an International Conference at the University of Karlsruhe (TH), Karlsruhe, Germany, 26–27 July 2004, Logos Verlag Berlin, 415 pp., 83–90, 2004.
Wang, Y., Shi, P.-J., and Wang J.-A.: The housing loss assess-ment of rural villages caused by earthquake disaster in Yunnan Ptovince, Acta Seismol. Sinica, 18, 590–601, 2005.
Whitman, R. V., Biggs, J. M., Brennan, J. E., Cornell, C. A., Neufville, R. L., and Vanmarcke, E. H.: Seismic design decision analysis, ASCE Struct. Eng. J., 101, 1067–1084, 1975.
586 S. Tyagunov et al.: Seismic risk mapping for Germany
Zonno, G., Cella, F., Luzi, L., Menoni, S., Meroni, F., Ober, G., Pergalani, F., Petrini, V., Tomasoni, R., Carrara, P., Musella, D., Garc´ıa-Fern´andez, M., Jim´enez, M. J., Canas, J. A., Al faro, A. J., Barbat, A. H., Mena, U., Pujades, L. G., Soeters, R., Terlien, M. T. J., Cherubini, A., Angeletti, P., Di Benedetto, A., Caleffi, M., Wagner, J. J., and Rosset, P.: Assessing seismic risk at dif-ferent geographical scales: concepts, tools and procedures, in: Proc. of the 11th European Conference on Earthquake Engineer-ing, Paris, France, CD-ROM, 1998.