Publisher’s version / Version de l'éditeur:
Engineering Journal, 50, 6, pp. 19-23, 1967-07-01
READ THESE TERMS AND CONDITIONS CAREFULLY BEFORE USING THIS WEBSITE. https://nrc-publications.canada.ca/eng/copyright
Vous avez des questions? Nous pouvons vous aider. Pour communiquer directement avec un auteur, consultez la première page de la revue dans laquelle son article a été publié afin de trouver ses coordonnées. Si vous n’arrivez pas à les repérer, communiquez avec nous à [email protected].
Questions? Contact the NRC Publications Archive team at
[email protected]. If you wish to email the authors directly, please see the first page of the publication for their contact information.
NRC Publications Archive
Archives des publications du CNRC
This publication could be one of several versions: author’s original, accepted manuscript or the publisher’s version. / La version de cette publication peut être l’une des suivantes : la version prépublication de l’auteur, la version acceptée du manuscrit ou la version de l’éditeur.
Access and use of this website and the material on it are subject to the Terms and Conditions set forth at
Strain measurements on perforated breakwater at Baie Comeau
Dryburgh, R. B.; Peter, B. G.; Plewes, W. G.
https://publications-cnrc.canada.ca/fra/droits
L’accès à ce site Web et l’utilisation de son contenu sont assujettis aux conditions présentées dans le site
LISEZ CES CONDITIONS ATTENTIVEMENT AVANT D’UTILISER CE SITE WEB.
NRC Publications Record / Notice d'Archives des publications de CNRC:
https://nrc-publications.canada.ca/eng/view/object/?id=9200895b-1ada-427e-a7ec-8d17edfcab83
https://publications-cnrc.canada.ca/fra/voir/objet/?id=9200895b-1ada-427e-a7ec-8d17edfcab83
IONAL RESEARCH COUNCIL O F CANADA
rL NATIONAL DE RECHERCHES DU CANADA
* - o # -
-7s.;
G. ,-I
3
.
. d5STRAIN MEASUREMENTS ON PERFORATED
AKWATER AT BAlE COMEAU
by
R. B. Dryburgh, B. G. Peter and W. G. Plewes
R e p r i ~ r f e c l frol?i T h e E ~ r g i ~ l e e ~ . i r l g Jolrr~rul V o l . 50, N o . 6 , Jlorc 1967
p . 19-23
Research Paper
No. 323
of the
Division of Building Research
Price
LO
centsOTTAWA
J u l y
1967
MESURE DES CONTRAINTES AFFECTANT
L E BRISE-LAMES A PAREMENT AJOURE
DE BATE-COMEAU
SOMM AIRE
Les auteurs dCcrivent les travaux d'Ctude du cornporternent du gros ceuvre du parenlent externe ajourC du nouveau brise-lames de Baie-Comeau. Des jauges de contrainte B rCsistance Clectrique furent assujetties aux aciers d'arrnature, d'un panneau du parernent ajourC; les auteurs dtcrivent les difficultis rencontrkes et la rndthode rnise au point pour les surrnonter. 11s comparent les contraintes rninirnes relevCes au moment d'une ternpkte avec les valeurs des contraintes basCes sur des considCrations thkoriques, et troll- vent une bonne correspondance. Les auteurs en concluent que le gros ceuvre du parernent ajourC est de soliditt plus que suffisante pour rCsister B la force prCvue des vagues.
Strain Measurements on Perforated
Breakwater at Baie Comeau
R. B. Dryburgh, M.E.I.C. Division of Building Research National Research Council Ottawa, Ont.
B. G. Peter
Division of B ~ ~ i l d ~ n g Research National Research Council Ottawa, Ont.
In 1962 a new type of bleakwater was built at Baie Comeau, Quebec, by the Harbors and Rivers Engineering Branch of the Department of Public Works of Canadal--l (Fig. 1). It forms an extension of an existing breakwater, and consists of nine rectangular, reinforced concrete caissons placed end to end, each caisson being essentially a concrete box divided into several compartments by cross walls (Fig. 2). The overall dimensions of each caisson are approxin~ately 60 ft. wide by 108 ft. long by 55 ft. high. The front wall is perforated by holes 3 ft. 0 in. in diameter and behind it is a vacant cell known as the wave chamber.
This design was developed by the Hydraulics Section of the Mechanical
W. G. Plewes, M.E.I.C. Division of Building Research National Research Council Ottawa, Ont.
Engineering Division of the Nalional Research Council, where research and model studies showed that this novel type of breakwater would provide good energy absorption characteristics as well as set up currents that would reduce or eliminate the problem of erosion.",
Strain Measurement Program
The thickness of the perforated sea-wall of the breakwater was governed mainly by hydraulic considerations, and the structural design was based on flotation pressures, ice pressure and wind and wave action. The pressures due to wave action were predicted by theoretical means and from model tests. Owing to
the assunlptions required in the analysis, and the fact that this was the first breakwater of its type, the design was necessarily conservative. I n view of this, it was considered desirable to observe the performance of the breakwater in service in order to provide information for future designs and to correlate with any further analytical or model studies. The Division of Building Research, NRC, was asked to make a study of the struc- tural aspects of the breakwater by means of strain gauges. Although a conlplete study by this means was not possible,
F i g . 1. T h e Dr.eak~vater (Pholo courtesy o f Depar./rilerzt of P~lDlic W o r k s )
Fig.
T-
it was agreed that instrumentation of one typical panel of the perforated wall should provide information of the type required.
The method used for measurement of the strains was to mount bonded elec- trical resistance strain gauges on the reinforcing bars of one bay of one cais- son. The centre bay of caisson No. 5 was chosen for reasons of symmetry, and because a transformer room located in the middle bay at this point pro- vided a good location for the necessary
recording equipment.
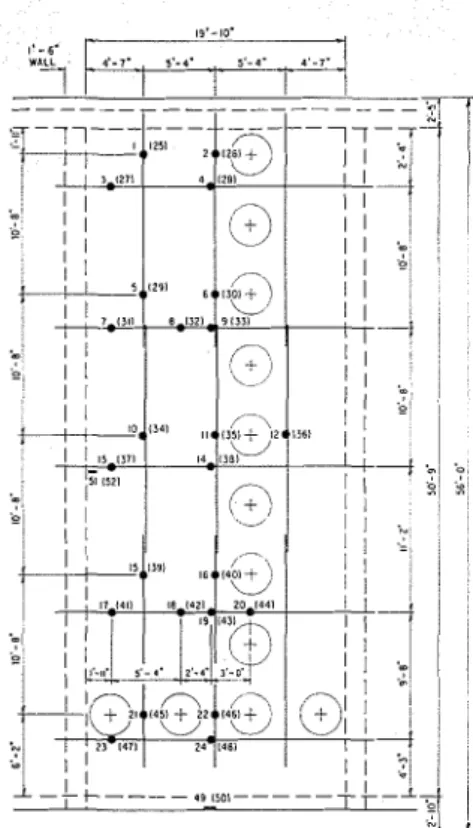
The pattern of the gauges is shown in Fig. 3, with 24 gauge points on the front
2. Plart 13iew of typical caissorr
6 0 ' - 0 "
r--
--7
B O L L A R D STEEL-
GRATING 0 * :so a. WAVE I'
CHAMBER.,&g
8 Im
L) - 0::-,
0 - 0 . GRAVEL AND DI I . - O ROCK F I L La
2-
ItdUGt W U Y B t R I I" B I I P L R L T I TOR R t I I R FACE
Fig. 3. Gnrcge locntiotls
face reinforcement and a corresponding 24 points on the rear face reinforce- ment. T h e gauge points were confined mainly to the south half of the bay, with a few points on the north half to check the symmetry of the strains.
Strain Gauge Mounting Technique
I t is well known that electrical re- sistance strain gauges are extremely susceptible t o deterioration from mois- ture. Their protection from moisture penetration is a problem whenever they are used in the field. In this case, the problem of waterproofing the gauges was aggravated by the fact that the lowest gauges would be in concrete under 20 ft. of salt water, and that all gauges would be required to remain usable for as much as one year. T o meet these conditions a rather elaborate gattge waterproofing system was devised.7
T h e gauges were mounted on reinforc- ing bars at the Building Research Centre in Ottawa. They were waterproofed with several layers of differing materials and protected from physical damage by a metal sleeve tack welded to the bar at one end (Fig. 4). The horizontal rein- forcement consisted of #9 bars, the vertical reinforcement of #7 bars; there were up to four gauge points on a bar. T h e instrumented bars were crated and shipped to the site at Baie Comeau, where they were installed as part of the normal reinforcement of the caisson.
Fig. 4. Typical slrnirl gauge poitlt
Circuits and Recording System
Wave Height Measurements
Each gauge point consisted of two foil-type electrical resistance, bonded gauges mounted on diametrically oppo- site sides of the bar and wired in series to form one arm of a Wheatstone bridge circuit. T h e leads from the gauges were connected in the transformer room to a "dummy box," which provided the ad- jacent arm of the bridge by means of two similar gauges mounted o n a short steel plate. T h e dummy gauges were mounted at this point rather than in the wall adjacent to the active gauges t o avoid the extra risk of moisture penetra- tion.
As measurements of the actual water pressure against the face of the break- water could not be obtained owing to lack of suitable instrumentation, a con- tinuous measurement of the height of water on each side of the perforated wall was taken to aid in the interpretation of the results. T w o step-resistance wave measuring cables were used, adapted from a wave measuring staff developed by the U.S. Navy Hydrographic 0ffice.s These indicated the height of water in I-ft. steps. One cable was attached to each face of the front wall of the break- water, the outer one being protected by Balancing equipment provided the re- a 4 by 4-in. steel angle clamped to the maining two arms of the bridge circuit wall. Wave heights were recorded on the and allowed for adjustment of the resis- oscillograph used to record strain meas- tive and capacitative balance. Instru- urements.
mentation was not available for simul- taneous reading of all 48 gauge points,
but a terminal board permitted the
Zero Drift
selection of any group of 12 for connec- tion to the amplifiers, which also sup- plied the power to the bridge circuit. The amplified signals were then recorded by a recording oscillograph.
Concrete Tests
T o determine the properties of the concrete in the wall, nine standard test cylinders and six beams were made from the concrete being placed when each horizontal bar was installed in the caisson. These samples were stored at the site under damp sand until November and December 1962, when they were brought to the Ottawa laboratory in two lots and stored under moist conditions at a temperature of 3 5 ° F designed t o ap- proximate the conditions at the site during the winter. T h e specimens were tested for compressive strength and ~llodulus of r u p t ~ u e at the time that the strains in the wall were recorded.
Daily observations and corrections of gauge zero drift were made over the spring storm period from 30 March to 10 May 1963. Owing to the dynamic nature of the phenomenon being ob- served, gauge drift did not greatly affect the interpretation of the recorded in- formation, but the measuring circuits had to be kept as closely balanced as possible in order to maintain the read- ings within the range of the recording oscillograph. T h e procedure used in the daily rebalancing was first to record the drift of each channel and then to re- balance the circuits. Two gauges, in addi- tion t o two originally damaged during installation were found to be out of balancing range at the start of the ob- servation period.
Disregarding the direction of drift of the individual gauges, the average cun~ulative drift of the 44 gauges read- able over the whole 40-day observation period was equivalent t o 231 micro-in.
per inch. Except where very large values of drift were noted in a few cases, much and probably most of this drift was due to temperature variation, in spite of the fact that temperature com- pensating gauges were used. The trans- former room was simply a n unheated chamber below thc deck slab of the breakwater where the temperature was sensitive to outside weather conditions. Some time was therefore required to establish a reasonably constant tempera- ture within the box enclosing the dummies. Over the last 15 days of ob- servation, however, the average drift, regardless of direction, was 51 micro-in. per inch, and the average daily drift, on the same basis, was equivalent to 21 micro-in. per inch.
Strain Measurements
0 (r
Waves of a magnitude sufficient to
5
+ 54
cause recordable strains occurred only 3
once during the observation period.
5
These were of a sufficient height to topthe older conventional section of the - 5
1 1 1 1 ~ 1 1 1 1 ~ 1 1 1 1 ~ 1 1 1 1 ~ 1 1 1 1 ~ 1 1 1 Cl/ANNEL I GAUGE NO 3 # CHANNEL 7 G4UGE N 0 . 2 7 C H A N N R 8 GAUGE NO.28 CHANNEL 3 GAUGE NO 7 CHANNEL 2 GAUGE N 0 . 4 CHANNEL 10 GAUGE N 0 . 3 2
-
E X T E R I O R W . L .CHANNEL 5 GAUGE NO 9 CHANNEL / I GAUGE NO 3 3
/
CHANNEL I 2 GAUGE NO. 3 6 C H A N N R 6 GAUGE NO I 2 T Y P I C A L S T R A I N A N D WATER L E V E L - S M O O T H E D M E A S U R E D W A T E R L E V E L S n w D I F F E R E N T I A L WATER L E V E L - I I I I I I I I I I I I I I I I I I I I I I I I I I I I breakwater occasionally at high tide.
-
m 5 10 15 2o
25The strains occurring in the reinforce-
-
T I M E , SECONDment under the action of these waves F ; ~ . 5 . ~ ~,.ecords ~ ; ~ ~ l were recorded in groups of twelve. Two
gauges were common to all groups; the
remainder of each group, five from the level at each face of the perforated wall Fig. 5a.
front face and the corresponding five was recorded simultaneously with each T h e amplification used for recording from the rear face, were related gangcs group of strain readings. A typical sec- the strain was such that a 1-in. deflection (e.g. gauges on the same bar). T h e water tion of the record obtained is shown in of the galvanometer trace was equivalent
Table
I
Strains and Equivalent Moments at 4-ft. Differential Water Level
Front Face Rear Face
Garrge Grorrp Clrntrtrel Strain Eqrrivaletzt No. Micro-iti./itr. BM, ft K 1 1 I 0 0 2 2 1 0 0 3 3 1 0 0 4 3 2
+
2 12 5 1 2 0 0 6 2 2+
2 3 7 3 3 -2 3 8 3 4*
9 3 5+
2 12 10 1 3 0 0 11 2 3+
1 3 12 all 6 0 0 13 4 1 0 0 14 4 2+
4 24 15 1 4 0 0 16 2 4 0 0 17 5 1 0 0 18 5 2+
1 3 19 5 3 +2 12 20 5 4 f 2 6 21 1 5 0 0 22 2 5 0 0 23 4 3 0 0 24 4 4fl
6'Gauge inoperative at time of reading
Gauge Groirp No. 25 1 26 2 27 3 28 3 29 1 30 2 3 1 3 32 3 3 3 3 34 I 3 5 2 3 6 all 37 4 3 8 4 39 1 40 2 41 5 42 5 43 5 44 5 45 1 46 2 47 4 48 4 Eqriivaletlt BM, ft K Average Betzdit~g Mometzt fi K 0 0 3 6 0 1.5 3 6 9 0 3 0 7 18 0 1.5 3 3 6 4 0 0 1.5 G
- - -
min. a record several minutes long wa
obtained for each group of gauges.
I ;
.
,
,
/-\
I I I I;
;
-'
\ : I!
I
Results
As the wave heights were recorded in a series of steps, they were replotted to scale as smooth curves (Fig. 5b). The
I I
average wave height measured against I I
-.-.
I I
/.
I Ithe outside face of the wall over the I
I
/ \ I Iperiod recorded was 4 ft. with a maxi- I I I I mum of 9 ft. and an average period of
8 sec. The water level fluctuation at the
interior face was of the same magnitude, 1 1 1 '- 21'-4" with the maximum observed diKerence
between adjacent highs and lows also
9 ft. H O R I Z O N T A L
-
V E R T I C A L-
The curve of differential water level between the two faces of the wall was plotted (Fig. 5b). This gave a measure of the load imposed on the wall at any time. The maximum differential observed showed exterior water levels 6 ft. above and 5 ft. below the corresponding in- terior water levels.
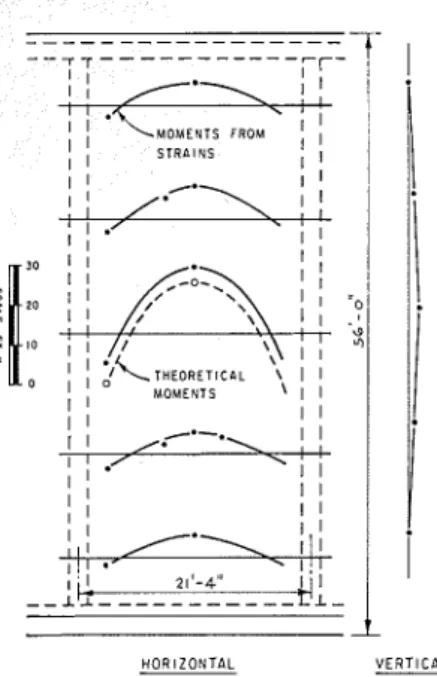
As the maximum differential occurring more than once for each gauge group was +4 ft. (i.e. the outside water level 4 ft. above that inside), the differential was chosen for plotting the distribution of the strains in the wall (Fig. 6). The
I A T MIOSPANI
Fig. 6. Mottzet~t dingrntns
average strain at each gauge point for this differential wave height is shown in Table I. The maximum strain recorded was 5 micro-in. per inch, and many gauges showed zero strain at all times under the prevalent wave conditions.
T o determine the strength of the concrete at the time of measuring the strain, the test cylinders and beams were broken shortly afterwards (Tables I1 and 111). The average compressive strength at
Table
I1Strengths of Concrete Test Cylinders
Tester130 Nov. 1962 Tested 22 M a j ~ 1963 C l d e Date Age at Stretlgth, Age nt Strength,
No. Cnst Test, days psi Test, daj~s psi H-1-1 23 Aug. 62 99
*
2 270 4630 3 270 4380 4 270 4200 H-2-1 22 Aug. 62 100 3960 2 27 1 4520 3 27 1 4240 4 27 1 4670'Cylinder damaged before testing.
Average strength of concrete on 30 Nov. 1962 = 4320 psi. Average strength of concrete on 22 May 1963 = 4910 psl.
Equivalent Moments
As the contributory area of concrete is not the same at each gauge point, neither are the strain measurements a direct indication of the relative moments at the gauge points. T o reduce all the measured strains to a common basis for comparison they were converted to equivalent moments. As the strains were small, the concrete was assumed to be uncracked and the formula M = eEI/y was used to obtain the moment M from the strain E . I was taken as the second moment of the transformed area, assum- ing, on the basis of the concrete cylinder tests, a concrete strength of 4900 psi and E,,,,
=
4 x 10⁶ psi, E,,,,,
=
29 x 106 psi. Where a gauge point fell on the centre- line of a row of holes the width of the section, b, was taken as the width of concrete between the holes, i.e. 28 in.; where the gauge point fell between the rows of holes the width of the section was taken as the full 64-in. width of concrete between the centrelines of the adjacent rows of holes. The moment at a point was taken as the average of the moments calculated from the strains measured on the front and rear reinforc- ing at that point.The moments calculated in this manner were plotted as shown in Fig. 6. As they are derived from such small readings the absolute values may be subject to considerable error although the relative proportions of the bending moments at the various sections are con- sidered valid. T h e maximum moment obtained was, as would be expected, on the horizontal bars at the mid-height of the wall.
Although the strains used for analysis
Table
I11Strengths of Concrete Test Beams
Bentt~ Date Age Fail~rrc Morl~11r1.v
No. Cast Dojz.5 Lonrl,
0)
of Rr~ptrlrc H-1-1 23 Aug. 62 270 6960 560 2 270 6350 510 H-2-1 22 Aug. 62 27 1 8260 685 2 27 1 7460 620 H-3-1 21 Aug. 62 272 7200 600 2 272 7800 650 H-4-1 21 Aug. 62 272 7280 605 2 272 6050 505 H-5-1 15 Aug. 62 279 7850 650 2 279 8460 705nere those occurring when the water level outside was 4 ft. higher than that inside, a check was made on the strains when the water level at the inside face was the higher in order to investigate the possibility of stress reversal. The strains measured in this case were of the same order of magnitude but of opposite sign to those reported here, indicating that reversal of stress occurs when the trough of a wave is at the outside of the wall.
Theoretical Moments
T o provide a basis of comparison for the moments obtained from the measured strains, the maximum theoretical moment under these conditions was calculated. For a wave period of 8 sec. and a water depth of 42 ft. the wave length may be taken as 250 ft.0 The average wave height measured at the wall was 4 ft.; using standard methods of calculation, a clapotis (or standing wave at the face of the wall) of 4 ft. would give a pressure at the base of 80 psf more than that due to the hydrostatic head of still water (Fig. 7). If the pressure on the inside of the wall is assumed to be hydrostatic, a 4-ft. difference in water levels gives an average pressure at the mid-height of the wall of 230 psf. For comparison, the full hydrostatic head resulting from a 4-ft. difference in water level would be 256 psf.
An analysis of the perforated wall under non-uniform loading is not avail- able to date, but on a slab of the dimen-
R E D U C E D C L A P O T I S
sions of this wall it is normally assumed that a transverse strip near the mid- height may be analyzed as an isolated horizontal beam. Using a horizontal strip of wall at the location of gauges 13 and 14, it was assumed that none of the load was carried in the vertical direction. The load carried by a strip 5 ft. 4 in. wide, less the area of the holes, was considered to be uniformly distributed, giving an equivalent load of 800 lb./lin ft. The beam was considered to be of 19-ft. 10- in. clear span, fully fixed at each end. Under these conditions the moment is
- 12 ft. kips at gauge point 13, and 13 ft. kips at gauge point 14. These moments are plotted in Fig. 6 for com- parison with the moments obtained from the measured strains.
Conclusions
The strains recorded were so small that no precise quantitative conclusions may be drawn, but the correlation be- tween theoretical moments and those calculated from strains is good.
For this breakwater the design wave height was 12 ft., and model studies showed that the height of the clapotis should be only 14 ft. The strains under these conditions, assuming a direct wave height to load relationship, would prob- ably therefore not exceed four times those measured. The maximum strain would then be about 20 micro-in. per inch, or equivalent to a steel stress of 600 psi. Assuming, however, that at full
WAVE P R E S S U R E \~
/
'\ \ \ H Y D R O S T A T I C PRESSURE N E T PRESSURE \ \ \ \ /-PRESSURE ON W A L L AT I N S I D E FACEL
- 1
-.B P s . h s ~ P R E S S U R E D I A G R A M Fig. 7. Loads on ~ v n l ldesign wave loads the wall would act as a cracked section the maximum probable steel stress due to wave action is still only 5000 psi. Thus, as anticipated, even under the action of the full design wave, the strains and stresses in the wall are comparatively small.
The present study deals with the per- formance of the breakwater under the action of storm waves only, but other conditions such as construction loads, ice impact loads, durability, and optimum hydraulic dimensions will naturally in- fluence the design.
It may perhaps be noted in conclusion that one of the main challenges to the authors lay in overcoming the problems involved in developing a strain gauge system that could be maintained over a fairly prolonged period under adverse conditions. This was successfully ac- complished and details of the system have been reported elsewhere.?
Acknowledgements
The authors wish to thank the staffs of the Division of Mechanical Engineering, NRC; the Harbors and Rivers Engineer- ing Branch of the Department of Public Works; Cartier, CBtC, Piette, Boulva, Wermenlinger and Associates, Consulting Engineers; and McNamara (Quebec) Ltd., Contractors, for the willing co- operation and assistance given at all times during this project.
This paper is a contribution from the Division of Building Research, National Research Council, and is published with the approval of the Director, and with the permission of the Deputy Minister of the Department of Public Works.
References
1. CBti, G. J. and G. R. Simard. "Le Quaie
Brise-Lames de Baie Comeau." Engineering
Journal, Vol. 46, No. 5, May 1963.
2. Stevenson, C. A. "Perforated Concrete Crib
Breakwater." The Consulting Engineer (Lon-
don), Vol. 25, No. 4, April 1964.
3. "Perforated Crib Breakwater at Baie Comeau
Passes All Tests." Engineering and Contract Record, Vol 76, No. 6, June 1963.
4. "Perforated Crib Breakwater-Wharf." En-
gineering Digest, Vol. 9, No. 6, June 1963. 5. Jarlan, G . E. "A Perforated Vertical Wall
Breakwater!' The Dock and Harbor Authority,
Vol. XLI, No. 486, April 1961.
6. Jarlan, G. E. "Un Nouveau Type de Jet6e Verticale." Travaux, June 1962.
7. Dryburgh, R. B., B. G. Peter and W. G. Plewes. "The Application of Bonded Electrical Resistance Strain Gauges to the Reinforcement
in a Concrete Breakwater Caisson." ( t o be
published)
8. Upham, S. H. "Electrical Wave Staff (Hydro- graphic Office Model Mark I ) . " Technical Re-
port TR-9, U.S. Navy Hydrographic Office,
March 1955.
9. U.S. Army Corps of Engineers. "Shore Pro-
tcction Planning and Design." Technicnl Report No. 4, Bench Erosion Board.
should not be reproduced in whole or in part, without permission of the original p~~blisher. The Division would be glad to be of assistance in obtaining such pern~ission.
Publications of the Division of Building Research may be obtained by mailing the appropriate remittance, (a Bank. Express, or Post Office Money Order or a cheque made payable at par in Ottawa, to the Receiver General of Canada, credit National Research C o ~ ~ n c i l ) to the National Research C o ~ ~ n c i l , Ottawa. Stanlps are not acceptable.
A list of all p~lblications of thc Division of Building Research is available and may be obtained from the Publications Scction, Division of Building Rescarch, National Research C o ~ ~ n c i l , Ottawa. Canada.