Characterizing Fluid Response and Sepsis
Progression in Emergency Department Patients
The MIT Faculty has made this article openly available.
Please share
how this access benefits you. Your story matters.
Citation
Gu, Qiao et al. "Characterizing Fluid Response and Sepsis
Progression in Emergency Department Patients." Proceedings of
the Annual International Conference of the IEEE Engineering in
Medicine and Biology Society, July 2019, Berlin Germany, Institute of
Electrical and Electronics Engineers, October 2019. © 2019 IEEE
As Published
http://dx.doi.org/10.1109/embc.2019.8856521
Publisher
Institute of Electrical and Electronics Engineers (IEEE)
Version
Author's final manuscript
Citable link
https://hdl.handle.net/1721.1/128879
Terms of Use
Creative Commons Attribution-Noncommercial-Share Alike
Characterizing Fluid Response and Sepsis Progression
in Emergency Department Patients
Qiao Gu
1, Student Member, IEEE, Varesh Prasad
2, Student Member, IEEE,
and Thomas Heldt
3, Senior Member, IEEE
Abstract— Sepsis and septic shock are major global pub-lic health concerns. The main therapies for sepsis-related hypotension are fluid resuscitation and vasopressor therapy, though it can be challenging to determine the amount of fluid that should be given or the optimal timing to transition to vasopressor administration. To characterize patients’ response to fluid bolus therapy (FBT) and analyze the sepsis progress using multiple vital signs, we mined a database containing 761 patients presenting to the Emergency Department (ED) with vital signs and laboratory values indicating high risk of septic shock. By clustering the patients’ mean arterial pressure (MAP) time series during a time window around FBT, we found that clusters showing fluid responsiveness during the two hours after FBT only included about 25% of studied boluses. In addition, MAP responses tended to vary based on the initial MAP level. We also found that the trajectories of heart rate and MAP in a 2-D plane demonstrated general trends related to the hemodynamic progression of sepsis and previously described phases of septic shock. Potentially compensatory and decompensatory responses of the cardiovascular system to the insults of sepsis were reflected in the clusters representative of different phases.
I. INTRODUCTION
Sepsis is a life-threatening organ dysfunction caused by a dysregulated host response to infection [1]. Sepsis and septic shock are leading causes of mortality worldwide, resulting in a hospital mortality rate of about 29% in patients identified with severe sepsis [2]. During the progression of sepsis, the dysregulated inflammatory response can cause systemic vasodilation and increased vascular permeability, culminating in septic shock, tissue hypoperfusion, and ultimately end-organ failure [3]. To prevent such progression, aggressive and timely fluid resuscitation – a minimum of 30 mL/kg of body weight within the first 3 hours – is recommended by Surviving Sepsis Campaign guidelines [4].
However, multiple studies have shown that only about half of all sepsis patients demonstrate volume responsiveness (defined as an increase in stroke volume by at least 10%) [5]. In addition, prior work suggests that mean arterial
This work was supported in part by Nihon Kohden Corporation and IROP 2018: MIT-HKUST Summer Research Exchange Program.
1Qiao Gu is with the Department of Electronic and Computer
Engineer-ing, Hong Kong University of Science and Technology, Hong Kong, China qgu@connect.ust.hk
2Varesh Prasad is with the Harvard-MIT Program in Health
Sci-ences and Technology and the Institute for Medical Engineering & Science, Massachusetts Institute of Technology, Cambridge, MA, USA varesh@mit.edu
3Thomas Heldt is with the Institute for Medical Engineering &
Sci-ence, Research Laboratory of Electronics, and Department of Electrical Engineering & Computer Science, Massachusetts Institute of Technology,
Cambridge, MA, USAthomas@mit.edu
pressure (MAP) functions best as an indicator of volume responsiveness (i.e., correlates with changes in stroke volume or cardiac output) only when the initial MAP is at a relatively low level [6]. Therefore, it can be challenging to decide the timing and amount of fluid resuscitation, especially in a busy emergency department (ED), where invasive or advanced measurements, such as central venous pressure and stroke volume, are not generally available.
Apart from blood pressure, heart rate (HR) is another crucial physiological variable to consider during sepsis. Early in septic shock and prior to fluid loading, elevated HR helps maintain or increase cardiac output and compensate for a decline in stroke volume because of insufficient cardiac preload that results from the relative hypovolemia associated with septic shock [7]. As the condition worsens, due to persistently elevated vascular permeability and vasodilation, the compensatory increase in heart rate becomes insufficient to maintain adequate cardiac output, and thus MAP may continue to decrease even though tachycardia persists [7]. The heart may also incur damage, causing further decreases in both HR and MAP. Therefore, the changes of and inter-action between HR and MAP may reflect the physiological status of patients during the progression of sepsis. Although high HR can compensate for a drop in relative volume and cardiac preload, such tachycardia can also increase myocardial oxygen consumption and compromise coronary perfusion [8]. Therefore, in clinical practice, a fall in HR alongside a rise in MAP is an expected response to FBT [9]. In this paper, we analyzed fluid responsiveness of sepsis patients by clustering their MAP time series around initiation of FBT. We also propose to treat HR and MAP as trajecto-ries over time and use k-means clustering to characterize trends of their trajectories during the overall progression of sepsis. From the clustering results, we characterized sepsis patients status into four phases (early, intermediate, late, and recovery). Although not all patients may go through all four phases, progression and outcome of sepsis are reasonably reflected in the transitions among clusters in our patient cohort.
II. METHODS
A. Data Preparation and Cohort Definition
We utilized the database established in [10], which is composed of vital signs measurements, fluid administration records, and laboratory measurements during patients’ stay in the ED of Massachusetts General Hospital (MGH) in Boston, MA. Development and mining of the database was approved
0.0 0.5 1.0 1.5 2.0 time from bolus (hours)
40 50 60 70 80 90 100 110 120 130 MAP (mmHg) Cluster 1, n: 37 (3.5%) Average MAP change: 25 mmHg
0.0 0.5 1.0 1.5 2.0 time from bolus (hours)
Cluster 2, n: 169 (16%) Average MAP change: 10 mmHg
0.0 0.5 1.0 1.5 2.0 time from bolus (hours)
Cluster 3, n: 52 (4.9%) Average MAP change: 5 mmHg
0.0 0.5 1.0 1.5 2.0 time from bolus (hours)
Cluster 4, n: 359 (34%) Average MAP change: 2 mmHg
−40 −20 0 20 40 Normalized MAP (mmHg) 0.0 0.5 1.0 1.5 2.0 time from bolus (hours)
40 50 60 70 80 90 100 110 120 130 MAP (mmHg) Cluster 5, n: 267 (25%) Average MAP change: -4 mmHg
0.0 0.5 1.0 1.5 2.0 time from bolus (hours)
Cluster 6, n: 114 (11%) Average MAP change: -16 mmHg
0.0 0.5 1.0 1.5 2.0 time from bolus (hours)
Cluster 7, n: 41 (3.9%) Average MAP change: -20 mmHg
0.0 0.5 1.0 1.5 2.0 time from bolus (hours)
Cluster 8, n: 20 (1.9%) Average MAP change: -41 mmHg
−40 −20 0 20 40 Normalized MAP (mmHg)
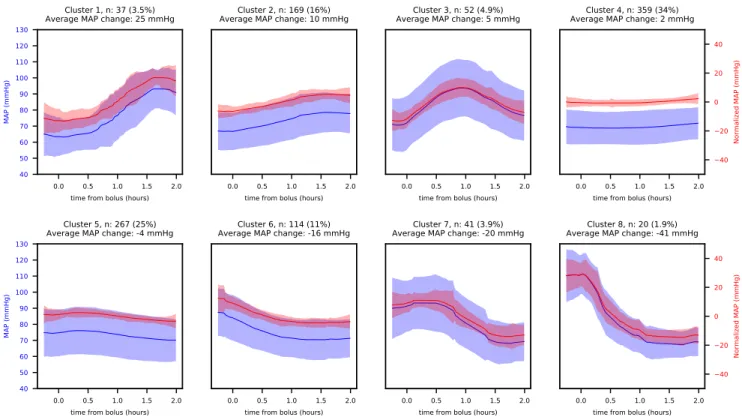
Fig. 1. Clustering results for MAP responses to boluses (8 clusters). n in each figure heading is the number of time series in each cluster, and the
percentage is the ratio of n to the total number of time series (1059). Blue lines are the average of the raw time series for each cluster. Red lines are the average of the normalized time series. Shaded areas indicate one standard deviation above and below the average. Clusters are ordered by net change in MAP during the time window
by the MGH IRB with a waiver of informed consent. From the approximately 186,000 stays included in the database, a cohort of 761 encounters with high risk of septic shock and potential need for vasopressors was identified for analysis by presence of both: 1) evidence of infection by SIRS criteria and ICD-9 codes and 2) evidence of hypotension or hypoperfusion by low systolic blood pressure or elevated serum lactate levels. Manual review of all records confirmed documentation of sepsis at the time of hospital admission. B. Time Series Extraction and Clustering
Due to the sparsity and irregularity of ED vital signs measurements, time series were linearly interpolated between recorded observations at one-minute resolution. MAP was computed as an average of systolic and diastolic pressure, with diastolic pressure given twice as much weight. Only measurements recorded before vasopressor initiation were included in our two primary analyses:
1) MAP response to fluid boluses: To analyze responses to FBT, changes in MAP were studied. For each bolus recorded, we extracted the MAP time series within a time window from 15 minutes before to 2 hours after the recorded bolus start time. We excluded boluses with fewer than 2 MAP measurements within the time window, boluses with vasopressor initiation before or during the time window, and boluses that overlapped with another bolus. To emphasize trends, the mean of each time series was subtracted out as a normalization method. The Euclidean distance metric was used for k-means clustering.
2) Trajectories in HR-MAP plane: To further characterize the hemodynamic status for sepsis patients, the interaction between HR and MAP before vasopressor administration was analyzed. For each patient, the time series of HR and MAP were treated as a trajectory in a 2-dimensional phase space and divided into consecutive equal-sized time windows of 3 or 5 hours. Only the time windows before the initiation of va-sopressors or the termination of ED stay were included. Then the time series were z-normalized and fed into a k-means clustering algorithm that also used Euclidean distances. The average of unnormalized trajectories for each cluster was computed and plotted on the 2D plane. For analysis, cluster numbers were assigned to the trajectories from time windows for each patient. By analyzing the cluster number assigned for consecutive time windows, we calculated the pairwise rates of transition among clusters and identified general trends of HR and MAP during the progress of sepsis.
III. RESULTS
A. MAP Response to Fluid Boluses
In total, there were 761 patients in the cohort, of whom 38 received no fluid boluses and 92 received vasopressors within the time window of the first bolus. From the remaining encounters, we extracted 1059 time series. The average volume is 906 (±314) mL and the average age weighted by the number of boluses received is 64 (±17). We then performed k-means clustering with k = 8.
The average time series for each cluster is shown in Fig.1. Clusters 4 and 5 show only a very minor change in MAP but
65 70 75 80 85 90 MAP (mmHg) 85 90 95 100 105 110 115 HR (bpm) Number of clusters: 4 0 1 2 3 4 Time (hours) 65 70 75 80 85 90 MAP (mmHg) 85 90 95 100 105 110 115 HR (bpm) Number of clusters: 5 0 1 2 3 4 Time (hours) 65 70 75 80 85 90 MAP (mmHg) 85 90 95 100 105 110 115 HR (bpm) Number of clusters: 6 0 1 2 3 4 Time (hours) 65 70 75 80 85 90 MAP (mmHg) 85 90 95 100 105 110 115 HR (bpm) Number of clusters: 4 0.0 0.5 1.0 1.5 2.0 2.5 Time (hours) 65 70 75 80 85 90 MAP (mmHg) 85 90 95 100 105 110 115 HR (bpm) Number of clusters: 5 0.0 0.5 1.0 1.5 2.0 2.5 Time (hours) 65 70 75 80 85 90 MAP (mmHg) 85 90 95 100 105 110 115 HR (bpm) Number of clusters: 6 0.0 0.5 1.0 1.5 2.0 2.5 Time (hours) (4) (1) (2) (3) (4) (1) (2) (3)
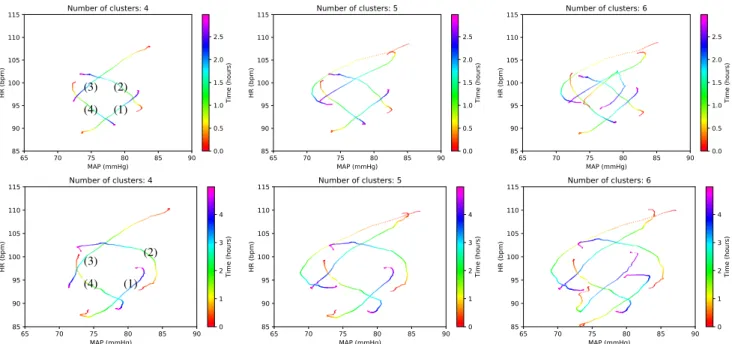
Fig. 2. Average trajectories for clustering results of 1642 HR-MAP trajectories using a 3-hour time window (top row) and average trajectories for clustering results of 862 HR-MAP trajectories using a 5-hour time window (bottom row). Columns show varying choices of the number of clusters. For the upper left sub-figure, the numbers of time series in each cluster are (1) 306, (2) 329, (3) 625, and (4) 382.
include about 60% of all time series. Clusters 1 to 3 show a positive change in MAP but include less than 25% of the time series. About 15% of patients are in Clusters 6-8, in which FBT does not appear to affect a downtrending MAP. B. Trajectories in HR-MAP Plane
For the time windows of 3 hours and 5 hours, we extracted 1642 and 862 HR-MAP trajectories respectively, and compared results with different numbers of clusters. The average trajectories of each cluster are shown in Fig. 2. Results from the 5-hour and 3-hour time windows are used to demonstrate the physiological dynamics within each cluster and the transitions among clusters, respectively. The relative positions of different clusters show a trend of coun-terclockwise transitions in the HR-MAP plane. Notably, this pattern persists even when the number of clusters or the size of the time window is changed. The transitions among clusters were further examined, and the transition rates are shown in Table I for the three-hour, four-cluster time window approach.
IV. DISCUSSION
A. Fluid Responsiveness
According to a recent survey of intensive care specialists, about 50% believe that an increase in MAP of at least 10 mmHg is required to constitute a “response” to FBT [9]. Using this criterion, only Clusters 1-3 in Fig 1 may be considered “responsive” clusters. Moreover, In cluster 3, this response vanishes after the the first hour, explicitly demonstrating the transient effect of FBT in some patients.
Clusters 4 and 5 show only mild changes and patients retain a low MAP (about 60-70 mmHg), which suggests these are “unresponsive” clusters. In Cluster 6-8, initial values of MAP are about 70-90 mmHg, which is higher than the 65
mmHg threshold referenced in sepsis care guidelines [4]. This may indicate that increasing MAP is not necessarily the goal of FBT for patients in Cluster 6-8, and physicians may expect a response in terms of other vital signs [9].
TABLE I
TRANSITION RATES AMONG CLUSTERS IN THE3-HOUR4-CLUSTER APPROACH. “VASOPRESSOR”INDICATES VASOPRESSOR INITIATION IN
THE NEXT TIME WINDOW
Next 1 2 3 4 Vasopressor / Previous (%) 1 16.2 22.1 40.5 12.2 9.0 2 9.7 18.1 25.4 27.0 19.8 3 19.7 10.1 26.0 22.5 21.7 4 21.1 22.9 24.3 22.1 9.6 B. Phases of Sepsis
Average trajectories in Fig. 2 indicate that the general trends of HR and MAP vary with location in the phase space, which may reflect basic compensatory responses to the vascular changes associated with septic shock (as well as subsequent decompensation). From the clustering results of the five-hour, four-cluster setting in Fig. 2, Cluster 1 shows an increase in both HR and MAP. This may be consistent with the early phase of sepsis, as described by Kakihana et al. [7], where stroke volume can be low (because of insufficient cardiac preload from relative hypovolemia) but an increase in HR and/or fluid resuscitation help maintain blood pressure. In the last half hour, however, MAP stops increasing, and the trajectory starts to show similarities to Clusters 2 and 3 transition rates (Table I) naturally show Clusters 2 and 3 as the most common next clusters.
In Cluster 2, after the first hour, the trajectory shows deteriorating MAP although HR continues increasing. This
0 2 4 6 8 10 12 14 16 Time from triage (hours)
60 80 100 120 140
Vital sign values (mmHg or bpm)
MAP SBP DBP HR Vasopressor start bolus start 0 1 2 3 4 5 6 7 8
Lab values for lactate (mmol/L)
blood lacate lab test
65 70 75 80 85 90 MAP (mmHg) 100 110 120 130 140 150 HR (bpm) 0 2 4 6 8 10 12 14
Time from triage (hours)
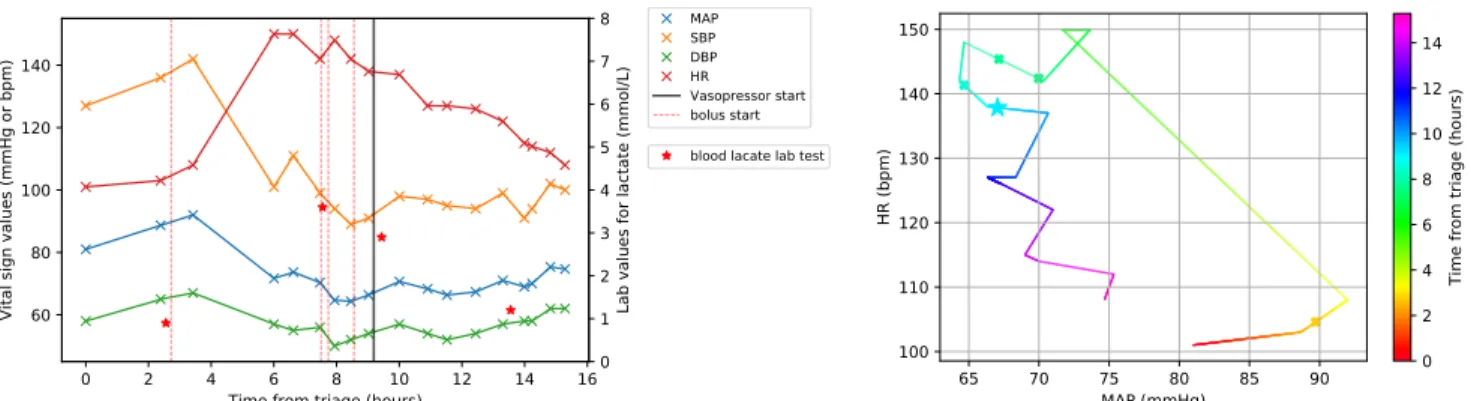
Fig. 3. Vital signs records (left) and HR-MAP trajectory (right) for a 76-year-old male in the cohort. In the right sub-figure, the crosses represent starting
points for fluid boluses and the star initiation of a vasopressor.
cluster may indicate an intermediate phase in which elevated HR can no longer maintain adequate blood pressure. Here, vasopressors may be important, as reflected in Table. I: about 20% of patients in Cluster 2 receive vasopressors within the next time window. About 25% of patients from Cluster 2 instead transition to Cluster 3, where both MAP and HR fall significantly and there is again a high rate of transition to vasopressor initiation (22%). These characteristics may be consistent with entry into a late phase of septic shock with possibly impaired cardiac function, low cardiac output, poor peripheral perfusion, and increased probability of death [7]. Alternatively, transitions also occur commonly from Clusters 2 and 3 to Cluster 4, in which HR drops but MAP increases, and the rate of subsequent vasopressor initiation is low. This cluster may reflect positive responses to resuscitation efforts. Lastly, we note that if more clusters or longer time windows are used, subtle difference and dynamics within a cluster can be revealed. For example, in Fig. 1, Cluster 3 in the first column splits into two when allowing for one more cluster (middle column); one of the new clusters shows increasing MAP near the end of the time window, while the other does not.
C. Case Study
Fig. 3 shows the vital signs records and the HR-MAP trajectory for a 76-year-old patient presenting to the ED with chronic immune compromise. This patient was ultimately admitted to the ICU from the ED, having had a maximum temperature 103 F, abnormal liver function tests, and evi-dence of inflammation on CT scan. His stay in the hospital started with MAP at about 80 mmHg and mild tachycardia with HR at about 100 bpm. In the first 3 hours, both MAP and HR increased, consistent with the early phase of septic shock. However, between the fourth and the sixth hour, with a rapid shift to the top left corner in the HR-MAP plane, the patient reached a HR of 150 bpm and MAP of 70 mmHg. Several fluid boluses were subsequently given, but MAP continued to fall. About eight hours after triage, vasopressor therapy was started, after which the patient showed signs of recovery and stabilization with increasing MAP and decreasing HR.
V. CONCLUSION
Time series clustering of MAP in response to FBT shows that about 40% of boluses failed to increase MAP and that the change in MAP also appeared to be related to the initial MAP level. In addition, by clustering HR-MAP trajectories from throughout the ED stay, we identified trends and transitions that appear consistent with existing descriptions of different phases of sepsis and septic shock occurring progressively or in response to resuscitation efforts. Patterns uncovered by these clustering results persisted despite adjustments of parameters such as the number of clusters and length of the clustered time series. Future work may focus on further describing these patterns in detail or incorporating more variables in clustering like blood oxygen saturation and body temperature to help provide concrete suggestions for clinical practice in managing hemodynamics in septic shock.
REFERENCES
[1] M. Singer et al., “The third international consensus definitions for sepsis and septic shock (sepsis-3),” JAMA, vol. 315, no. 8, pp. 801– 810, 2016.
[2] D. Angus, W. Linde-Zwirble, J. Lidicker, G. Clermont, J. Carcillo, and M. Pinsky, “Epidemiology of severe sepsis in the united states: Analysis of incidence, outcome, and associated costs of care,” Critical Care Medicine, vol. 29, no. 7, pp. 1303–1310, 2001.
[3] R. S. Hotchkiss, L. L. Moldawer, S. M. Opal, K. Reinhart, I. R. Turnbull, and J.-L. Vincent, “Sepsis and septic shock,” Nature reviews Disease primers, vol. 2, p. 16045, 2016.
[4] A. Rhodes et al., “Surviving sepsis campaign: international guidelines for management of sepsis and septic shock: 2016,” Intensive care medicine, vol. 43, no. 3, pp. 304–377, 2017.
[5] P. E. Marik, “The physiology of volume resuscitation,” Current Anesthesiology Reports, vol. 4, no. 4, pp. 353–359, Dec 2014. [6] H. Qi, Q. Gu, N. Liu, and B. Zhang, “Mean arterial pressure as
an indicator of fluid responsiveness in patients with septic shock,” Zhonghua wei zhong bing ji jiu yi xue, vol. 25, no. 1, pp. 32–35, 2013.
[7] Y. Kakihana, T. Ito, M. Nakahara, K. Yamaguchi, and T. Yasuda, “Sepsis-induced myocardial dysfunction: pathophysiology and man-agement,” Journal of Intensive Care, vol. 4, no. 1, p. 22, Mar 2016. [8] A. Morelli et al., “Effect of heart rate control with esmolol on
hemodynamic and clinical outcomes in patients with septic shock: a randomized clinical trial,” JAMA, vol. 310, no. 16, pp. 1683–1691, 2013.
[9] N. J. Glassford et al., “Defining the characteristics and expectations of fluid bolus therapy: a worldwide perspective,” Journal of Critical Care, vol. 35, pp. 126–132, 2016.
[10] V. Prasad et al., “Classification models to predict vasopressor admin-istration for septic shock in the emergency department,” in 2017 39th Annual International Conference of the IEEE Engineering in Medicine and Biology Society (EMBC), July 2017, pp. 2650–2653.