Dfishi Huayuain (UTWER): Using Monte Carlo Simulation to
Value Flexibility in a Chinese Real Estate Development Project
by Qing Ye Bachelor of Architecture, 2004 Zhejiang University Master of Architecture, 2007 Tongji University and. Eric Mo
Bachelor of Urban and Environmental Planning, 2009 University of Virginia MASSACHUsSSIRTITUTE OF TECHNOLOGY
APR
07 2016
LIBRARIES
ARCHWES
Submitted to the Program in Real Estate Development in Conjunction with the Center for Real Estate in Partial Fulfillment of the Requirements for the Degree of
Master of Science in Real Estate Development at the
MASSACHUSETTS INSTITUTE OF TECHNOLOGY February 2016
( 2016 Qing Ye & Eric Mo. All Rights Reserved.
The authors hereby grant to MIT permission to reproduce and to distribute publicly paper and electronic copies of this thesis document in whole or in part in any medium now known or hereafter created.
Signature of Author Signature of Author _ Certified by Accented by
Signature redacted
Signature redacted
Signature redacted
Center for Real Estate January 8, 2016
Center for Real Estate January 8, 2016
Professor David Geltner Professor Real Estate Finance, Department
o
rban Studies and Center for Real Estate, Thesis SupervisorSignature redacted
Professor Albert Saiz Daniel Rose A P rof ban Economics and Real Estate, Department of Urban Studies and Center for Real Estate
ABSTRACT
Du-shi Huayuan (4M r-M):
Using Monte Carlo Simulation to Value Flexibility in a Chinese Real Estate Development Project
By Qing Ye and Eric Mo
Real estate development in China is a fast-paced business. Volatile market conditions have prompted Chinese developers to build and sell quickly in an attempt to mitigate market fluctuation risk, especially when the real estate market is hot. But are they leaving money on the table?
We've conducted a rigorous quantitative analysis of Dushi Huayuan-a large-scale residential project in the fictitious city of Gangkou Shi-from the standpoint of its developer Acumen Properties. The thesis takes the form of a traditional business case study: we first crafted the story based on actual events, then built a Monte Carlo simulation model using Excel to test the value of flexibility-specifically the value of dividing the project into multiple phases-at Dushi Huayuan, and finally designed three exercises for students to learn not only the technical aspects of modeling, but also the business concepts related to working in the Chinese real estate market. The exercises will walk students through the following: (1) build a simulation process to reflect the crucial exogenous dynamic economic variables that largely determine the project's financial outcome; (2) expand upon this model by introducing phases in the project to understand how this new flexibility can affect expected net present value; and (3) employ the use of a waterfall analysis to examine fairness from an investment perspective between joint venture partners using standard-market terms.
Chinese developers-along with most developers worldwide-typically make decisions based on their experiences and intuition but without the use of detailed quantitative analysis. Our thesis ultimately seeks to change generally accepted industry practice by creating a pedagogical tool to help future real estate leaders better understand the advantages of using quantitative methods to inform rational business decisions.
Submitted to the Program in Real Estate Development in Conjunction with the Center for Real Estate on January 8, 2016 in Partial Fulfillment of the Requirements for the Degree of
Master of Science in Real Estate Development at the Massachusetts Institute of Technology
Thesis Supervisor: David Geltner
Professor of Real Estate Finance
ACKNOWLEDGEMENTS
The success and final completion of this thesis required a tremendous amount of guidance and assistance from more people than we could possibly list here, but we would like to acknowledge the people who have been especially meaningful and influential throughout this thesis process and our time at MIT.
I would like to thank my family for your endless support and encouragement. To my parents, for your love and support over the years. To Zheng, for reminding me and helping me to live life to the fullest.
-
Qing
YeEndless thanks and love to my family for your everlasting patience, unwavering support, and steadfast encouragement during my graduate studies here in Cambridge. You have always reminded me to keep life in balance-intellectually, physically, creatively, socially-and to cherish the good company of friends and family.
- Eric Mo
We would like to express our deepest appreciation to our advisor-David Geltner-for your guidance, support, and thoughtful feedback during the thesis process. Your insight has been
extraordinarily influential in the classroom and we look forward to applying what we've learned from you in a professional context. You've inspired us to be life-long learners.
To our classmates and friends at the Center for Real Estate, we have had an unforgettable
experience with you all in the past year and a half and look forward to seeing the amazing ways you will change the world.
And to the many people who provided data for this research, thank you for graciously sharing your time and resources with us. This thesis would not have been possible without your help.
TABLE OF CONTENTS
A b stract ... 2
A cknow ledgem ents ... 3
In tro du ctio n ... 5
Case Study Dishi Huayuin (fi$,rDW): To Phase, or Not to Phase? ... 6
E xh ib its ... 13
Exercise 1: Monte Carlo Simulation in Excel Applied to the Dushi Huayuan Case ... 30
Exercise 2: Using Monte Carlo to Value Flexibility in the Dushi Huayuan Case ... 36
Exercise 3: Analyzing the Dushi Huayuan Joint Venture Deal ... 52
C on clu sion ... 62
E xh ibits ... 64
INTRODUCTION
Our thesis was inspired by Professor David Geltner's "Tools for Analysis: Design for Real Estate and Infrastructure Development" course. After taking the class in the spring of 2015, we quickly understood its applicability to actual development projects despite the real estate industry's general disregard of using rigorous quantitative methods to analyze such projects. The course employed the effective use of business case studies and one specifically-Harvard Business School's Bardhaman Case-revealed how to best apply modeling tools, such as Monte Carlo simulation, to real-world situations.
Equipped with practical working real estate experience in China, we sought to create a similar case study based in the dynamic Chinese market and improve upon the models originally built for the Bardhaman Case. In so doing, we've gained not only insight into the policies and working customs
for a relatively nascent industry in China, but also discovered new findings for valuing flexibility in a very different environment. Even though the Bardhaman case was set in a booming emerging market-India--quite similar to China's, our conclusions yielded unexpected results that are discussed in detail within the individual case exercises and are also summarized in the conclusion. We've conducted a rigorous quantitative analysis of Dushi Huayuan-a large-scale residential project in the fictitious city of Gangkou Shi-from the standpoint of its developer Acumen Properties. The thesis is presented in the form of a traditional business case study: we first crafted the story based on actual events, then built a Monte Carlo simulation model using Excel to test the value of
flexibility-specifically the value of dividing the project into multiple phases-at Dushi Huayuan, and finally designed three exercises for students to learn not only the technical aspects of modeling, but also the business concepts related to working in the Chinese real estate market. The exercises will walk
students through the following: (1) build a simulation process to reflect the crucial exogenous dynamic economic variables that largely determine the project's financial outcome; (2) expand upon this model by introducing phases in the project to understand how this new flexibility can affect expected net present value; and (3) employ the use of a waterfall analysis to examine fairness from an investment perspective between joint venture partners using standard-market terms.
The thesis in its entirety consists of the written case study, three case exercises with solutions, and an accompanying Monte Carlo simulation model. A flowchart describing how the model was structured is provided in Exhibit 1.
liii
CENTER FOR
REAL
ESTATE
PUBLISHED: JANUARY 8, 2016
ERIC Mo
QING YE
Dfishi Huayuin (%7TI7t): To Phase, or Not to Phase?
Fa Ping leaned casually against her desk and gazed out of her office window. Her eyes fell upon a sea of spinning construction cranes hard at work, erecting a new central business district (CBD) in Gangkou Shi (A M C), a large port-city on China's eastern seaboard. Gangkou Shi's economy and population were growing at an unprecedented pace, prompting government officials to plan the new business hub emerging in front of Ping roughly five kilometers from the original city center. In 2009, the population of Gangkou Shi topped 5.7 million, growing 0.5 percent from the previous year'. A 450-meter tall skyscraper, cultural plaza, exhibition hall, and government city complex were already
under construction in the new CBD (see Exhibit 1).
Beyond the new CBD-about a 10-15 minute drive-was Gangkou Shi's "High-Tech Economic Development Zone" (EDZ), anchored by high-tech businesses, research and development labs, and other technology-focused institutions. For example, situated directly across the river from the High-Tech EDZ was Gangkou Shi's largest university. The new CBD was strategically positioned between the original city center and the High-Tech EDZ (see Exhibit 2).
A warm smile and lithe physique masked Ping's sharp business intellect and formidable
negotiation ability. Fresh off leading the successful delivery of Loyal Gardens-a master-planned residential community designed to house approximately 2,500 people, or 800 households-Ping was recently promoted to the Head of Development for Acumen Properties (Acumen), a highly sophisticated and well-respected real estate developer. Several residential projects recently delivered in the new CBD. One such project, New City, was built by Acumen and sold out in record time. It was early 2010 and Acumen had just closed on a land deal with the government late last year for Y2.1 billion Chinese yuan (CNY). Acumen's Chairman turned to Ping to head the development of this new endeavor, which would be very similar to Loyal Gardens in scale and product mix.
Chinese Context
In August 2013, the real estate industry was confirmed as a "pillar industry" by the Chinese State Department; in other words, the Chinese government designated it as an essential segment of
I Survey Office of the National Bureau of Statistics in Gangkou Shi
China's overall economy. Direct investments strictly into Chinese real estate contributed about 6.6 percent of China's Gross Domestic Product (GDP). But China's real estate industry at-large, as a percentage of GDP, was even greater due to ancillary investments into real estate-related industries like design, construction, and infrastructure. From 2003 to 2009, China's GDP more than doubled with an average annual growth rate of roughly 11 percent as shown in Table A.
Table A China's Gross Domestic Product (GDP) and Purchasing Power Parity (PPP), 2003-2009
Year GDP (V10 million CNY) PPP (International Dollars) GDP Growth Rate (%)
2009 34,562.92 10,716.27 9.2 2008 31,675.17 9,851.02 9.6 2007 26,801.94 8,837.65 14.2 2006 21,765.66 7,328.00 12.7 2005 18,589.58 6,403.64 11.3 2004 16,071.44 5,611.50 10.1 2003 13,656.46 4,966.03 10.0
Source: National Bureau of Statistics of the People's Republic of China, Third National Economic Census.
When Acumen made its land purchase in 2009, the Chinese real estate market was booming. Finding an affordable apartment in urban areas became a challenge for homebuyers and complaints about high housing prices were regular media fixtures on television, in newspapers, and online. Meanwhile, affluent Chinese buyers snapped up condominiums as speculative investment properties. They sought growth in value mostly from appreciation and less so from a steady stream of income, since renting these units were generally unprofitable. Many of these investment units remained vacant for years. Economists and urban planners criticized China's housing affordability issue and China's government responded by enacting a number of regulations in an attempt to deflate an emerging housing bubble. These regulations ranged from reducing the land supply available for development to tightening access to capital.
China's land ownership structure is unique. The Chinese government owns and controls all urban land in the country. Unlike common law countries where fee simple ownership constitutes absolute ownership in property by multiple owners, the Chinese government alone has complete control over the supply of land. In China, all land is purchased directly from the government in the form of 70-year ground leases-for residential projects-and come packaged with pre-determined development rights and allowable density. When the Chinese government decides to constrain the supply of land, it can simply cease leasing out new land parcels to private developers. Since there are no recurring annual property taxes collected in China, proceeds from the upfront sale of ground leases generate a significant source of revenue for the government. As China continues to rapidly expand its urban footprint, income from ground leases is often used to build public infrastructure to support the increased density enabled by new development.
2
In many ways, the Chinese government at the municipal level runs like a traditional real estate developer acting in the early stages of development. When urban expansion occurs, it buys out existing leasehold agreements from farmers on the fringes of urban areas at a "fair market value," assembles larger contiguous tracts of land, creates a masterplan for the aggregated land, and finally leases out individual parcels in the new masterplan. The overall process creates value and tends to push land prices upward. As a result, a consequence of the government's role in city building is exorbitantly high land prices as a percentage of total development costs (TDC). However, TDCs as a whole in emerging real estate markets like China are significantly lower than those of projects in more mature ones, in large part because labor and construction costs are so inexpensive.
The History
Acumen was established in 1990 and is headquartered in Gangkou Shi. It has a long history-relative to China's recent institutionalization of the real estate industry-specializing in urban luxury high-rise condominiums and townhomes. Over the years, Acumen has earned the enviable position of preeminent developer in the local market for building high-quality residential communities. They've capitalized on their successes. Unmatched brand loyalty in the market enabled Acumen to sell units at a 10 to 20 percent price premium over comparable projects sponsored by competing developers. In 2015, Acumen was a dominant residential developer in Gangkou Shi, marked by the
30 percent market share it had captured among all housing units in the city.
What really distinguished Acumen from its competitors was its capacity to innovate new products. In China's urban areas, single-family detached homes were not permitted by the building code. But there was still demand for this type of product from buyers who preferred the character of a single-family home over one of a high-rise condominium. As often occurs, the building code gave rise to the invention of something new. In this case, it was the Acumen townhouse: four attached single-family homes surrounding a shared central courtyard, a style reminiscent of the historically ubiquitous Chinese siheyuans (see Exhibit 8). The townhouses were typically two to three stories tall above a one- to two-story basement. Underground built spaces did not count toward allowable density, measured by floor area ratio (FAR), which meant the townhouse basements were effectively "bonus spaces" that could be marketed to prospective buyers as part of the total area of the townhouse unit. For developers who weren't concerned with speed to market in delivery, there was a strong incentive to dig deep-literally-and build elaborate, amenity-filled basements to extract additional value. Since construction costs were so cheap-even costs associated with building underground-townhouse basements turned into a significant source of value creation for Acumen and other developers.
In early 2009, Acumen purchased a ground lease to develop Loyal Gardens, which was located approximately 10 minutes driving distance from Gangkou Shi's new CBD. The simplicity of the townhouse design specifically at Loyal Gardens made swift construction achievable; Acumen was able to begin preselling townhouses nine months after purchasing the ground lease. Ping opted to forgo including basements for the townhouses at Loyal Gardens, despite how lucrative they were, because Acumen's Chairman pushed her for quick delivery. The Chairman knew there were too
many projects to handle in the pipeline and wanted to wrap up Loyal Gardens as efficiently as possible. Without a basement to worry about, Ping was able to satisfy the Chairman's sense of urgency. And by many standards, Loyal Gardens was wildly successful. Merely selling off the townhouse portion of the project-representing only about 28 percent of the total floor area-at or above underwritten sales prices was the approximate breakeven point. Acumen broke even, and then some.
As Ping worked on Loyal Gardens, she noticed escalating demand for luxury buildings in the High-Tech EDZ. Exceptionally educated and appropriately compensated, the workforce attracted to the High-Tech EDZ was accustomed to a luxurious standard of living. There was a shortage of suitable residential product to meet their needs. Acumen hoped to help fill this void with its next project located in the High-Tech EDZ, Dushi Huayuan. In addition to the workforce, Acumen's target market included wealthy individuals looking for real estate investments with high growth potential.
Land Primedfor Development
The site for Dushi Huayuan was situated along the banks of a river that connected Gangkou Shi to the East China Sea (see Exhibits 2 and 3). Trapezoidal in shape, the parcel was bounded on three sides by newly built roads and on the remaining side by the river. Infrastructure under the new roads surrounding the site, including gas and electricity, were also recently installed and in immaculate condition. At the time of purchasing the ground lease, the site was entirely vacant and home to overgrown, wild vegetation. In short, Acumen had a blank slate to work with.
Basic details of the parcel including allowable density and various restrictions can be found in
Table B below. Its location boasted excellent access to various transportation nodes, including
various highways, an airport, and a harbor. To strategically maximize the value of the site, Ping decided to place the high-rise condominium towers along the river so that a greater number of units could take advantage of river views (see Exhibit 4). She also proposed the following land allocation: high-rise condominium floor area totaling 143,000 square meters-644 units-spread over 32,625 square meters in land area and townhouse floor area totaling 60,000 square meters-175 units-filling the remaining 73,225 square meters of the site's total land area.
Speed to market for this project wasn't a high priority; amenity-filled basements would be built for the townhouses at Dushi Huayuan. In China, presales for residential units cannot begin until construction rises above one meter from ground level, which meant the additional time to build out basements and underground parking would delay the start of presales.
4
Table B Dushi Huayuan: Basic Land Information
Category Specifications
Ground lease Executed December 2009 for Y2.117 billion CNY
Land area 105,850 square meters
FAR 2.0
Building coverage 35 percent (as designed)
Height limit 80 meters, negotiable with the government up to 100 meters
Land use Residential; permitted ground floor retail and social amenities in the podium of
the high-rise towers
Residential: 1 parking space per unit <120 square meters
Parking 1.5 parking spaces per unit 120-180 square meters
2 parking spaces per unit >180 square meters
Retail: 1 parking space per 100 square meters
Source: Company documents.
Financial Idiosyncrasies
Instead of the traditional construction loan offered by a bank, Dushi Huayuan was able to negotiate a construction revolving loan that functioned similar to a credit card. (One with a very high credit limit!) The loan featured a loan-to-value (LTV) ratio of 60 percent, meaning when Acumen needed to draw from the loan to pay for expenses, it would be able to borrow 60 percent while contributing the remaining 40 percent with equity. In the same way a traditional revolving loan behaves, Acumen could pay back all or some of the outstanding loan while the line of credit remained open, meaning additional borrowed funds could be drawn out to finance subsequent phases. The construction revolving loan carried an annual interest rate of six percent and the land was used as collateral to secure the loan.
Taxes related to the project could be split into two categories: (1) land taxes and (2) sales-related taxes. A land contract tax of three percent would be paid upfront at the time of land purchase. Also, a land use tax of Y10 CNY per square meter of the total land area would be charged for each year construction occurred. The sales-related taxes, of which there were four, are expectedly all a percentage of sales revenue. Sales taxes of five percent, added value taxes of three percent, other taxes and fees of 0.60 percent, and sales commission of 0.50 percent accounted for all sales-related taxes.
Joint Venture Partner
Ping tapped her professional network to find a suitable partner to invest in Dushi Huayuan. She recalled meeting with associates at a local private equity firm over the holidays who expressed interest in working with Acumen on its next project after hearing about the success of Loyal
Gardens. The group-Golden City Capital (Golden City)-recently closed on its second fund in
2009 and was eager to start deploying capital into new investments. After an expeditious series of
negotiations, the joint venture (V) documents were finalized according to standard-market terms in China (see Table C below) and the Golden City China Residential Opportunistic Fund II (GCROF
II) was set to invest in its first project. The JV partner splits for the first hurdle would be paid pro
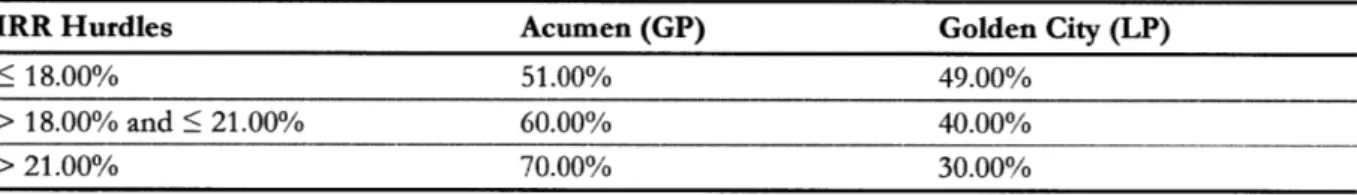
rata-meaning "in proportion" to each partner's contribution of equity-and all hurdles in the promote structure would be paid paripassu-meaning the general partner (GP) and limited partner (LP) would have equal priority claim on and responsibility for any cash flows; there would be no seniority between the equity partners.
Table C Dushi Huayuan: JV Partner Splits and Promote Structure
IRR Hurdles Acumen (GP) Golden City (LP)
18.00% 51.00% 49.00%
> 18.00% and 21.00% 60.00% 40.00%
> 21.00% 70.00% 30.00%
Source: Company documents.
Logistically, the IRRs would be calculated on a contemporary "look-back" basis. In each period of the cash flows, the IRR is calculated until the first hurdle of 18 percent has been reached. The cash flows up to that point would then be split pro rataparipassu, as described previously. Cash flows beyond the 18 percent IRR mark are continuously calculated until the next IRR hurdle at 21 percent. Those series of cash flows beyond the 18 percent IRR mark and up to the 21 percent IRR mark would be distributed paripassu according to the promote structure in Table C. The same method applies to the final hurdle for all cash flows above the 21 percent IRR mark.
Pro Forma Cash Flows
Before Acumen purchased the ground lease for Dushi Huayuan, Ping needed to determine a number of assumptions before modeling the base case pro forma as provided in Exhibits 10 and 11. For your edification, the final ex post cash flow-how the project actually performed as of year-end
2015, or "Year 6"-has been included in Exhibit 122. The future years in the ex post cash flow were
completed with modified assumptions to the ex post sales curves. The Phasing Decision
Since Acumen had been accustomed to working in a thriving real estate market, their general business strategy became "build quickly and sell." But Ping was wise beyond her years. She knew
2 While the case project is fictional, it is patterned after a real project that was actually built in China, and so we can
examine the actual historical results of that project. The numbers are slightly changed to mask identity, but the essence of the project's actual results are described in the Ex Post Project Cash Flow.
6
there was intrinsic value in holding on to a piece of land and not necessarily building upon it immediately. In the same way call options in the stock market have value because they offer an "option but not the obligation" to execute a transaction, unbuilt land carries that same value. As Ping settled back into her desk chair and flipped open her laptop, the billion yuan question remained: "How could she quantify that value?" And consequently, "Is the value of optionality greater than no optionality at all?"
To find out, she began logically dividing the project into three separate phases (see Exhibit 9).
(1) The "Initial Phase" would include the ground floor (podium) of the high-rise buildings and with
it, the full basement serving as the foundation for the high-rise buildings, some 46 percent of the high-rise units, slightly over half of the townhouse units, and the full basement under this portion of townhouses. (2) A "High-Rise Expansion Phase" would include a vertical expansion of the remaining 54 percent of the high-rise units on the high-rise podium. In other words, the high-rise podium will be built in the Initial Phase with the structural capacity to support the construction of approximately 25-30 additional floors of condominium units above the planned retail and amenity space in the podium. (3) Finally, a "Townhouse Expansion Phase" would build out the remainder of the land site, almost doubling the number of townhouse units. The Townhouse Expansion Phase would require construction of additional basement space under the expanded townhouse section of the site. Thus, it should be noted that the marginal cost of production would be much lower in the High-Rise Expansion Phase compared to the Townhouse Expansion Phase because the latter involves significant amounts of additional infrastructure costs, especially as it relates to the buildout of the basement foundation of the townhouses.
All phases would have the flexibility to be delayed. If the residential market took a downward
turn, Ping had the authority to delay buildout of the entire project or any phase as yet not started, avoiding any further expenditures. Commencement of the Initial Phase would be a prerequisite for the commencement of the other two expansion phases. If the Initial Phase is delayed, the expansion phases must be delayed, too, because design elements in the expansion phases are dependent on the buildout of the Initial Phase. As an example, the High-Rise Expansion Phase would be built directly on top of the high-rise podium erected in the Initial Phase. Similarly, the basement-which includes underground parking-in the Townhouse Expansion Phase would directly integrate with the underground parking circulation (e.g. ramps, utilities, etc.) already built in the Initial Phase. Thus, both vertical and horizontal expansion options would need to be modeled such that they could only be exercised after the Initial Phase has been triggered. However, the horizontal expansion option is not dependent on the vertical expansion option, or vice versa.
Ping had a busy morning contemplating these thoughts as her belly managed a slight grumble. It was well past lunch hour and she knew working on an empty stomach wasn't all too productive. She hastily folded her notes, stuffed them in her blazer pocket, and looked forward to bouncing her ideas off her colleagues over a late lunch.
Renderings of Gangkou Sh's New Central Business District (CBD) Ww**
k'-N,
4'.I
I
K
A I P .4-,a
~Source: People's Government of Gangkou ShI website.
8
13
Exhibit I
NOW!,
Exhibit 2 Map of Gangkou Sh's Original City Center, New Central Business District (CBD), High-Tech Economic Development Zone (EDZ), and the Dushi Huyuan Site
Shi
00 fta1f
Il
LoyaL Gardens
Dushi
Huayuan
Source: Fictitious map of Gangkou Shi created by the case authors.
Exhibit 3 Map of Dushi Huayuan Site and Surrounding Area Gangkou University Recently Developed Residential Existing Industrial Developed ako Existing Industrial
Recently Developed R&D Existing industrial
Source: Fictitious contextual map of Dushi Huyuan site created by the case authors.
10
Exhibit 4 River Views from the Dushi F-luvuan Site "~~ *sl- f II A '~L
r~
-r
7'~r~ - > - S;9 ~hsa~ La IU-Source: Photos taken by the case authors.
Exhibit 5 D1ushi IIyuan SitC Pilan
N ~~1~.
r
Source: Courtesy of Acumen Properties.
12
\\K7
4D it I~I-H) '~j
-~?
Exhibit 6 Bird's-Eye Rendering of Dushi Huyuan Built Out
N_
ii
~ 44
/ 7
-J -J 0 0 0 bJ~ 0
~~r
c ZLI
cr
4-., .kb Ki ,i -Mra4 VW.~~ 7- 1-it f"fzf t=tt1
rrrrrrrrrrrl
FF~r 7-T
RI I 19- 1t L L X L L 1 -ii@LR .I
I
t
Exhibit 8 Renderings of Typical Townhouse Buildings at Dushi Huavuan $ - 1111 1 1
Vh'
-y T11 1111 N oil M I I,t
1 v, 01 IF A$-Source: Courtesy of Acumeti Properties.
Exhibit 9 Illustration of Proposed Phasing Strategy at Dushi Huayuan
Dec ision
nitI h aSe ntial Phase
-,ghrise Expansion Phase
yhrise Expansion Ph1
/V
I4;
7W ,4 -:, it4 P4~P
4'Source: Created by the case authors.
16
21
4
Exhibit 10 Development Pro Forma Assumptions
FLOOR/LAND A ALLOCATION
Floor Area [FA] Land Area
Highrise Group (m2 ) FAR [LA] (m2 ) Highrise Housing 143,000 Retail 6,200 Amenities 2,500
SUBTOTAL HIGHRISE GROUP 151,700 4.65 32,625
Floor Area Land Area
Townhouse Group (M2) FAR (M2)
Townhouse Housing A 19,700
Townhouse Housing B 40,300
SUBTOTAL TOWNHOUSE GROUP 60,000 0.82 73,225
TOTAL 211,700 105,850
A PRICES AND COSTS
Highrises Townhouses Retail Amenities Price/M2 (CNY) Y32,800 Y33,000 Y32,800 YO Cost/M2 (CNY) Y1,800 Y2,000 Y1,800 Y1,800 Profit/M2 (CNY) Y31,000 Y31,000 Y31,000 -1,800 No. of Units 644 175 60 0 FA (M2 ) 143,000 60,000 6,200 2,500 Avg Size/ Unit (M2) 222.05 342.86 103.33 0.00 SUBTOTAL 879 211,700
Underground Parking Y2,763 Y2,350 Y413 1,674 72,700 43.43
452
Other Base me nt Space YO Y2,350 -Y2,350 0 39,600 0.00
SUBTOTAL 1,674 112,300
TOTAL 2,553 324,000
Source: Adapted by case authors from company documents. Some figures have been disguised.
Exhibit 10 (continued)
Price/FA (CNY/m 2) Y10,000
Buildable FAR 2.00
Price/FA*FAR (CNY/m2
) Y20,000
Land Area (m2) 105,5)0
TOTAL LAND PRICE (000 CNY) *2,117,000
CONSTRUCTION COSTS AND FEES (000 CNY)
Primary Infrastructure Y98,000
Pre-Construction Y25,000
Consultant Fees Y34,000
Social Infrastructure Y400
Indirect Fees Y38,000
Mgmt Fees & Overhead (for Sales & Constrn Yrs) Y500
TAXES AND OTHER SALES-RELATED COSTS
Land Taxes
Land Contract Tax (% of Total Land Price) 3.00% Land Use Tax (CNY/m2 for Construction Yrs) Y10.00
Sales-Related Taxes
Sales Tax (% of Sales Rev) 5.00%
Added Value Tax (% of Sales Rev) 3.00%
Other Taxes and Fees (% of Sales Rev) 0.60%
Sales Commission (% of Sales Rev) 0.50%
TOTAL SALES-RELATED COSTS (% of Sales Rev) 9.10%
TM MG
Year to Start Highrise Group Construction Year 4
Total Years to Build Out Highrise Group 3 Year(s)
Year to Start Townhouse Group Construction Year 3
Total Years to Build Out Townhouse Group 4 Year(s)
CONSTRUCTION REVOLVING LOAN
Loan-to-Value [LTV] Ratio Annual Interest Rate
60.00% 6.00%
Source: Adapted by case authors from company documents. Some figures have been disguised.
18
23
Exhibit 11 Pro Forma Project Cash Flow and Capital Structure
SALES CURVES Totals) Year 0 Year 1 Year 2 Year 3 Year 4 Year 5 Year 6 Year 7 Year 8 Year 9 Year 10
Housing Discount 100.0% 100.0% 100.0% 100.0% 100.0% 100.0% 100.0% 100.0% 100.0% 100.0%
Highrise 100.0% 0.0% 0.0% 0.0% 60.0% 20.0% 10.0% 10.0% 0.0% 0.0% 0.0%
Townhouse 100.0% 0.0% 0.0% 60.0% 20.0% 10.0% 10.0% 0.0% 0.0% 0.0% 0.0%
Retail 100.0% 0.0% 0.0% 0.0% 0.0% 0.0% 60.0% 20.0% 10.0% 10.0% 0.0%
Parking 100.0% 0.0% 0.0% 0.0% 0.0% 60.0% 20.0% 10.0% 10.0% 0.0% 0.0%
COST CURVES Totals Year 0 Year 1 Year 2 Year 3 Year 4 Year 5 Year 6 Year 7 Year 8 Year 9 Year 10
Primary Infrastructure 100.0% 0.0% 0.0% 5.0% 10.0% 10.0% 65.0% 10.0% 0.0% 0.0% 0.0% Pre-Construction 100.0% 5.0% 90.0% 5.0% 0.0% 0.0% 0.0% 0.0% 0.0% 0.0% 0.0% Consultant Fees 100.0% 30.0% 30.0% 10.0% 10.0% 20.0% 0.0% 0.0% 0.0% 0.0% 0.0% Social Infrastructure 100.0% 0.0% 0.0% 0.0% 15.0% 70.0% 15.0% 0.0% 0.0% 0.0% 0.0% Indirect Fees 100.0% 0.0% 20.0% 10.0% 20.0% 30.0% 20.0% 0.0% 0.0% 0.0% 0.0% Basement 100.0% 0.0% 40.0% 30.0% 10.0% 10.0% 10.0% 0.0% 0.0% 0.0% 0.0%
SUMMARY CASH FLOW Totals Year 0 Year 1 Year 2 Year 3 Year 4 Year 5 Year 6 Year 7 Year 8 Year 9 Year 10
Land & infrastructure Cost
Land Purchase 000 CNY (2,117,000) (2,117,000)
Primary Infrastructure 000 CNY (98,000) 0 0 (4,900) (9,800) (9,800) (63,700) (9,800) 0 0 0
Pre-Construction 000 CNY (25,000) (1.250) (22,500) (1,250) 0 0 0 0 0 0 0
Consultant Fees 000 CNY (34,000) (10,200) (10,200) (3,400) (3,400) (6,800) 0 0 0 0 0
Social Infrastructure 000 CNY (400) 0 0 0 (60) (280) (60) 0 0 0 0
Indirect Fees 000 CNY (38,000) 0 (7,600) (3,800) (7,600) (11,400) (7,600) 0 0 0 0
Management Fees & Overhead DOO CNY (4,500) (500) (500) (500) (500) (500) (500) (500) (500) (500) 0
Land Taxes
Land Contract Tax 000 CNY (63,510) (63,510)
Land UseTax O0OCNY (5,293) 0 (1,059) (1,059) (1,059) (1,059) (1,059) 0 0 0 0
Total Land & Infrastructure Cost 000 CNY (2,385,703) (2,180,510) (11,950) (41,859) (14,909) (22,419) (29,839) (72,919) (10,300) (500) (500) 0
Revenue and Construction Costs
Closings
Highrises m2 143,000 0 0 0 85,800 28,600 14,300 14,300 0 0 0
Townhouses m. 60,000 0 0 36,000 12,000 6,000 6,000 0 0 0 0
Retail m. 6,200 0 0 0 0 0 3,720 1,240 620 620 0
Parking (only Highrise) Spaces 1,222 0 0 0 0 733 244 122 122 0 0
Sales Revenue
Highrises 000 CNY 4,690,400 0 0 0 2,814,240 938,080 469,040 469,040 0 0 0
Townhouses 000 CNY 1,980,000 0 0 1,188,000 396,000 198,000 198,000 0 0 0 0
Retail 000 CNY 203,360 0 0 0 0 0 122,016 40,672 20,336 20,336 0
Parking (only Highrise) 000 CNY 146,640 0 0 0 0 87,984 29,328 14,664 14,664 0 0
Exhibit 11 (continued) Construction Costs Highrises Townhouses Retail Amenities Basement
Subtotal Construction Costs
000 CNY 000 CNY 000 CNY 000 CNY 000 CNY 000 CNY (257,400) (120,000) (11,160) (4,500) (263,905) (656,965) 0 0 0 0 0 0 0 0 0 0 (105,562) (105,562) 0 (30,000) 0 0 (79,172) (109,172) (85,800) (30,000) (3,720) (1,500) (26,391) (147,411) (85,800) (30,000) (3,720) (1,500) (26,391) (147,411) (85,800) (30,000) (3,720) (1,500) (26,391) (147,411) 0 0 0 0 0 0 0 0 0 0 0 0 0 0 0 0 0 0 0 0 0 0 0 0
Total Revenue and Construction Costs 000 CNY 6,363,435 0 (105,562) 1,078,829 3,062,830 1076,654 670,974 524,376 35,000 20,336 0
Sales-Related Costs
SalesTax 000 CNY (351,020) 0 0 (59,400) (160,512) (61,203) (40,919) (26,219) (1,750) (1,017) 0
Added Value Tax 000 CNY (210,612) 0 0 (35,640) (96,307) (36,722) (24,552) (15,731) (1,050) (610) 0
Other Taxes and Fees 000 CNY (42,122) 0 0 (7,128) (19,261) (7,344) (4,910) (3,146) (210) (122) 0
Sales Commission 000 CNY (35,102) 0 0 (5,940) (16,051) (6,120) (4,092) (2,622) (175) (102) 0
Total Sales-Related Costs OOOCNY (638,856) 0 0 (108,108) (292,132) (111,390) (74,473) (47,718) (3,185) (1,851) 0
Unlevered Summary Net Cash Flow (2,180,510) (11,950) (147,421) 955,812 2,748,279 935,425 523,582 466,358 31,315 17,985 0
Cumulative (2,180,510) (2,192,460) (2,339,881) (1,384,069) 1,364,211 2,299,636 2,823,218 3,289,576 3,320,891 3,338,876 3,338,876
Unlevered IRR 23.37%
Construction Revolving Loan
Loan Proceeds 1,308,306 7,170 88,452 0 0 0 0 0 0 0 0
Cumulative Loan Proceeds 1,308,306 L393,974 1,566,065 1,660,029 803,819 0 0 0 0 0 0
Interest (78,498) (83,638) (93,964) (99,602) (48,229) 0 0 0 0 0 0
Loan Payoff 0 0 0 (955,812) (852,048) 0 0 0 0 0 0
Levered Summary Net Cash Flow (872,204) (4,780) (58,968) 0 1,896,231 935,425 523,582 466,358 31,315 17,985 0 Cumulative (872,204) (876,984) (935,952) (935,952) 960,279 1,895,704 2,419,286 2,885,644 2,916,959 2,934,945 2,934,945 Levered IRR 35.62%
Exhibit 11 (continued) CAPITAL FLOWS
Bank Une Drawn 1,403,928
Max Capital In (CeilIng) 7.500,000
Total Capital Required 935,952
Acumen 51.00% 477,336
Golden City 49.00% 458,617
Total 100.00% 935,952
Totals Year 0 Year 1 Year 2 Year 3 Year 4 Year 5 Year 6 Year 7 Year 8 Year 9 Year 10
Levered Net Cash Flow Before Distributions 2,934,945 (872,204) (4,780) (58,968) 0 1,896,231 935,425 523,582 466,358 31,315 17,985 0
Capital Contributions
Acumen 51,00% 477,336 444,824 2,438 30,074 0 0 0 0 0 0 0 0
Golden City 49.00% 458,617 427,380 2,342 28,894 0 0 0 0 0 0 0 0
Project 100.00% 935,952 872,204 4,780 58,968 0 0 0 0 0 0 0 0
Project Distributions
Distribution to First Hurdle 18.00% 845,019 (872,204) (4,780) (58,968) 0 1,780,971 (0) 0 0 0 0 0
Distribution to Second Hurdle 21.00% 197,805 0 0 0 0 115,261 82,545 0 0 0 0 0
Distribution to Final Hurdle 1,892,121 0 0 0 0 0 852,880 523,582 466,358 31,315 17,985 0
Partner Distributions
Acumen CF to First Hurdle 51.00% 430,959 (444,824) (2,438) (30,074) 0 908,295 (0) 0 0 0 0 0
Golden City CF to First Hurdle 49.00% 414,059 (427,380) (2,342) (28,894) 0 872,676 (0) 0 0 0 0 0
Acumen CF to Second Hurdle 60.00% 118,683 0 0 0 0 69,156 49,527 0 0 0 0 0
Golden City CF to Second Hurdle 40.00% 79,122 0 0 0 0 46,104 33,018 0 0 0 0 0
Acumen CF to Final Hurdle 70.00% 1,324,484 0 0 0 0 0 597,016 366,507 326,450 21,921 12,590 0
Golden City CF to Final Hurdle 30.00% 567,636 0 0 0 0 0 255,864 157,075 139,907 9,395 5,396 0
Overall Net Cash Flows
Acumen 1,874,127 (444,824) (2,438) (30,074) 0 977,451 646,543 366,507 326,450 21,921 12,590 0
Golden City 1,060,817 (427,380) (2,342) (28,894) 0 918,780 288,882 157,075 139,907 9,395 5,396 0
Project 2,934,945 (872,204) (4,780) (58,968) 0 1,596,231 935,425 523,582 466,358 31,315 17,985 0
Gross Payback
v & PROJECT RETURN METRICS IRR NPV Ratio
Acumen 39.64% $484,857 4.93
Golden City 30.64% $204,662 3.31
Project 35.62% $1,045,329 4.14
Exhibit 12 Ex Post Project Cash Flow and Capital Structure
SALES CURVES Totals) Year 0 Year 1 Year 2 Year 3 Year 4 Year 5 Year 6 Year 7 Year 8 Year 9 Year 10
Housing Discount 100.0% 100.0% 100.0% 100.0% 100.0% 100.0% 90.0% 90.0% 100.0% 100.0%
Highrise 100.0% 0.0% 0.0% 0.0% 40.0% -1.0% 14.8% 20.0% 15.0% 10.0% 1.2%
Townhouse 100.0% 0.0% 0.0% 72.0% 9.0% -2.4% 11.4% 10.0% 0.0% 0.0% 0.0%
Retail 100.0% 0.0% 0.0% 0.0% 0.0% 0.0% 30.0% 30.0% 15.0% 15.0% 10.0%
Parking 100.0% 0.0% 0.0% 0.0% 0.0% 2,7% 28.2% 28.0% 20.0% 15.0% 6.1%
COST CURVES Totals Year 0 Year 1 Year 2 Year 3 Year 4 Year 5 Year 6 Year 7 Year 8 Year 9 Year 10
Primary Infrastructure 100.0% 0.0% 0.0% 5.0% 10.0% 10.0% 65.0% 10.0% 0.0% 0.0% 0.0% Pre-Construction 100.0% 5.0% 90.0% 5.0% 0.0% 0.0% 0.0% 0.0% 0.0% 0.0% 0.0% Consultant Fees 100.0% 30.0% 30.0% 10.0% 10.0% 20.0% 0.0% 0.0% 0.0% 0.0% 0.0% Social infrastructure 100.0% 0.0% 0.0% 0.0% 15.0% 70.0% 15.0% 0.0% 0.0% 0.0% 0.0% Indirect Fees 100.0% 0.0% 20.0% 10.0% 20.0% 30.0% 20.0% 0.0% 0.0% 0.0% 0.0% Basement 100.0% 0.0% 40.0% 30.0% 10.0% 10.0% 10.0% 0.0% 0.0% 0.0% 0.0%
SUMMARY CASH FLOW Totals Year 0 Year 1 Year 2 Year 3 Year 4 Year 5 Year 6 Year 7 Year 8 Year 9 Year 10
Land & Infrastructure Cost
Land Purchase 000 CNY (2,117,000) (2,117,000)
Primary Infrastructure 000 CNY (98,000) 0 0 (4,900) (9,800) (9,800) (63,700) (9,800) 0 0 0
Pre-Construction 000CNY (25,000) (1,250) (22,500) (1,250) 0 0 0 0 0 0 0
Consultant Fees 000 CNY (34,000) (10,200) (10,200) (3,400) (3,400) (6,800) 0 0 0 0 0
Social infrastructure 000 CNY (400) 0 0 0 (60) (280) (60) 0 0 0 0
Indirect Fees OOOCNY (38,000) 0 (7,600) (3,800) (7,600) (11.400) (7,600) 0 0 0 0
Management Fees & Overhead 000 CNY (5,000) (500) (500) (500) (500) (500) (500) (500) (500) (500) (500)
Land Taxes
Land Contract Tax 000 CNY (63,510) (63,510)
Land UseTax 000CNY (5,293) 0 (1,059) (1,059) (1,059) (1,059) (1,059) 0 0 0 0
Total Land &Infrastructure Cost 000CNY (2,386,203) (2,180,510) (11,950) (41,859) (14,909) (22,419) (29,839) (72,919) (10,300) (500) (500) (500)
Revenue and Construction Costs
Closings
Highrises m 143,000 0 0 0 57,200 (1,430) 21,164 28,600 21,450 14,300 1,716
Townhouses m, 60,000 0 0 43,200 5,400 (1,440) 6,840 6,000 0 0 0
Retail m. 6,200 0 0 0 0 0 1,860 1,860 930 930 620
Parking (only Highrise) Spaces 1,222 0 0 0 0 33 345 342 244 183 75
Sales Revenue
Highrises 000 CNY 2,180,321 0 0 0 903,760 (22,594) 334,391 406,692 305,019 225,940 27,113
Townhouses 000 CNY 1,520,640 0 0 1.105,920 1-38,240 (36,864) 175,104 138,240 0 0 0
Retail 000 CNY 49,600 0 0 0 0 0 14,880 14,880 7,440 7,440 4,960
Parking (only Highrise) 000 CNY 61,100 0 0 0 0 1,650 17,230 17,108 12,220 9,165 3,727
Subtotal Sales Revenue 000 CNY 3,811,661 0 0 1,105,920 1,042,000 (57,808) 541,605 576,920 324,679 242,545 35,800
22
Exhibit 12 (continued) Construction Costs Highrises 000 CNY Townhouses 000 CNY Retail 000 CNY Amenities 000 CNY Basement 000 CNY
Subtotal Construction Costs 000 CNY
(257,400) (120,000) (11,160) (4,500) (263,905) (656,965) 0 0 0 0 0 0 0 0 0 0 (105,562) (105,562) 0 (30,000) 0 0 (79,172) (109,172) (85,800) (30,000) (3,720) (1,500) (26,391) (147,411) (85,800) (30,000) (3,720) (1,500) (26,391) (147,411) (85,800) (30,000) (3,720) (1,500) (26,391) (147,411) 0 0 0 0 0 0 0 0 0 0 0 0 0 0 0 0 0 0 0 0 0 0 0 0
Total Revenue and Construction Costs 000 CNY 3,154,696 0 (105,562) 996,749 894,590 (205,219) 394,195 576,920 324,679 242,545 35,800
Sales-Related Costs
Sales Tax 000 CNY (190,583) 0 0 (55,296) (52,100) 2,890 (27,080) (28,846) (16,234) (12,127) (1,790)
Added Value Tax 000 CNY (114,350) 0 0 (33,178) (31,260) 1,734 (16,248) (17,308) (9,740) (7,276) (1,074)
Other Taxes and Fees 000 CNY (22,870) 0 0 (6,636) (6,252) 347 (3,250) (3,462) (1,948) (1,455) (215)
Sales Commission 000 CNY (19,058) 0 0 (5,530) (5,210) 289 (2,708) (2,885) (1,623) (1,213) (179)
Total Sales-Related Costs 000 CNY (346,861) 0 0 (100,639) (94,822) 5,261 (49,286) (52,500) (29,546) (22,072) (3,258)
Unlevered Summary Net Cash Flow (2,180,510) (11,950) (147,421) 881,201 777,349 (229,797) 271,990 514,220 294,633 219,973 32,042
Cumulative (2,180,510) (2,192,460) (2,339,881) (1,458,679) (681,330) (911,127) (639,137) (125,016) 169,617 389,590 421,632
Unlevered IRR 3.34%
Construction Revolving Loan
Loan Proceeds 1,308,306 7,170 88,452 0 0 137,878 0 0 0 0 0
Cumulative Loan Proceeds 1,308,306 1,393,974 1,566,065 1660,029 878,429 291,664 309,164 55,724 0 0 0
Interest (78,498) (83,638) (93,964) (99,602) (52,706) (17,500) (18,550) (3,343) 0 0 0
Loan Payoff 0 0 0 (881,201) (777,349) 0 (271,990) (59,067) 0 0 0
Levered Summary Net Cash Flow (872,204) (4,780) (58,968) 0 0 (91,919) 0 455,053 294,633 219,973 32,042
Cumulative (872,204) (876,984) (935,952) (935,952) (935,952) (1,027,871) (1,027,871) (572,818) (278,185) (58,211) (26,169)
Exhibit 12 (continued) CAPITAL FLOWS
Bank Une Drawn 1,541,806
Max Capital In (Ceiling) 7,500,000
Total Capital Required 1,027,871
Acumen 51.00% 524,214
Golden City 49.00% 503,657
Total 100.00% 1,027,871
Totals Year 0 Year 1 Year 2 Year 3 Year 4 Year 5 Year 6 Year 7 Year 8 Year 9 Year 10
Levered Net Cash Flow Before Distributions (26,169) (872,204) (4,780) (58,968) 0 0 (91,919) 0 455,053 294,633 219,973 32,042
Capital Contributions
Acumen 51.00% 524,214 444,824 2,438 30,074 0 0 46,879 0 0 0 0 0
Golden City 49.00% 503,657 427,380 2,342 28,894 0 0 45,040 0 0 0 0 0
Project 100.00% 1,027,871 872,204 4,780 58,968 0 0 91,919 0 0 0 0 0
Project Distributions
Distribution to First Hurdle 18.00% (26,169) (872,204) (4,780) (58,968) 0 0 (91,919) 0 455,053 294,633 219,973 32,042
Distribution to Second Hurdle 21.00% 0 0 0 0 0 0 0 0 0 0 0 0
Distribution to Final Hurdle 0 0 0 0 0 0 0 0 0 0 0 0
Partner Distributions
Acumen CF to First Hurdle 51.00% (13,346) (444,824) (2,438) (30,074) 0 0 (46,879) 0 232,077 150,263 112,186 16,341
Golden City CF to First Hurdle 49.00% (12,823) (427,380) (2,342) (28,894) 0 0 (45,040) 0 222,976 144,370 107,787 15,701
Acumen CF to Second Hurdle 60.00% 0 0 0 0 0 0 0 0 0 0 0 0
Golden City CF to Second Hurdle 40.00% 0 0 0 0 0 0 0 0 0 0 0 0
Acumen CF to Final Hurdle 70.00% 0 0 0 0 0 0 0 0 0 0 0 0
Golden City CF to Final Hurdle 30.00% 0 0 0 0 0 0 0 0 0 0 0 0
Overall Net Cash Flows
Acumen (13,346) (444,824) (2,438) (30,074) 0 0 (46,879) 0 232,077 150,263 112,186 16,341
Golden City (12,823) (427,380) (2,342) (28,894) 0 0 (45,040) 0 222,976 144,370 107,787 15,701
Project (26,169) (872,204) (4,780) (58,968) 0 0 (91,919) 0 455,053 294,633 219,973 32,042
Gross Payback N & PROJECT RETURN METRICS IRR NPV Ratio
Acumen -0.35% ($362,483) 0.97
Golden City -0.35% ($348,268) 0.97
Project -0.35% ($628,811) 0.97
Source: Created by case authors from company documents. Some figures have been disguised.
Exercise 1: Monte Carlo Simulation in Excel Applied to the
Dushi Huayuan Case
Learning Objectives:
1. Familiarize yourself with the Dushi Huayuan project case.
2. Familiarize yourself with a typical investment and financial analysis pro forma for a real estate development project.
3. Practice building a Monte Carlo simulation model in Excel using the Data Table utility.
Background on Case:
The case is about a mixed-use-but primarily residential-project in close proximity to a newly developed Central Business District (CBD) of a second-tier city in China. It is an ongoing
development with a total floor area of roughly 212,000 square meters. Dushi Huayuan was designed to house approximately 2,600 people, or 819 households, in modern townhouses and high-rise apartments. Service retail and social amenities were planned in the ground floor podium space of the high-rise buildings.
Fa Ping of Acumen Properties ("General Partner," also referred to as "GP" or "Managing Partner") has teamed up with Golden City Capital ("Limited Partner," also referred to as "LP" or "Money Partner") who will contribute 49% of the total equity.
Acumen bought the land in December of 2009, launched the project in 2010, and broke ground in 2011. They projected the construction and sales period to span nearly an entire decade. When Acumen and Golden City began evaluating the project, they estimated that the total cost (including land cost) would total Y2.34 billion CNY (about $360 million USD in 2015) with a maximum equity
Role of Case in Course:
In the past several decades, the real estate market in China exhibited significant sustained growth. Residential developers in China typically made decisions based on their experience and intuition rather than using careful and detailed quantitative analysis. But beginning in 2011, the housing market in China cooled, dropping real estate development margins. And as China's economic growth matured, construction costs slowly escalated. In this riskier economic environment,
executing investment decisions without careful quantitative analyses could put developers in a more vulnerable position when the housing market fluctuates. The Dushi Huayuan case and its
corresponding exercises provide a framework to conduct a detailed quantitative analysis of a typical Chinese large-scale, master-planned project. We will use this project as a platform for developing a better understanding of the tools presented in this course. It's our belief that these tools will help push the frontier of analyzing real estate development opportunities. Evaluating projects like Dushi Huayuan through the lens of a rigorous quantitative analysis will not only change our perspective on real estate development in China, but also provide guidance on obtaining greater expected returns
over the lifetime of the project. There are two major elements of the sophisticated quantitative analysis. First, beyond simply evaluating a base case pro forma projection about the future, we explicitly recognize that the future is uncertain, and we model the effect such uncertainty can have on the project's ex post performance. Second (in later assignments), we recognize that large-scale multi-building projects usually have flexibility, at least potentially, in exactly when, or even how much, buildout will ultimately be realized.
The process begins in the present assignment with modeling a 10-year financial pro forma. From there, a simulation process (referred to as the "ex ante inflexible model") is built to take into account crucial exogenous dynamic economic variables-uncertainties in the real world-that largely affect project outcomes. Then we will analyze the simulated investment performance of the project focusing on the range of possible net present values (NPV) achieved ex post, initially using the ex ante inflexible model. The analysis is referred to as "ex ante" because it is undertaken before the project actually is built. The ex ante inflexible model is limited in nature by its inability to evaluate
the impact of flexibility (call options) on real estate projects because it assumes the original pro forma plan will be carried out exactly as planned ex ante, no matter what happens in the real estate market ex post. The analysis without flexibility may in some instances be realistic, if institutional
constraints prevent the developer from altering the original plan or program. But more generally, the
Page 2
inflexible analysis provides a benchmark against which we can compare and evaluate possible types of flexibility that the project may have, such as phasing and the ability to delay or abandon later phases. (As noted, such flexibility will not be modeled in this first assignment.) When we introduce
flexibility into the ex ante model, we'll be able to play around with different market factors to see what affect flexibility has on expected net present value (ENPV). Finally, in Exercise 3, a "waterfall
analysis" will be modeled for the two Joint Venture (JV) partners-Acumen and Golden City-to illustrate the financial structure of the deal and help us determine if each partner's incentives are
correctly aligned to ensure the project's success.
The Assignment:
1. Create DCF Model. The purpose of the first exercise is to introduce the Dushi Huayuan
case by getting you familiar with modeling uncertainty about the future in the Excel model of the project's DCF (Discounted Cash Flow) and NPV (Net Present Value). Your first analytic task is to create the ex ante DCF projection model of Dushi Huayuan from the case pro forma, which reflects Acumen's initial assumptions and the project's projected value.
2. Monte Carlo Simulation. The second analytic task is to create a simulation model (also known as Monte Carlo). Monte Carlo simulation runs numerous future scenarios about the real estate market and applies them to a DCF analysis assuming the base case pro forma execution of the project program. It thereby calculates a range of ex ante return metrics (e.g. NPVs, IRRs, etc.); the characteristics of the range's distribution is important in drawing conclusions about how specific market conditions, and the uncertainty surrounding the future, affect the projected returns in the DCF model. The uncertainty of future scenarios are simulated in the Monte Carlo analysis with randomly generated numbers. In this model, you will run 2,000 random "trials" or "futures" (each may be thought of as a "scenario") and tabulate the ex ante distribution of the simulated ex post return metrics across all of these trials. We can then examine various aspects of this ex ante distribution of possible outcomes: its mean, its median, various percentiles, standard deviation, indeed, the entire "shape" of the
outcome possibility distribution. As noted, here in Exercise
1
you will ignore any flexibility(buildout delay option and expansion options) and assume Acumen will completely execute the project as it was projected in the base case pro forma, regardless of what you simulate