HAL Id: hal-00318394
https://hal.archives-ouvertes.fr/hal-00318394
Submitted on 6 Nov 2007
HAL is a multi-disciplinary open access
archive for the deposit and dissemination of
sci-entific research documents, whether they are
pub-lished or not. The documents may come from
teaching and research institutions in France or
abroad, or from public or private research centers.
L’archive ouverte pluridisciplinaire HAL, est
destinée au dépôt et à la diffusion de documents
scientifiques de niveau recherche, publiés ou non,
émanant des établissements d’enseignement et de
recherche français ou étrangers, des laboratoires
publics ou privés.
Characterisation of the mixing height temporal
evolution by means of a laser dial system in an urban
area ? intercomparison results with a model application
M. A. Garcia, M. L. Sánchez, B. de Torre, I. A. Pérez
To cite this version:
M. A. Garcia, M. L. Sánchez, B. de Torre, I. A. Pérez. Characterisation of the mixing height temporal
evolution by means of a laser dial system in an urban area ? intercomparison results with a model
application. Annales Geophysicae, European Geosciences Union, 2007, 25 (10), pp.2119-2124.
�hal-00318394�
www.ann-geophys.net/25/2119/2007/ © European Geosciences Union 2007
Annales
Geophysicae
Characterisation of the mixing height temporal evolution by means
of a laser dial system in an urban area – intercomparison results
with a model application
M. A. Garc´ıa, M. L. S´anchez, B. de Torre, and I. A. P´erez
Department of Applied Physics, Faculty of Sciences, University of Valladolid, Spain
Received: 9 May 2006 – Revised: 29 May 2007 – Accepted: 15 October 2007 – Published: 6 November 2007
Abstract. Measurements of vertical and temporal variations
in ozone and aerosol as extinction over an urban area in Segovia, central Spain, were performed during two summer months in 2004 by means of a commercial Nd:YAG laser DIAL remote sensing system. The Differential Absorption Lidar (DIAL) technique was applied and its description is given. From the profile data, a practical determination of mixing height may be derived. A diurnal evolution for the whole dataset is observed, the highest mean mixing height being reached at 16:00 GMT, 2150 m. The presence of a double-layer structure at night was observed and the layers can be considered residual. On average, the lower layer is formed at 670 m and the upper layer yielded mean heights ranging between 1270 and 1390 m. The estimated mixing heights during the day are also compared with those obtained from the Lagrangian HYSPLIT model. The results show good statistical agreement between both approaches, mainly in the early afternoon, with correlation coefficients around 0.7.
Keywords. Atmospheric composition and structure
(Evolu-tion of the atmosphere; Instruments and techniques) – Radio science (Remote sensing)
1 Introduction
The height of the atmospheric boundary layer or mixing height is a fundamental parameter characterising the struc-ture of the lower atmosphere. Mixing height determines the volume available for the dispersion of pollutants by con-vection or mechanical turbulence and understanding it is of particular importance for various applications such as en-vironmental monitoring and the prediction of air pollution, weather forecasting or as a scaling parameter for the descrip-tion of vertical profiles (Beyrich, 1997). Thus, an accurate
Correspondence to: M. L. S´anchez
(marisa@fa1.uva.es)
representation of the mixing depth plays an essential role in the ability of models to calculate pollutant concentrations (Ulke and Mazzeo, 1998). Since the mixing height is not measured by standard meteorological practices, much effort is being invested in improving its estimation. Although there are several definitions and methods for determining the mix-ing height (Stull, 1988; Seibert et al., 1998, 2000; Karppinen et al., 2001; Sicard et al., 2006), it often proves a somewhat unspecific parameter whose definition and estimation is not precise.
Two general approaches are used to determine mixing heights; on the one hand the analysis of profile measurements from remote sensing and on the other the application of pa-rameterisations or models based on operationally available data. The former has the advantage of providing high tempo-ral and spatial resolution information for the mixing height (He et al., 2006). Although widely used, the second method may entail uncertainties in the specification of the mixing height evolution as discussed by certain authors (Berman et al., 1997; Scaudt and Dickinson, 2000; Nitis et al., 2004).
In recent decades experimental studies of the atmospheric boundary layer have been performed for several types of ur-ban areas. Many of these studies have been summarised by Baklanov (2002), and have enabled analysis of the effects of urban peculiarities and verification of different methods of mixing height estimation versus measurement data sets.
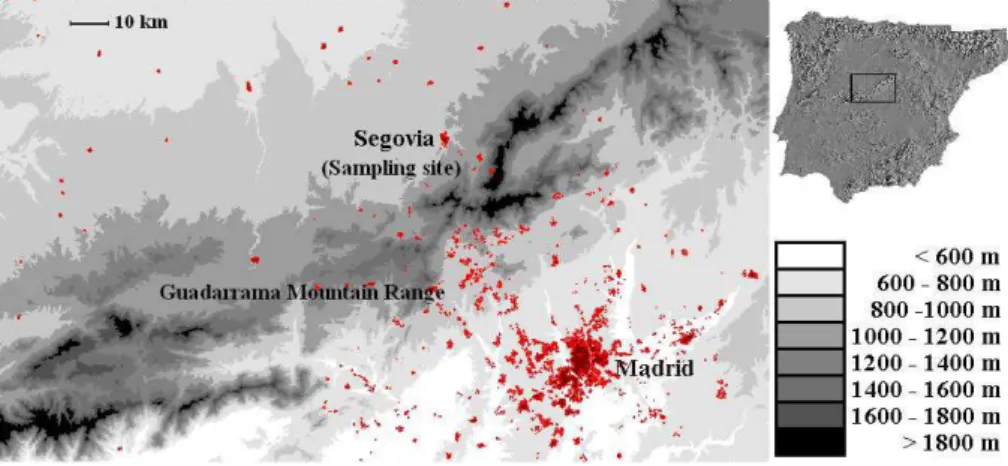
To enhance knowledge of this critical parameter for air pollution applications, we performed an intensive campaign in an urban area, Segovia (Spain). The location chosen is a small city in the upper plateau located close on the foothills of the Guadarrama Mountain Range in the Central Massif. The area is featured by complex topography, with mountains up 2540 m, contributing significantly to the development of convective cells that can inject pollutants from the boundary layer to the free troposphere and mid-troposphere where they can participate in long-range transport processes as has been documented by Mill´an et al. (1996).
2120 M. A. Garc´ıa et al.: Characterisation of the mixing height temporal evolution
Fig. 1. Topographic map of the sampling site close to the Guadarrama Mountain Range. The domain corresponds to the rectangular area
drawn on the Iberian Peninsula.
Continuous measurements of ozone and aerosols (as ex-tinction) were conducted over almost 37 complete days in June and July 2004. The description of the ozone vertical ex-change processes in the low troposphere by means of the long temporal series obtained is reported in S´anchez et al. (2007a). This paper focuses on the vertical distribution of aerosols and specifically deals with the following objectives: 1) To present the experimental results obtained and discuss the daily course of the mixing height evolution at the measuring site and b) To analyse the reliability of the day-to-day experimental results with those computed by means of the HYSPLIT model.
2 Sampling site
Continuous measurements of aerosol vertical profiles were performed in the summer of 2004 in an urban area located in Segovia (Spain), a small city close to the Guadarrama Moun-tain Range (lat. 4◦4′32′′N, long. 40◦56′49′′W, alt: 1100 m
above m.s.l.), some 65 km from Madrid. The site is shown in a topographic map in Fig. 1.
Concurrent meteorological variables were available from the routine measurements carried out by the Territorial Me-teorological Centre of Castile and Leon in Segovia. Dur-ing the measurement period, the site was characterized by slow winds, with a mean value of 2.8 m s−1 and extreme
values ranging from 0.1 to 11.0 m s−1. The daily cycle of
this meteorological variable was consistent with the effects thermally-induced by the mountains, characterised by high values during the period of convective activity whereas light winds were dominant overnight. Hourly temperature values range from 6.8 to 35.7◦C, the mean value registered being
21.7◦C. During the day, the most frequent wind directions are
W and NW accounting for a frequency of 33.6 and 18.3%, respectively. However, E and SE are the main directions at night, 38.9 and 17.0%, respectively. The prevailing wind di-rections might be attributed to the topographical channelling
effects produced by the Guadarrama Mountains on the gen-eral regional winds.
3 Description of the laser remote sensing system
The laser remote sensing device is a commercial com-pact Lidar system, manufactured by Elight Laser System GmbH, (size: 1.2 m×0.85 m×1.45 m) weighing approxi-mately 450 kg. It has low maintenance and operational costs. The system allows monitoring of vertical aerosol distribution (as extinction) from about 400 to 3800 m, depending on the meteorological conditions and the alignment of the equip-ment.
The profiles were obtained using a Differential Absorption Lidar (DIAL) system based on specific light absorption by molecules, which depends on the wavelength of the incident light. The system uses a Nd:YAG laser that emits pulses at 1064 nm with a repetition rate of 20 Hz. Laser light is con-verted to 532 nm in the second harmonic generator module and the rest of the 1064 nm pulse is sent into a beam trap. The fourth harmonic generator module converts 532 nm to 266 nm. The rest of 532 nm is sent into a trap, where its energy is measured. 266 nm laser pulses are directed and focused inside the Raman cell, which is 1 m long and filled with Nitrogen at 38 hPa. Inside the Raman cell the 266 nm laser light is partly converted into its first and second Stokes wavelengths. As a result three wavelengths pass the shutter. Backscattered light is collected in a double-coaxial 30 cm diameter telescope and redirected by the Newtonian mirror in the spectrometer, where the signals are transmitted to the photomultipliers. The equipment uses three pairs of wave-lengths: 266–284, 284–304 and 266–304 nm. In each pair, one of the wavelengths refers to high selective absorption and the other to no absorption. The difference of the acquired signals allows us to calculate vertical ozone and aerosol dis-tribution as a function of the distance along the beam (Elight
Extinction coefficient (km-1) 0.0 0.4 0.8 H e ig h t (m) 0 500 1000 1500 2000 2500 3000 3500 4000 0.4 0.8 0.4 0.8 0.4 0.8 0.4 0.8 0.4 0.8 0.4 0.8 0.4 0.8 0.4 0.8 0.4 0.8 3 5 7 9 11 13 17 21 23 1 0.4 0.8 15 0.4 0.8 19
Fig. 2. Vertical profiles of the extinction coefficients corresponding to 16 June 2004 for specific hours of the day.
Laser Systems, 2003). The 284–304 pair was selected for data processing due to its long-range and lower atmospheric absorption. The default temporal resolution of the evalua-tion software is 10-min. From these data, hourly means were computed. The vertical resolution can be selected by the user and in this paper the default value, 50 m, was selected. The system has been used in an unattended and fully remote con-trolled operation. This option has allowed us to transfer the data in almost real time as well as to perform routine opera-tions for optical system alignment.
4 Results
4.1 Estimating mixing height from extinction coefficient profiles
During the campaign, extinction coefficients vertical profiles were continuously measured over 16 days in June and 21 in July, covering contrasting scenarios characterised by low and high convective activity. The profile measurements of the ex-tinction coefficients were used for operational estimation of mixing height. Several approaches have been used to esti-mate this parameter from the Lidar. Sicard et al. (2006) sum-marise some of these and evaluate three derivative methods. In this paper, a visual inspection method based on a qualita-tive analysis of the extinction coefficient is considered in a similar way to that provided by Mok and Rudowicz (2004). The profiler mixing depths are determined to be at the tran-sition point where the aerosol amount or the extinction coef-ficient values under free conditions are lower. Mixing height is assumed to be located at the same height as the maximum extinction coefficient values recorded. Although this method presents a certain weakness, it may be considered an easy to use and straightforward procedure for an approximate initial analysis of data.
Figure 2 shows the development of the mixing layer along a typical day using the extinction coefficient profiles. In this example, mixing height values are lower than those of days with strong convective activity when they may even reach up to 3500 m caused by the slopes heating at the early stage
of convective activity development (S´anchez et al., 2007a, b). The most prominent feature at night is the presence of a double-layer structure clearly visible in the profiles, formed due to katabatic winds during the radiative cooling period as reported in S´anchez et al. (2005). For the time of measure-ments, mean heights of the lower layer above the ground for each hour vary between 620 to 710 m. We cannot be sure that this is the lowest layer generally formed at a few meters when the earth cools due to equipment restrictions in vertical measurements below the first 400 m since data are not reg-istered. The second layer is characterised by mean heights ranging from 1270 to 1390 m. One possible explanation for this elevated layer is that it might be a residual layer from the day before since it remains during the night when the lower layer also begins to be observed. Moreover, it is inter-esting to note that after the peak at 16:00 GMT, the elevated layer decreases in height with time while the lowest layer becomes more pronounced. It could be assumed that with the cooling and decrease in mixing, aerosols are no longer being injected to those heights and the apparent decrease in height of the mixed layer is consistent with the development of down-slope mountain breezes.
During the daylight period under unstable atmospheric conditions, the mixing layer height exhibits a well-defined evolution over the sampling location. Figure 3 depicts the variation of the mean mixing heights obtained for June and July 2004 from 09:00 GMT when the mixing layer com-mences its development to 20:00 GMT, when it collapses. Due to the radiative heating of the ground the morning as-cent of the mixing layer culminates at 16:00 GMT with a mean depth of 2150 m. These results agree with other values reported in the literature for continental regions (B¨osenberg and Mattias, 2003), but are higher than those obtained for other locations, such as coastal areas (P´erez et al., 2004). Then, a slow decrease is observed towards sunset. The stan-dard deviations of the mixing depths are between 200 and 370 m with the lowest values in the morning and the highest in the late afternoon. However, from 18:00 to 20:00 GMT the data present a slightly greater variability of around 400 m. The linear increase of mixing height observed during the morning hours is quite pronounced with the average mixing
2122 M. A. Garc´ıa et al.: Characterisation of the mixing height temporal evolution
Fig. 3. Hourly evolution of the mean mixing heights at the sampling
site in June and July 2004 for specific hours of the day. The bars show the uncertainty intervals of least significant differences at 95% confidence level.
height values. Mixing height peaks at approximately the same time as temperature. The high values obtained are in-fluenced by the strong convection generated in the mountains nearby, mainly with high temperatures. These values fre-quently occurred when the return signal from aerosols sus-pended aloft during the previous day’s mixing exceeded that from new aerosols being mixed into the developing convec-tive boundary layer as has been commented above (Marsik et al., 1995).
4.2 Determination of the mixing heights from a model – comparison
Among the approaches for the practical estimation of the mixing height, we have used the Lagrangian HYSPLIT 4 model (Draxler and Rolph, 2003) for the same period of time. This model is widely applied in many studies and assumes that there is a well-mixed layer in which pollutant transport and dispersion take place. The model interpolates the mixing depths at the required times from the synoptic times avail-able in the meteorological data with 6 h resolution. It might be worth noting that the interpolated model values between 12:00 and 18:00 GMT are both in the daytime, while interpo-lations between 06:00–12:00 and 18:00–00:00 GMT might have the influence of the day/night transition. The vertical extent of the mixing layer is calculated within the model from potential temperature data by finding the height of an elevated inversion at each grid point. The model assumes the boundary layer depth to be equal to the height at which the potential temperature first exceeds the value at the ground by 2 K. The temperature profile is analyzed from the top down to determine the boundary layer depth. The top-down ap-proach reduces the influence of shallow stable layers near the ground. In addition, a minimum depth of 250 m is as-sumed for all hours. The height was chosen to correspond to the minimum height resolution, typical of the meteorological input data (Draxler and Hess, 2004).
0.3 0.4 0.5 0.6 0.7 0.8 8 9 10 11 12 13 14 15 16 17 18 19 20 21 Hour C o r r e la ti o n c o e ffi c ie n t
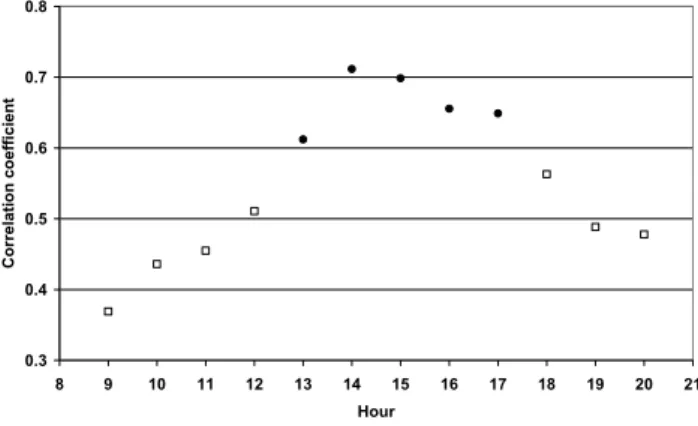
Fig. 4. Correlation coefficients for the linear regression between
mixing heights from the profiler measurements and those from the model at specific hours of the day. Black circles correspond to a p-value below 0.01 indicating the statistically significant relationship at a 99% confidence level. White squares correspond to a p-value greater or equal to 0.01 at a 90% or higher confidence level.
The estimated mixing heights obtained directly from the model were compared to those from the profile measure-ments presented in the previous section. The mean of the percentage differences between the experimental and mod-elled mixing height values with regard to experimental data were lower than 30%. The intercomparison based on a lin-ear regression was performed for each hour of the day. The results obtained at night for low heights do not allow any definite conclusions to be drawn due to the previously men-tioned threshold considered by the model and the limitations of the profiler. Heights might be less reliable and representa-tive to establish a relationship between both approaches. The correlation coefficients vary along the day. The correlation values obtained for certain hours of the day are represented in Fig. 4 and a few important observations can be made. They range between 0.369 and 0.511 in the morning showing a relatively weak relationship between both variables. Similar results are obtained at the end of the day as can be seen. In early afternoon, from 13:00 to 17:00 GMT, the coefficients range between 0.612 and 0.712. The p-value of below 0.01 indicates the statistically significant correlation at a 99% con-fidence level. Consequently, the better agreement found af-ter noon suggests that the model might prove satisfactory to estimate the mixing height when it is developed. How-ever, experimental measurements in the sampling site are re-quired outside this period. The overall results of this study are in accordance with the conclusions presented by Marsik et al. (1995) regarding mixing height estimates using vari-ous systems: rawindsonde system, radar wind profiler-RASS system and also the Lidar system.
5 Conclusions
This paper has described the ability of a commercial laser re-mote sensing system designed to run autonomously to deter-mine the evolution of the mixing layer over an urban area lo-cated in the foothills of the Guadarrama Mountain range over 37 days in summer 2004. The device provides continuous data of vertical aerosol distribution as extinction based on the DIAL technique. When examining the results of the extinc-tion coefficients, an extremely well- defined layer with the highest coefficients is observed and the height correspond-ing to the transition to lower values is assigned to the mix-ing layer height. A daily evolution is distmix-inguished and the maximum mean values are obtained in the afternoon when the mixing layer expands, reaching a mean depth of 2150 m. Two residual layers are identified at night. The mean mixing heights of the lower one is not below 600 m justified by the limitation of the equipment in the lower range of 400 m. The higher layer is clearly observed at around an average 1330 m as a residual layer remaining from the day before.
The reliability of the experimental results was tested using the mixing heights computed by the HYSPLIT model, which calculates the vertical extent of the mixing layer from po-tential temperature. The mean of the percentage differences between the experimental and modelled mixing height val-ues with regard to experimental data were lower than 30%. Intercomparison based on a linear regression was performed for each hour of the day. This approach provides the best fits in the early afternoon with correlation coefficients up to 0.712 (p<0.01) mainly when the mixing height is fully de-veloped. Profiler restrictions and the minimum depth (250 m) assumed by the model make an accurate estimation of the mixing height more difficult during night time. Finally, the resolution of the meteorological data file might also have some influence to interpolate the mixing depths in the morn-ing and in the afternoon due to the day/night transition.
Acknowledgements. This research was funded by the
Interminis-terial Commission of Science and Technology, CICYT, and the Government of Castile and Leon. Special thanks are due to the NOAA Air Resources Laboratory (ARL) for the provision of the HYSPLIT transport and dispersion model and the READY website (http://www.arl.noaa.gov/ready.html) used in this publication.
Topical Editor F. D’Andrea thanks two anonymous referees for their help in evaluating this paper.
References
Baklanov, A.: The mixing height in urban areas – a review, in: Pro-ceedings of the Workshop “Mixing height and inversions in ur-ban areas”, edited by: Piringer, M. and Kukkonen, J., COST re-port EUR 20451, p. 9–28, 2002.
Berman, S., Yeong, J. K., Zhang, J., and Rao, T.: Uncertainties in estimating the mixing depth–comparing three mixing-depth models with profiler measurements, Atmos. Environ., 31, 3023– 3039, 1997.
Beyrich, F.: Mixing height estimations from sodar data- A critical discussion, Atmos. Environ., 31, 3941–3953, 1997.
B¨osenberg, J. and Matthias, V.: EARLINET: A European Aerosol Research Lidar Network. Report 348, MPI-Report 337, Max-Planck-Institut f¨ur Meteorologie, Hamburg, 191 pp, 2003. Draxler, R. R. and Rolph, G. D.: Real-time Environmental
Appli-cations and Display System (READY), Website http://www.arl. noaa.gov/ready/hysplit4.html, NOAA Air Resources Laboratory, Silver Spring, MD, 2003.
Draxler, R. R. and Hess, G. D.: Description of the Hysplit 4 mod-eling system, NOAA Tech Memo ERL ARL-224, 2004. Elight Laser Systems: Ozone profiler O3P-RCV 280803 E,
Hand-book, 53 pp., 2003.
He, Q. S., Mao, J. T., Chen, J. Y., and Hu, Y. Y.: Observational and modelling studies of urban atmospheric boundary-layer height and its evolution mechanisms, Atmos. Environ., 40, 1064–1077, 2006.
Karppinen, A., Joffre, S. M., Kukkonen, J., and Bremer, P.: Evalu-ation of inversion strengths and mixing heights during extremely stable atmospheric stratification, Int. J. Environ. Pollut., 16, 603– 613, 2001.
Marsik, F. J., Fischer, K. W., McDonald, T. D., and Samson, P. J.: Comparison of methods for estimating mixing height used during the 1992 Atlanta field intensive, J. Appl. Meteor., 34, 1802–1814, 1995.
Mill´an, M., Salvador, R., and Mantilla, E.: Methodology and photo-chemical air pollution in Southern Europe: experimental results from EC research projects, Atmos. Environ., 30, 1909–1924, 1996.
Mok, T. M. and Rudowicz, C. Z.: A lidar study of the atmospheric entrainment zone and mixed layer over Hong Kong, Atmos. Res., 69, 147–163, 2004.
Nitis, T., Klaic, Z. B., Kitsiou, D., and Moussiopoulos, N.: Bound-ary layer height determination under summertime anticyclonic weather conditions over the coastal area of Rijeka, Croatia, 9th Int. Conf. on Harmonisation within Atmospheric Dispersion Modelling for Regulatory Purposes, Garmisch-Partenkirchen, Germany, 2004.
P´erez, C., Sicard, M., Jorba, O., Comer´on, A., and Baldasano, J. M.: Summertime re-circulations o fair pollutants over the north-eastern Iberian coast observed from systematic EARLINET lidar measurements in Barcelona, Atmos. Environ., 38, 3983–4000, 2004.
S´anchez, M. L., de Torre, B., Garc´ıa, M. A., and P´erez, I. A.: Ozone concentrations at a high altitude station in the central mas-sif (Spain), Chemosphere, 60, 576–584, 2005.
S´anchez, M. L., de Torre, B., Garc´ıa, M. A., and P´erez, I.: Ground-Level ozone and ozone vertical profile measurements close to the foothills of the Guadarrama mountain range (Spain), Atmos. Environ., 41, 1302–1314, 2007a.
S´anchez, M. L., Garc´ıa, M. A., P´erez, I. A., and de Torre, B.: Ground laser remote sensing measurements of a Saharan dust outbreak in central Spain. Influence on PM10 concentrations in the lower and upper Spanish plateaus, Chemosphere, 67, 229– 239, 2007b.
Scaudt, K. J. and Dickinson, R. E.: An approach to deriving rough-ness length and zero– plane displacement height from satellite data, prototyped with BOREAS data, Agr. Forest Meteorol., 104, 143–155, 2000.
2124 M. A. Garc´ıa et al.: Characterisation of the mixing height temporal evolution
Seibert, P., Beyrich, F., Gryning, S. E., Joffre, S., Rasmussen, A., and Tercier, P.: Mixing layer depth determination for dispersion modelling, European Commission, in: 1998: COST Action 710-Final Report, edited by: Fisher, B. E. A., Erbrink, J. J., Finardi, S., Jeannet, P., Joffre, S., Morselli, M. G., Pechinger, U., Seibert, P., and Thomson, D. J., 1998.
Seibert, P., Beyrich, F., Gryning, S. E., Joffre, S., Rasmussen, A., and Tercier, P.: Review and intercomparison of operational meth-ods for the determination of the mixing height. Review Article, Atmos. Environ., 34, 1001–1027, 2000.
Sicard, M., P´erez, C., Rocadenbosch, F., Baldasano, J. M., and Garc´ıa-Vizcaino, D.: Mixed-Layer depth determination in the Barcelona coastal area from regular lidar measurements: meth-ods, results and limitations, Bound.-Lay. Meteorol., 119, 135– 157, 2006.
Stull, R. B.: An introduction to boundary layer meteorology. Kluwer Academic Publishers, Dordrecht, 665 pp, 1988. Ulke, A. G. and Mazzeo, N. A.: Climatological aspects of the
day-time mixing height in Buenos Aires city, Argentina, Atmos. En-viron., 32, 1615–1622, 1998.