Development of Photo-patterned
Composite Structures in Microchannels
for Oil Reservoir Research
by
Hyundo Lee
B.S., Mechanical and Aerospace Engineering,
Seoul National University, 2009
MASSACHUSETTS INSTITUTE
OF TECHNQLOGY
AUG 15 2014
LIBRARIES
Submitted to the Department of Mechanical Engineering
in partial fulfillment of the requirements for the degree of
Master of Science in Mechanical Engineering
at the
Massachusetts Institute of Technology
June 2014
@
Massachusetts Institute of Technology 2014. All rights reserved.
Signature redacted
Author ...
*...
Department of Mechanicki Engineering
Certified by...
- May 9, 2014
Signature redacted
Patrick S. I5oyle
Singapore Research Professor of Chemical Engineering
Thesis Supervisor
Certified by...Signature
redacted
'Rohit Karnik
Associate Profess
f Mechanical Engineering
707
A
*
esi&4ftder
Accepted by ...
Signature redacted.
David E. Hardt
Chairman, Department Committee on Graduate Theses
Development of Photo-patterned
Composite Structures in Microchannels
for Oil Reservoir Research
by
Hyundo Lee
Submitted to the Department of Mechanical Engineering on May 9, 2014, in partial fulfillment of the
requirements for the degree of
Master of Science in Mechanical Engineering
Abstract
Starting from unstructured glass microchannels, we develop a new method of micro-model fabrication. We build composite structures in a bottom-up manner with ultra-violet projection lithography where the composite structures are composed of tricy-clodecane dimethanol diacrylate and stearic-acid treated calcium carbonate particles. This lithographic method is simple, fast, economical, and versatile compared with pre-vious fabrication methods used for two-phase porous media micromodel experiments. With the micromodels developed in this way, we conduct oil-water two-phase flow experiments around a single cylindrical post with controlled oleophilic/hydrophilic wetting behavior.
Thesis Supervisor: Patrick S. Doyle Title: Professor of Chemical Engineering
Acknowledgments
First of all, I would like to express my deepest appreciation to my advisor, Prof. Patrick Doyle, for his valuable advice and kind patience during my Master's pro-gram. I am truly appreciate his insightful advice in research as well as for the great encouragement.
I am also grateful to my thesis reviewer, Prof. Rohit Karnik, for his sincere guid-ance, advice, and support.
I would like to thank all the Doyle group members, Korean friends for helpful discussion, enjoyable life, and friendship at MIT. I want to thank Jeongsong Cultural Foundation of Korea for their generous support during my Master's program. I am also grateful to Dr. Seung Goo Lee, for his expertise in surface engineering and chem-istry helped me significantly to improve my work. I would like to thank Dr. William Durham for his generous help to improve my English.
Finally, I am truly grateful to my family, my father, Hong Jun Lee, mother, Sook Young Kang, sister, Kyung Mi Lee, brother-in-law, Hee Han, and my beloved nephew, Si Heon Han, for their constant love and encouragement, which made all the challenges of the completing my graduate study.
Contents
1 Introduction 13
1.1 Micromodels for Oil Reservoir Research . . . . 13
1.2 Limitation of Previous Micromodel Fabrication . . . . 14
1.3 Thesis Overview . . . . 15
2 Ultraviolet Projection Lithography 17 2.1 Free Radical Photopolymerization . . . . 17
2.2 Stop-Flow-Lithography Technique . . . . 19
2.3 Fixed Structures with Surface Activation . . . . 20
3 Composite Structure of Tricyclodecane Dimethanol Diacrylate and Calcium Carbonate with Oil-wet Behavior 23 3.1 W ettability . . . . 23
3.2 Oil-wet Carbonate Reservoirs ... 27
3.3 Polymer-Calcium Carbonate Particle Composite ... 29
3.3.1 Matrix - Tricyclodecane Dimethanol Diacrylate ... 29
3.3.2 Filler - Stearic-acid Treated Calcium Carbonate . . . . 30
4 Preliminary Flow Experiment: Oil-Water Flow around a Single Composite Post 35 4.1 Microfluidic Chip Preparation Procedure ... 35
4.2 Composite Post Polymerization and Flow Experiment Procedure . . . 38
4.2.2 Water/Oil Repulsion by Hydrophobic/Oleophobic Posts . . . . 42
5 Summary and Future Plans 43
List of Figures
1-1 Comparison between microfabrication methods. Figure reproduced from ref. [1]. . . . . 14 1-2 Schematic of polymeric structure fabrication by UV lithography. . . . 15 2-1 Mechanism of free radical polymerization. Figure reproduced from
Paint & Coating Industry magazine, www.pcimag.com. . . . . 17 2-2 Schematic set-up of ultraviolet projection lithography. This example
shows the synthesis of bar-coded, probe-containing particles. Figure reproduced from ref. [6]. . . . . 19 2-3 Polymerization reaction inhibition due to the oxygen permeability of
PDMS in Stop Flow Lithography. Figure reproduced from ref. [7]. . . 20 2-4 Surface activation with 3-(trimethoxysilyl)propyl acrylate. . . . . 20 2-5 Comparison between the polymerization process in an oxygen
perme-able PDMS channel and in a surface activated glass channel. . . . . . 21
3-1 Young's equation for wettability, water-wet and oil-wet surfaces. . . . 24
3-2 The relationship between water contact angle in air, oil contact angle in air, and oil contact angle in water describing hydro-philicity/phobicity and oleo-philicity/phobicity. Figure reproduced from ref. [9]. . . . . . 25 3-3 Carbonate oil reservoir distribution in the world.
Figure reproduced from Schlumberger, www.slb.com. . . . . 27 3-4 Wettability distribution among carbonate oil reservoirs. . . . . 28 3-5 Goal and approaches to make photo-patternable micromodels with oil
3-6 Schematic approach of polymer-CaCO3 particle composite. . . . . 29
3-7 Chemical structure of tricyclodecane dimethanol diacrylate. . . . . . 29 3-8 Contact angle measurement of tricyclodecane dimethanol diacrylate. . 30 3-9 SEM image of calcium carbonate particles. This image is reproduced
from Mississippi Lime. . . . . 31 3-10 The chemical structure of stearic acid and calcium carbonate powder. 31 3-11 Micelle adsorption model for stearic acid on the calcium carbonate
surface in aqueous medium. Figure reproduced from [13]. . . . . 32 3-12 Water droplet tests on stearic-acid treated and pure-calcium carbonate
particles in air. . . . . 32 3-13 Water contact angles on pure TCDDA and TCDDA + stearic-acid
treated calcium carbonate composite surfaces. . . . . 33 4-1 The fabrication process of PDMS-glass microfluidic chip . . . . 35 4-2 Delamination issue with PDMS-glass microchannels . . . . 36 4-3 Glass(top)-glass(bottom) microfluidic chip used in the experiment
(chan-nel widths: 5 x 0.5 mm, 6 x 1.0 mm, 5 x 1.5 mm, chan(chan-nel depths: 0.05 mm, channel lengths: 18 mm). . . . . 37 4-4 Micromodel experiment steps: 1. Polymerization by UV lithography,
2. Washing uncured precursor, 3. Filling decane, and 4. Flowing water. 38 4-5 Displacement of decane with the 0.2 psi flow of water around a
stearic-acid treated calcium carbonate + tricyclodecane dimethanol diacrylate post. . . . . 39 4-6 Displacement of decane with the 0.2 psi flow of water around a pure
calcium carbonate + tricyclodecane dimethanol diacrylate post. . . . 39
4-7 Possible four combinations explain drainage and imbibition processes. 40 4-8 Oil capturing by oleophilic post when the decane is displaced by the
water flow. . . . . 41 4-9 Water capturing by hydrophilic post when the water is displaced by
4-10 Water repulsion by oleophilic post when the water is displaced by the decane flow. . . . . 42 4-11 Oil repulsion by hydrophilic post when the decane is displaced by the
water flow . . . . 42 5-1 Scheme of calcium carbonate in-situ growth. . . . . 44 5-2 Oil/water drainage/imbibition control depends on oleophilicity/hydrophilicity
of the structures. . . . . 45 A-1 Comparison between a computational and an experimental results: Oil
Chapter 1
Introduction
1.1
Micromodels for Oil Reservoir Research
It is common practice to use core samples from oil reservoir sites to understand oil-gas-water multiphase flow occurring in an underground oil reservoirs. However, the disadvantages of core-flooding experiments (e.g. opacity, site specificity, ambiguities of experimental parameters) have made it difficult to conduct fundamental experi-mental investigations of oil reservoirs.
Due to the above limitations of coflooding experiments, researchers have re-cently developed synthetic micromodels. Micromodels are generally two dimensional, transparent, and simplified porous microchannels built to visualize and study fluid behavior in porous media. In oil reservoir research, micromodels reflect underground oil reservoir conditions, for example, porosity, permeability, wettability. These reser-voir properties are designed and built into micromodels for further understanding of fundamental fluid behavior and interactions among oil-water-rock phases. These micromodel studies in a laboratory environment are required for various real field applications, such as operational practices for oil production, secondary recovery, and reservoir network mapping.
1.2
Limitation of Previous Micromodel Fabrication
As the MEMS (micro-electromechanical systems) technology has developed along with the rapid growth of information technology and semi-conductor industry, more precise and accurate microfabrication techniques have been developed. This micro-fabrication technology is also adopted in microfluidic research; microfluidic research handles very small amount of reagents to study behavior of fluids in micro-scale. Re-searchers who are interested in two-phase flow in porous media also have used micro-and macro-scales micromodels in their experiments to investigate fluid behavior for biological, mechanical, and chemical research applications.
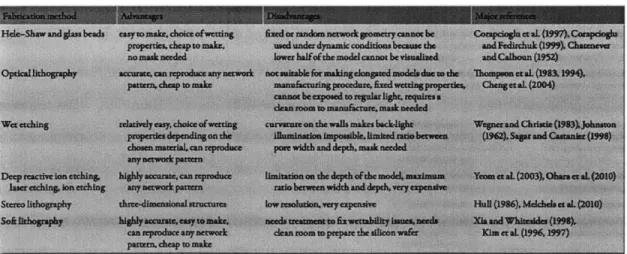
There are many microfabrication methods commonly used in oil research; for ex-ample, wet etching, plasma etching, and soft lithography [1]. However, most of these fabrication techniques require a great deal of time and effort: cleanroom fabrication, the use of dangerous chemicals, and high unit cost for a single micromodel. Further-more, these fabrication methods have a disadvantage as regards flexibility; once the design of features or patterns are fabricated, it is nearly impossible to make geometric modifications [2-51.
Figure 1-1: Comparison between microfabrication methods. Figure reproduced from ref. [1].
1.3
Thesis Overview
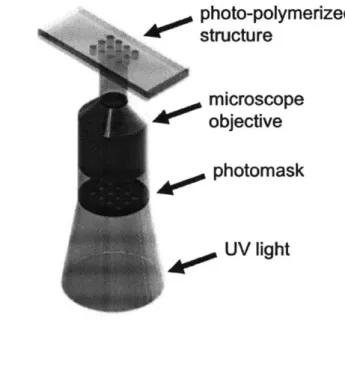
This thesis introduces a new, versatile, and bottom-up microfabrication technique using ultraviolet projection lithography based on the Stop-Flow-Lithography tech-nique developed in the Doyle group, MIT [6]. Top and bottom glass surfaces of microchannels are acrylated, and the polymerized composite structures adhere to the activated top and bottom surfaces. This method has several advantages over previous micromodel fabrication methods. A two-dimensional basic structure unit can be built within milliseconds, so the whole fabrication process of a micromodel with a multi-tude of geometric structures takes less than an hour. Chapter 3 describes how we can tune the wetting properties of structures with a polymer-calcium carbonate composite approach, either oleophilic or hydrophilic. In Chapter 4, the procedure of micromodel fabrication process is illustrated, and a simplified oil-water flow experiment results are described and analyzed in Chapter 5.
photo-polymerized structure microscope objective photomask UV light
Chapter 2
Ultraviolet Projection Lithography
2.1
Free Radical Photopolymerization
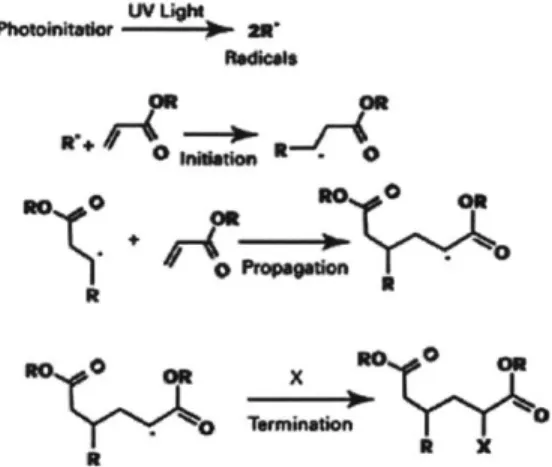
Free radical photopolymerization is a successive cross-linking process of free radicals and monomer molecules initiated by ultraviolet irradiation. When a homogeneous mixture of monomers, photoinitiator, and additional functional chemicals is exposed to ultraviolet radiation for a few millisecond or seconds, free radicals are generated by photolysis of light-sensitive photoinitiator molecules. UV radiation cleaves a bond of a photoinitiator molecule, generating highly reactive free radials. The free radicals
cre-PhcikEor
-kan-Olt UOO
Figure 2-1: Mechanism of free radical polymerization. Figure reproduced from Paint & Coating Industry magazine, www.pcimag.com.
ated from the initiating molecules transfer to the monomer units, attack double bond groups in monomer molecules, convert monomer molecules to a polymer. Monomer molecules are successively added to these cross-linking chains, and solid networks of polymers are created. This photopolymerization process is terminated if two free radicals join together, a hydrogen atom from one end is abstracted to another, or a radical abstracts a hydrogen atom from a neighboring molecule.
Photopolymerization is simple, rapid and versatile than other polymerization pro-cesses, and the application of free radical photopolymerization process can be con-trolled by exposure time, intensity of ultraviolet light, concentration of photoinitiator, and selective exposure by using an impenetrable layer.
2.2
Stop-Flow-Lithography Technique
a
b
Probe-ceaded Woroscope C Fluorefomtly re Wabeled monomer -ra nsp a rency maskFigure 2-2: Schematic set-up of ultraviolet projection lithography. This example shows the synthesis of bar-coded, probe-containing particles. Figure reproduced
from ref. [6].
In this work, we utilized the ultraviolet projection lithography technique that has
been developed in the Doyle Group, MIT [6]. The Doyle group has developed Stop-Flow-Lithography for high throughput production of ultraviolet cross-linked
hydro-gels. SFL introduces streams of precursor with a controlled-pressure pump, holds the
flow, polymerizes microparticles with specific geometrical features through pre-defined
transparent masks, and finally releases microparticles with supplying pressure again.
This stop-polymerization-flow sequence is repeated and SFL produces high-resolution microparticles at high-throughput (Figure 2-2). Instead of producing functional mi-croparticles, we utilize this photo-patterning technique to build polymeric structures in initially blank microchannels.
2.3
Fixed Structures with Surface Activation
Figure 2-3: Polymerization reaction inhibition due to the oxygen permeability of PDMS in Stop Flow Lithography. Figure reproduced from ref. [7].
3-(Trimethoxysilyl)propyl acrylate
.- H2
H3
OH OH OH
This part participates in the polymerization reaction to hold structures onto the glass
O 0 . O O
0 j ~
0
T
' N . "0 1 0
I 0I
glass surface acrylated glass
Figure 2-4: Surface activation with 3-(trimethoxysilyl)propyl acrylate.
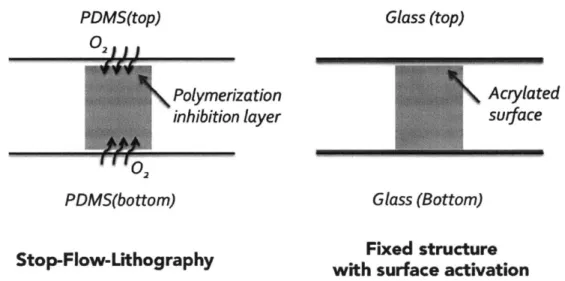
The only difference between the polymerization process of the previous Stop-Flow-Lithography and the process of the building fixed structures is whether polymerized particles are floating particles, or fixed structures in microchannels. During the SFL process, polymerized particles are not bound to the top and bottom surfaces due
to the oxygen permeability of PDMS(Polydimethylsiloxane). A thin oxygen layer
prevents the polymerization of precursor solutions near top and bottom surfaces by
forming inhibition layers [7].
approach, it is required to modify top and bottom surfaces chemistry to hold the polymerized structures in microchannels. We adapt a surface activation procedure as previously done by Srinivas et al. as follows for fixed PEG-DA (Poly(ethylene glycol) diacrylate) hydrogel posts in bioassays [8]. First a glass(top)-glass(bottom) channel is filled with 1M sodium hydroxide aqueous for 1 hour. After thoroughly rinsing the mi-crochannel with ethanol and water, the channel is filled with 3-(trimethoxysilyl)propyl
acrylate for 5 min. The microchannel is thoroughly rinsed with ethanol and water again, and cured at 80*C for 15 minutes for sufficient reaction. Later, when ultravi-olet polymerization reaction occurs, the top and bottom glass surfaces modified with acrylate functional group promotes polymer structure fixation on the surfaces (Figure 2-4).
PDMS(top) Glass (top) 02
Polymerization Acrylated
inhibition layer surface
02
PDMS(bottom) Glass (Bottom)
Stop-Flow-Lithography with surface activationFixed structure
Figure 2-5: Comparison between the polymerization process in an oxygen permeable PDMS channel and in a surface activated glass channel.
Chapter 3
Composite Structure of
Tricyclodecane Dimethanol
Diacrylate and Calcium Carbonate
with Oil-wet Behavior
3.1
Wettability
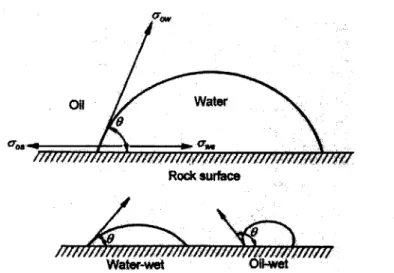
Wettability describes the spreading preference of liquids on a solid substrate. For the same amount of liquid, the more a liquid drop tends to spread out on a surface, the more liquid and solid molecules like each other and we consider that the wettability of the liquid on the solid surface is good. The wettability is conventionally measured by contact angle. This contact angle is formed by the balance of adhesion force (force between liquid and solid surface) and cohesion force (the intermolecular force of liquid). This force balance is expressed by Young's equation.
At pore level fluid displacements in oil reservoirs, oil interacts with the other phases, gas, brine, water and surfactants. When these transport phenomena occur in porous reservoirs, the wettability and geometrical features of oil reservoirs are impor-tant factors and have to be considered. In this experimental study, we are interested
Ol water
Rock surface
Water-wet Oil-wet
Figure 3-1: Young's equation for wettability, water-wet and oil-wet surfaces. in oil-water flows around geometrical structures with a tuned wetting property. As mentioned above, since the wettability is a relative preference of a solid surface, we need to define the wetting property of oil-wet (oleophilic) and water-wet (hydrophilic) depends on the configuration of water contact angle in oil (Figure 3-1). The relation-ship between interfacial tensions and the contact angle configuration is described by Young's equation. (Eqn. 3.1)
70s - 7.9 = ^twocos wo, (3.1)
where
= the interfacial tension between the oil and solid phases,
7W, = the interfacial tension between the water and solid phases, 7yo = the interfacial tension between the oil and water
There are no clear boundaries for the distinction of water-wet, intermediate-wet, or oil-wet. However, generally a surface is considered water-wet when a water contact
angle in oil is less than 75*, intermediate-wet when the contact angle is 75* ~ 105*,
Hydrophilic solid surface Sold-air-water Interface WfAir Solid Sold-water-oil interface IfCA.< UPOSOW Water Oil 91 CISO 'W7d 3 f Sold-water-oil Interface 7.ACOWI >Y,&COsW, Solid
Hydrophobic solid surface
Solid-air-water Interface <I YM Air Waler 7 0, Solid t Sold-air-oil lntetface 14SA< %0 Air Oil 7" SON 9 Solid Sold-air-oil Interface Air SoUi t t
Solid-water-oil Interface Solid-water-oil Interface
Y.COSSI> WACOW T0CNOA < TWAWOW
Water
CO- O 'V0., Oi Towi
Solid Solid Solid
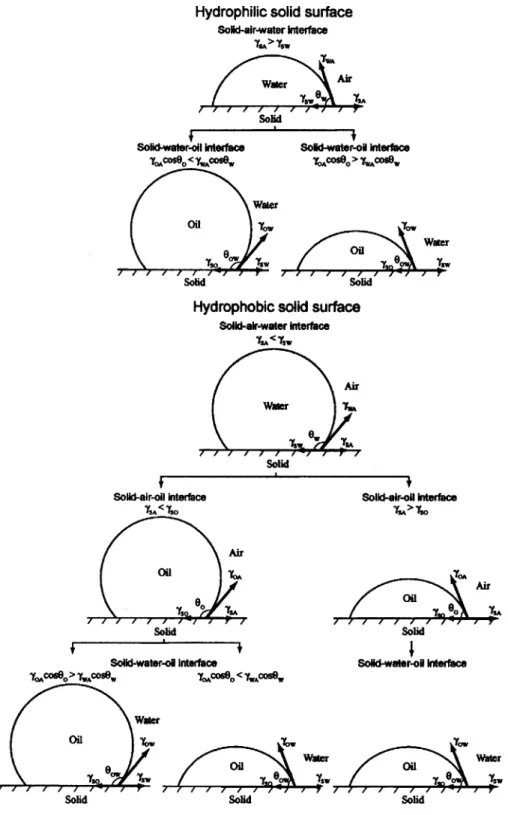
Figure 3-2: The relationship between water contact angle in air, oil contact angle in air, and oil contact angle in water describing hydro-philicity/phobicity and oleo-philicity/phobicity. Figure reproduced from ref. [9].
The water contact angle in oil can be also described by the relationship between water contact angle in air (hydrophilic/hydrophobic) and oil contact angle in air (oleophilic/oleophobic) as derived by Jung et al. [91:
= waCOS0wa - -YoaCOSoa (3.2)
7Wo
where
cos0wo = water contact angle in oil,
COS6wa = water contact angle in air,
cosGoa = oil contact angle in air,
7 = the surface tension of water,
-= the surface tension of oil,
-yw= the interfacial tension between the oil and water In this work, since we are mainly interested in a water-oil two-phase flow in porous media, we measured water contact angle in oil for relevant surfaces rather than mea-suring oil contact angle in air and water contact angle in air separately.
3.2
Oil-wet Carbonate Reservoirs
It is estimated that more than 60% of the world's oil and 40% of the world's gas reserves are held in carbonate reservoirs. For example, the Middle East is dominated by carbonate rocks, with around 70% of oil and 90% of gas reserves held within these reservoirs (Figure 3-3). When it comes to carbonate reservoirs, even though their main component, calcite, inherently shows water-wet behavior, the surface wetting property of carbonate oil reservoir rocks are known to be mostly oil-wet. Treiber et al. investigated 50 samples and showed that only 8% of the carbonate reservoir rocks were water-wet, 8% intermediate-wet, and 84% oil-wet (Figure 3-4) [10]. They explained that this is because absorbed organic components from the crude oil change most of the carbonate rocks from water-wet to oil-wet.
Figure 3-3: Carbonate oil reservoir distribution in the world. Figure reproduced from Schiumberger, www.slb.com.
For the above reason, oil reservoir research with micromodels takes wettability as an important factor [11]. We attempted to make structures containing real calcium carbonate particles instead of polymeric or glass structures in microfluidic channels.
Carbonate oil reservoir
Water-wet
8%
Intermediate
8%
Figure 3-4: Wettability distribution among carbonate oil reservoirs.
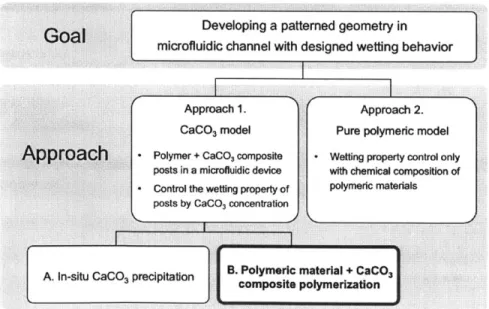
an in-situ calcium carbonate growth method using water absorptive hydrogel posts, and (2) a polymeric composite method. By using a photo-crosslinkable polymer as a binding material at minimum concentration, we can make calcium carbonate + tricy-clodecane dimethanol diacrylate composite structures. In this thesis, we concentrate on describing the polymer-CaCO3 composite approach. (Figure 3-5).
Approach 1.
CaCO3 model - Polymer + CaCO3 composite
posts in a microfluidic device
- Control the wetting property of
posts by CaCO concentration
Approach 2. Pure polymeric model Wetting property control only with chemical composition of polymeric materials
A. In-situ CaCO3 precipitation B. Polymeric material + CaCO3
I composite polymerization
Figure 3-5: Goal and approaches to make photo-patternable micromodels with oil reservoir properties.
Goal
Approach
Developing a patterned geometry in microfluidic channel with designed wetting behavior
3.3
Polymer-Calcium Carbonate Particle Composite
The aim of this research is to make a photo-pattered geometry in microfluidic chan-nels with designed wetting behavior. The approach 1-B is able to tune the wetting property of polymer-CaCO3 composite structures by adding hydrophilic or oleophiliccalcium carbonate filler to the polymer matrix.
Matrix (neutral wettability) Filler hydrophilic CaCO3 oleophilic CaCO3 UV-polymerize Composite hyrphilic composite oleophilic composite
Figure 3-6: Schematic approach of polymer-CaCO3 particle composite.
The matrix material that we use in this work has a neutral wetting property and the added CaCO3 particles are hydrophilic (pure CaCO3) or oleophilic
(stearic-acid treated CaCO3) particles. In other words, we tune the wetting property with
hydrophilic/oleophilic filler materials. Figure 3-6 shows the scheme of this approach.
3.3.1
Matrix
-
Tricyclodecane Dimethanol Diacrylate
0
I2C7
0lkr OL CH2
Figure 3-7: Chemical structure of tricyclodecane dimethanol diacrylate.
We use tricyclodecane dimethanol diacrylate (TCDDA) as our matrix, binding material. TCDDA exhibits desirable features as a matrix material in this study such
as, low shrinkage rate, non-porosity, low reactivity against solvents, good ultraviolet transmission, fast polymerization, and intermediate wettability.
We have also tested PUA (polyurethane acrylate) and NOA81(Norland Optical Adhesive, thiolene resin) as candidates, but both PUA and NOA81 show hydrophilic properties. Because we want to tune the wetting property of the composite struc-tures with respect to the wetting properties of the filler materials we use, in this case oleophilic/hydrophilic calcium carbonate particles, we need a polymeric matrix which has an intermediate wetting property. TCDDA has an intermediate wetting property, and it is also good for mixing with either the stearic-acid treated calcium carbonate(oleophilic) or the pure calcium carbonate(hydrophilic). The low viscosity and the refractive index of TCDDA are suitable for this work.
n-decane
Contact angle [*] a
Advancing Receding Water in n-decane 108 1 92 1 (TCDDA 90%, photo-initiator 10%, v/v)
Figure 3-8: Contact angle measurement of tricyclodecane dimethanol diacrylate. We first investigated the wetting property of TCDDA by measuring water contact angle in oil. The water contact angle on flat TCDDA substrates submerged in decane is 0a = 1080 (advancing contact angle). Since the value of advancing contact angle is generally accepted as an equilibrium contact angle, we consider the wetting property of the matrix to be relatively intermediate. Therefore, if a final polymerized composite material shows oil-wet or water-wet characteristics, we can say that it is due to the wetting property of mixed oelophilic or hydrophilic filler materials since the matrix material has an intermediate wetting property of intermediate.
3.3.2 Filler - Stearic-acid Treated Calcium Carbonate
oelophilic to mimic carbonate rocks in oil reservoirs. Fatty acids are commonly used surfactants to modify the surface property of calcium carbonate, and Gilbert et al. found that stearic acid is the most effective material among different kinds of fatty acids [12]. We followed a stearic-acid coating method from a previous work [13], and the calcium carbonate particles are supplied by Mississippi Lime in the form of dry powder. The particles are produced by precipitation, the mean particle size is 1.25 lim, and the type of crystal is acicular aragonite.
Figure 3-9: SEM image of calcium carbonate particles. This image is reproduced from Mississippi Lime.
Stearic acid Calcium carbonate
hydrophobic tail hydrophilic
head
Figure 3-10: The chemical structure of stearic acid and calcium carbonate powder. Calcium carbonate particles are coated with stearic acid in acetone, which is a good solvent of stearic acid. The calcium carbonate particles are first fully wetted in acetone. Then stearic acid in acetone (5 wt%) is added to the calcium carbonate suspension and kept in a reaction vessel. The suspension is then agitated for 4 hours at 80 'C by a magnetic stirrer.
calcium ion
*iPhysisorbed layer
calcium stearate(CaStz) Weaklinkinterface
ChemisorbedCSM
Cal.T
m ituMcelle d o ationFigure 3-11: Micelle adsorption model for stearic acid on the calcium carbonate surface in aqueous medium. Figure reproduced from [13].
Shi et al. [13] investigated and proposed the adsorption model of stearic acid on the calcium carbonate surfaces. They described the adsorption process of stearic acid in two steps. First, the chemisorbed monolayer of stearic acid is formed on calcium carbonate surfaces, and hydrophilic head of stearate ion towards calcium carbonate surface. Then multilayers of stearate micelles physically absorbed is followed by tail-to-tail arrangements.
W~ater droplet W~ater absorbed into surface
Stearic acid treated CaCO,, Pure CaCOI,
Figure 3-12: Water droplet tests on stearic-acid treated and pure-calcium carbonate particles in air.
Figures 3-12 and 3-13 show how we check the result of stearic-acid treatment on calcium carbonate particles. We prepare flat surfaces with stearic-acid treated and non-treated calcium carbonate particles and first check a water contact angle in
calcium carbonate particles while water is soaked by pure calcium carbonate particles. However, it is important to note that water repellency in air doesn't necessarily mean the surface prefers oil over water. However with the water droplet test, we can quickly verify that the surface property is changed by the treatment.
TCDDA
TCDDA + stearic acid treated CaCO
3
Mineral oil Mineral oil
Contact angle r a Contact angle ['] a
Advancing Receding Advancing Receding
108 1 84 1 148 3 142 3
Figure 3-13: Water contact angles on pure TCDDA and TCDDA
+
stearic-acid treated calcium carbonate composite surfaces.We also check water contact angles in the oil phase to see whether we can use this stearic-acid treated calcium carbonate to tune the surface property of the composite material 3-13. By mixing hydrophilic or oleophilic calcium carbonate to the TCDDA precursor solution, we want to cover the whole range of wetting properties from water-like to oil-water-like to achieve the universality of this composite method. The test shows that in the presence of water and oil phases, compared with pure TCDDA surface, the composite surface of TCDDA + stearic-acid treated calcium carbonate particles shows a higher water contact angle, and this means the oleophilicity is increased by adding stearic-acid treated calcium carbonate to TCDDA. However, here we also need to check whether this high contact angle is because of the particles exposed on the surface or because of the roughness increase due to particles under sub-surface. If the calcium carbonate particles are exposed and the wetting property of surface changes due to the dominant coverage of particles on the surface, the high water contact angle is what we wanted. If the calcium carbonate particles under the surface change the roughness of surface, that can also increase the oleophilicity of surface. The
roughness increase makes hydrophilic surfaces more hydrophilic, oleophilic surfaces more oleophilic. We are working on this issue to properly characterize the wetting properties of composite surfaces.
Chapter 4
Preliminary Flow Experiment:
Oil-Water Flow around
a Single
Composite Post
4.1
Microfluidic Chip Preparation Procedure
(D0
@
Initially we used microchannels fabricated from glass-PDMS (Polydimethylsilox-ane). Top parts of microchannels were made of PDMS blocks that have a straight channel using soft lithography. Thoroughly washed top PDMS parts and glass slides (0.2 mm of thickness) were plasma treated for 1 min, bonded together, and baked for 15 min at 80 C for firm adhesion. However, after building the polymeric posts in glass-PDMS microchannels, we found that top surface of the polymerized posts were not fully bonded to the PDMS surface during flow experiments. This delamination issue could complicate flow experiment analysis. We suspect the gap between the polymeric post and PDMS surface is because of the difference of acrylation density on glass and PDMS surfaces; PDMS has less dense acrylate sites on its surface than that of glass surface.
PDMS-glass microchannel Glass-glass microchannel
Lmine' mI --- glass
T 0O 9M% PI lox
TCDDA90% P 10%TCDDA9O%, P1 10%
Figure 4-2: Delamination issue with PDMS-glass microchannels.
For the above reason, we changed our microchannels from PDMS-glass microchips to all glass microfluidic chips (Hilgenberg GmbH, Germany). For surface activation, we follow the procedure previously described by Srinivas et al. [8]. First, the straight channel is filled with 1M sodium hydroxide (NaOH) solution for 1 hour. The channel is rinsed with ethanol, deionized water, and dried with argon gas. The cleaned channel is
Figure 4-3: Glass(top)-glass(bottom) microfluidic chip used in the experiment (chan-nel widths: 5 x 0.5 mm, 6 x 1.0 mm, 5 x 1.5 mm, chan(chan-nel depths: 0.05 mm, chan(chan-nel lengths: 18 mm).
with ethanol and water, and cured at 80 'C for 15 minutes to ensure fixation of the TCDDA + calcium carbonate post to the top and bottom glass surfaces during
ultraviolet projection polymerization.
Once a surface-activated glass-glass channel is ready, the channel is filled with the precursor solution of tricyclodecane dimethanol diacrylate-calcium carbonate compos-ite. A transparent mask with a desired geometrical feature is placed in the field-stop of inverted microscope and the precursor solution is polymerized with a controlled UV exposure (optimized condition of UV intensity and exposure time). The channel is washed thoroughly with an ethanol. Subsequent flow experiments are conducted by filling the channel with decane(oil phase) and the displacement of oil-phase with water flooding at constant pressure supply, or with reversed sequence.
4.2
Composite Post Polymerization and Flow
Exper-iment Procedure
With proper ratios between calcium carbonate particles, tricyclodecane dimethanol diacrylate and photoinitiator (Darocur 1173), oleophilic and hydrophilic composite posts are built with stearic-acid treated calcium carbonate and pure calcium carbon-ate, respectively. Thoroughly mixed composite precursor is injected in the activated glass-glass channel using syringes and UV-polymerizaton is done on the stage of an inverted microscope (Zeiss Axio Observer Al). A photomask with desired geometrical shapes is inserted in the field stop of the microscope, the microchannel is placed and aligned properly. UV exposure time is controlled with a LED light source on/off by LabView program.
1. polymerizaton 2. washing with ethanol 3. filling decane 4. flow water
Figure 4-4: Micromodel experiment steps: 1. Polymerization by UV lithography, 2. Washing uncured precursor, 3. Filling decane, and 4. Flowing water.
Figures on the next page show the oil displacement flow by water around oleophilic post (Fig. 4-5) and hydrophilic post (Fig. 4-6) with time. Since the olephilic post prefers oil rather than water, the oleophilic post forms a thin oil-film layer between the post and water. The oleophilic post is finally encapsulated by an oil-ring while the hydrophilic post touches the entering water phase and leaves only the small amount of oil phase at the posterior area.
A. stearic acid treated CaCO3 + tricyclodecane dimethanol diacrylate
Water
Figure 4-5: Displacement of decane with the treated calcium carbonate + tricyclodecane
B. pure CaCO3 + ticyclodecane
Water n
0.2 psi flow of water around a stearic-acid dimethanol diacrylate post.
dimethanol diacrylate
Figure 4-6: Displacement of decane with the 0.2 psi flow of water around a pure calcium carbonate + tricyclodecane dimethanol diacrylate post.
We can make a map of four possible combinations with two posts (oleophilic/hydrophilic) and two flow sequences (oil-water/water-oil flows). These four combinations can be used to demonstrate or explain the phenomenon of drainage, when a non-wetting entering fluid displaces a wetting fluid; and the imbibition, when a wetting fluid
displaces a non-wetting fluid.
1. Oleophilic post
1-B. Water -- Oil 1-A. Oil -. water
2. Hydrophilic post
2-B. Water -+ Oil 2-A. Oil -+ water
4.2.1
Oil/Water Capturing around Oelophilic/Hydrophilic Posts
Figures 4-8 and 4-9 show how oil/water is captured around oleophilic/hydrophilic posts with time when the posts prefer the displaced phase to displacing phase.
Figure 4-8: Oil capturing by oleophilic post when the decane is displaced by the water flow.
Figure 4-9: Water capturing by hydrophilic post when the water is displaced by the decane flow.
4.2.2 Water/Oil Repulsion by Hydrophobic/Oleophobic Posts
For the same oleophilic/hydrophilic posts used in previous section we do reverse flow sequences, respectively. Figures 4-10 and 4-11 show how water/oil is repelled by oleophilic/hydrophilic posts with time when the posts prefer the displacing phase to displaced phase.
Figure 4-10: Water repulsion by oleophilic post when the water is displaced by the decane flow.
Figure 4-11: Oil repulsion by hydrophilic post when the decane is displaced by the water flow.
Chapter 5
Summary and Future Plans
During my Master's work in Mechanical Engineering at MIT, I have conducted ex-perimental microfluidic research to build robust and reproducible micromodels for oil reservoir study. The idea and procedure of a bottom-up fabrication method for easier building and modification of geometrical structures in micromodels are described. Us-ing controlled ultraviolet light and transparency masks that have pre-defined geome-tries, it is possible to build cross-linked polymeric structures in blank microchannels. This versatile photo-patterning technique can easily produce multiple and various patterns within blank standard microfluidic chips, which can save considerable time and fabrication effort. The potential application of my research is developing mi-crofluidic platforms that can mimic underground oil reservoir environments under laboratory conditions.
I intend to improve and complete this experimental research during my doctoral work along with to study theoretical modeling of microfluidic systems. Once I set up this photo-definable, wetting-controllable microfluidic system and conduct flow experiments properly, I can propose physical interpretations of experimental results with respect to wettability, competition of forces, hydrodynamic force by shear flow and surface adhesion force by chemical interactions.
I intend to conduct experiments with various kinds of oil-water nanoemulsions for enhanced oil recovery research and functional smart particles for oil reservoir information within micromodels fabricated by the method introduced in this thesis.
Precipitation by alternate flows
PEG-DA hydrogel post
CaC12 NaHC03Ca3
incorporation by
Figure 5-1: Scheme of calcium carbonate in-situ growth.
As introduced in this thesis, we plan to develop the in-situ calcium carbonate growth method too. This growth method is different from the composite method and we expect to see different features and mechanisms of calcium carbonate growth in microfluidic channels. We are already doing preliminary experiments of this growth method experiments (Figure 5-1).
With completing the map of wetting properties, we are planning to do flow ex-periments with a single post or multiple posts and to do the dimensional analysis of flow patterns for further understanding of the oil-water two-phase flow (Eqn. 5.1).
A =
f
(W, D, P..ter, pil, IAwater, p loil, 77water-oil, ,post receding 9channel wall receding) (5.1) A the captured area of oil or water (two-dimensional assumption) W = the width of the microchannelD = the diameter of the post
Pwater = the density of water
pai = the density of oil
pwater = the viscosity of water
yoi = the viscosity of oil
7water-oail = the interfacial tension of water and oil POptreceding = the receding contact angle of the post
A. Oil -+ water flow
decarte
hydrophilicity oleophilicity
1?
B. Water - oil flow
oleophilidty hydrophilidty
[31331311313water
Figure 5-2: Oil/water drainage/imbibition control depends on oleophilic-ity/hydrophilicity of the structures.
Appendix A
Experimental Results Validation with
Computational Simulation
Thanks to help of Ankur Gupta of the Doyle Group, Chemical Engineering, MIT, we were able to validate our experimental results with computational simulation results. Computational simulation was done with an open source CFD software, OpenFOAM (Open source Field Operation And Manipulation). With the same properties of experiments, for example fluid properties of decane and water, geometric features of cylindrical post and channel width, flow velocity condition, and most importantly wetting property of the post are applied to the computational simulation. We see a decent agreement between experiments and simulation results. This computational simulation will help us to predict, validate and support micromodel experiments and hence it would save time and efforts.
Figure A-1: Comparison between a computational and an experimental results: Oil displacement by water flow with a oleophilic post.
-
Oil-wet case
ime waterd*fl
wateri
Bibliography
[1] N. K. Karadimitriou and S. M. Hassanizadeh. A Review of Micromodels and
Their Use in Two-Phase Flow Studies. Vadose Zone Journal, 11(3), 2012. [2] Mingzhe Dong, Qiang Liu, and Aifen Li. Micromodel Study of the Displacement
Mechanisms of Enhanced Heavy Oil Recovery by Alkaline Flooding. Proceedings of the International Symposium of the Society of Core Analysts, pages 2007-2047, 2007.
[31 Reservoir-on-a-chip (ROC): a new paradigm in reservoir engineering. Lab on a chip, 11(22):3785-92, 2011.
[4] Mengjie Wu, Feng Xiao, Rebecca M Johnson-Paben, Scott T Retterer, Xiaolong Yin, and Keith B Neeves. Single- and two-phase flow in microfluidic porous media analogs based on Voronoi tessellation. Lab on a chip, 12(2):253-61, 2012.
[5] Thomas W de Haas, Hossein Fadaei, Uriel Guerrero, and David Sinton. Steam-on-a-chip for oil recovery: the role of alkaline additives in steam assisted gravity drainage. Lab on a chip, 13(19):3832-9, 2013.
[6] Daniel C Pregibon, Mehmet Toner, and Patrick S Doyle. Multifunctional encoded particles for high-throughput biomolecule analysis. Science, 315(5817):1393-6, 2007.
[7] Dhananjay Dendukuri, Priyadarshi Panda, Ramin Haghgooie, Ju Min Kim, T. Alan Hatton, and Patrick S. Doyle. Modeling of Oxygen-Inhibited Free
Radical Photopolymerization in a PDMS Microfluidic Device. Macromolecules, 41(22):8547-8556, 2008.
[8] Rathi L Srinivas, Stephen D Johnson, and Patrick S Doyle. Oil-isolated hy-drogel microstructures for sensitive bioassays on-chip. Analytical chemistry, 85(24):12099-107, 2013.
[9] Yong Chae Jung and Bharat Bhushan. Wetting behavior of water and oil droplets in three-phase interfaces for hydrophobicity/philicity and oleophobicity/philicity.
Langmuir, 25(24):14165-73, 2009.
[101 L. E. Treiber and W. W. Owens. A laboratory evaluation of the wettability of fifty oil-producing reservoirs. Society of petroleum engineers journal, 12(06):531-540, 1972.
[11] MH Schneider and Patrick Tabeling. Lab-on-Chip Methodology in the Energy Industry: Wettability Patterns and Their Impact on Fluid Displacement in Oil Reservoir Models. American Journal of Applied Sciences, 8(10):927-932, 2011. [12] Marianne Gilbert, Pinsupha Petiraksakul, and I. Mathieson. Characterisation of
stearatestearic acid coated fillers. Materials science and technology, 17(11):1472-1478, 2001.
[13] Xuetao Shi, Roberto Rosa, and Andrea Lazzeri. On the coating of precipitated calcium carbonate with stearic acid in aqueous medium. Langmuir, 26(11):8474-82, 2010.
