A THESIS PRESENTED TO THE ÉCOLE DE TECHNOLOGIE SUPÉRIEURE
IN PARTIAL FULFILLMENT OF THE THESIS REQUIREMENT FOR THE DEGREE OF THE
PH.D. ENGINEERING
BY
ALBERT HUNG-REN KO
STATIC AND DYNAMIC SELECTION OF ENSEMBLE OF CLASSIFIERS
MONTREAL, OCTOBER 12,2007
THIS THESIS WAS EVALUATED BY A COMMITTEE COMPOSED BY :
Prof. Robert Sabourin, thesis director
Department of automated manufacturing engineering at École de technologie supérieure
Prof. Maarouf Saad, committee president
Department of electrical engineering at École de technologie supérieure
Prof. Laurent Heutte, external examiner LITIS, Université de Rouen
Prof. Eric Granger, examiner
Department of automated manufacturing engineering at École de technologie supérieure
Prof. Alceu de Souza Britto, Jr., invited examiner PPGia, Pontifical Catholic University of Parana
THIS THESIS WAS DEFENDED IN FRONT OF THE EXAMINATION COMMITTEE AND THE PUBLIC
ON OCTOBER 12, 2007
Thanks to all the friends and colleagues in LIVIA. They make nice tea, good coffee; they are skillful soccer players and wonderful chess partners. They improved my French, English, Spanish and Portuguese.
Thanks to my professor, Robert Sabourin. A demanding supervisor but an understanding teacher, a workaholic and a down-to-earth scientist, he read and directed all my works tirelessly. I would not achieve all these works without him.
A special thank is to Professor Alceu de Souza Britta, Jr. The EoHMM system is built on his HMM framework. He shares his codes with us and gives valuable comments on all my works.
Another thanks to Cynthia Orman. She is an English specialist and proof-read all my writings tirelessly.
Most of all, I want to thank my families in Taiwan, who supported me even 15,000 kms away, both financially and psychologically.
STATIC AND DYNAMIC SELECTION OF ENSEMBLE OF CLASSIFIERS
Albert Hung-Ren KO ABSTRACT
This thesis focuses on different techniques of ensemble of classifier (EoC) methods that will help improve pattern recognition results.
Pattern recognition can, in general, be regarded as a problem of classification, where dif-ferent patterns are presented and we need to classify them into specified classes. We create classifiers to perform the classification task. One way to improve the recognition rates of pattern recognition tasks is to improve the accuracy of individual classifiers, and another is to apply ensemble of classifiers (EoC) methods. EoC methods use multiple classifiers and combine their outputs. In general, the combined results of these multiple classifiers can be significantly better than those of the single best classifier. In this thesis, we only look into the techniques that improve EoC accuracy and not those that improve the accuracy of a single classifier.
Three major topics are associated with EoCs: ensemble creation, ensemble selection and classifier combination. In this thesis, we propose a new ensemble creation method for an ensemble of hidden markov models (EoHMM), three methods for ensemble selection for different circumstances, and a classifier combination method.
First and foremost, we propose compound diversity functions (CDF), which combine di-versities with the performance of each individual classifier, and show that there is a strong correlation between the proposed functions and ensemble accuracy. We will demonstrate that most compound diversity functions are better than traditional diversity measures. We also propose a pairwise fusion matrix (PFM) transformation, which produces reliable probabilities for the use of a classifier combination and can be amalgamated with most existing fusion functions for combining classifiers. The PFM requires only crisp class label outputs from classifiers, and is suitable for high-class problems or problems with few training samples. Experimental results suggest that the performance of a PFM can be a notch above that of the simple majority voting rule (MAJ), and that a PFM can work on problems where a Behavior Knowledge Space (BKS) rnight not be applicable.
Also proposed here is a new scheme for the optirnization of codebook sizes for HMMs and the generation of HMM ensembles. By using a pre-selected clustering validity index, we show that HMM codebook size can be optimized without training HMM classifiers. Moreover, the proposed scheme yields multiple optimized HMM classifiers, and each individual HMM is based on a different codebook size.
Two other alternative ensemble selection methods are also proposed here: a dynarnic en-semble selection method, and a classifier-free enen-semble selection method. The former applies different ensembles for test patterns, and the experimental results suggest that in sorne cases it performs better than both static ensemble selection and dynamic classifier selection. The latter explores the idea of "data diversity" for data subset selection. We try to select adequate feature subsets for Random Subspaces, and only use the select data subsets to create classifiers.
The main objective of the proposed methods is to offer applicable approaches that might advance the state of the art. But EoC optimization is a very complex issue and is related to a number of varied processes, and our contribution is intended merely to provide an improved understanding of the use of EoCs.
SELECTION STATIQUE ET DYNAMIQUE DES ENSEMBLES DE CLASSIFICATEURS POUR LA RECONNAISANCE DE CHIFFRES
MANUSCRITS Albert Hung-Ren KO
SOMMAIRE
Cette thèse porte sur différents aspects concernant la création des ensembles de classifica-teurs (EoC) pour la mise en oeuvre de systèmes de reconnaissance de formes robustes. La reconnaissance de formes peut être vue comme un problème de classification o des ob-jets inconnus (patterns) doivent être associés à une classe d'appartenance. Afin de réaliser cette tâche, des classificateurs doivent être sélectionnés suite au processus d'apprentissage sur une base de données représentative du problème de reconnaissance. Une approche classique consiste à choisir le classificateur le plus performant sur une base de validation; une autre approche consiste à choisir et à combiner un ensemble de classificateurs. Il a été montré dans la littérature qu'en général, les EoC généralisent mieux que les classifi-cateurs indivituels sur des nouvelles données. Dans cette thèse, plusieurs aspects traitant de la création des EoC sont analysés et plusieurs méthodes novatrices sont proposées afin d'obtenir des EoC les plus performants.
Trois mécanismes fondamentaux régissent la création des EoC : la génération des clas-sificateurs individuels, la sélection des clasclas-sificateurs les plus diversifiés et finalement la fusion des classificateurs pour former des EoC. Nous présentons dans cette thèse une nouvelle méthode pour la génération de HMM pour la création d'ensembles de HMM (EoHMM), trois nouvelles méthodes de sélection et une nouvelle méthode de fusion. Dans un permier temps, une nouvelle fonction objective CFD est proposée pour la sélec-tion des classificateurs pertinents. Cette foncsélec-tion est basée sur les performances individu-elles des classificateurs de l'ensemble et d'une mesure de diversité mesurée entre les pairs de classificateurs. Nous avons montré expérimentalement que la mesure de diversité pro-posée est supérieure aux mesures de diversité publiées dans la littérature pour la sélection des classificateurs.
Ensuite une nouvelle fonction de fusion basée sur une matrice de transformation pairwise (PFM) permet 1 'estimation fiable des probabilités a postériori dans les cas o le problème de reconnaissance comporte un grand nombre de classes. La transformation proposée a l'avantage d'être indépendante du type de sorties des classificateurs (étiquettes, scores, probabilités a posteriori, etc) et celle-ci est bien adaptée pour les bases d'apprentissage de petite taille. Nous avons montré empiriquement que la nouvelle fonction de fusion PFM montre en moyenne une meilleure performance que le vote majoritaire (MAJ), et se
comporte avantageusement par rapport à la méthode BKS dans plusieurs cas o le nombre de classes est très important.
Une nouvelle méthode pour la création des ensembles de HMM (EoHMM) est également proposée. Cette approche est basée sur le choix des N meilleurs codebooks choisis à par-tir de l'indice de validité des partitions XB, mesuré sur des partitions différentes de la base d'apprentissage. Un avantage de la méthode proposée est que le choix des meilleurs code books est effectué sans recourir à l'apprentissage des HMM. Le choix des codebooks pertinents est non supervisé et chaque modèle de l'ensemble est alors estimé sur un code-book comportant un nombre de centres différent.
Finalement deux nouvelles méthodes de sélection sont également proposées : la première est une nouvelle méthode pour la sélection dynamique des EoC basée sur le concept des Oracles (KNORA) et la deuxième repose sur le choix des sous-espaces de représenta-tion basé sur une mesure de diversité entre les partireprésenta-tions obtenues dans ces sous-espaces. Cette dernière approche permet de choisir les espaces de représentation des classificateurs individuels indépendemment du choix de la machine d'apprentissage.
Les ensembles de classificateurs constituent une nouvelle approche pour la conception de systèmes de classification robustes. Cette thèse apporte quelques solutions novatrices pour tenter de faire avancer notre compréhension dans ce domaine de recherche en pleine expansion.
SELECTION STATIQUE ET DYNAMIQUE DES ENSEMBLES DE CLASSIFICATEURS POUR LA RECONNAISANCE DE CHIFFRES
MANUSCRITS
Albert Hung-Ren KO
RÉSUMÉ
Les ensembles de classificateurs (EoC) permettent la mise en oeuvre de systèmes de re-connaissance de formes robustes. Nous présentons dans cette thèse plusieurs solutions novatrices pour tenter de solutionner trois problèmes fondamentaux reliés à la conception des EoC : la génération des classificateurs, la sélection et la fusion.
Une nouvelle fonction de fusion (Compound Diversity Function - CDF) basée sur la prise en compte de la performance individuelle des classificateurs et de la diversité entre pairs de classificateurs est proposée au chapitre un pour la sélection statique des ensembles. Un résultat important est la démonstration de l'existence d'une corrélation entre différentes versions de CDF et la performance globale de l'ensemble. De plus, nous avons montré que les variantes de CFD sont en général plus performantes pour la sélection statique des ensembles de classificateurs que les mesures de diversité publiées dans la littérature. Le deuxième chapitre présente une nouvelle fonction de fusion basée sur les matrices de confusions "pairwise" (PFM), mieux adaptée pour la fusion des classificateurs en présence d'un grand nombre de classes. Cette méthode transforme les étiquettes des classes géné-rées par les classificateurs en probabilités a postériori des classes. La méthode proposée est générale et s'applique à tous les types de classificateurs, peu importe la nature de la sortie (étiquettes, scores, probabilités à posteriori, etc). De plus, cette méthode est bien adaptée pour résoudre les problèmes de reconnaissance comportant un grand nombre de classes, et une base d'apprentissage de petite taille. Nous avons montré empiriquement que la nouvelle fonction de fusion PFM montre en général une meilleure performance que le vote majoritaire (MAJ), et se comporte avantageusement comparée à la méthode BKS dans plusieurs cas o le nombre de classes est très important.
Troisièmement, une nouvelle méthode est proposée pour générer des ensembles de Mo-dèles de Markov Cachés (Hidden Markov Models - EoHMM) pour la reconnaissance des caractères manuscrits. Plusieurs hypothèses de codebooks sont générées à partir d'une me-sure de validité des clusters. Le choix des codebooks est non supervisé, c'est-à-dire que le choix n'est pas basé sur la performance en généralisation des HMM mais a priori à partir de la qualité des partitions obtenues lors de la recherche du meilleur codebook. Nous avons observé que les modèles ainsi générés montrent une diversité d'opinions en généralisation ce qui permet la création de EoHMM performants. La validation de la méthode proposée sur la base de chiffres manuscrits NIST SD19 montre des résultats très encourageants.
Le chapitre quatre porte sur la sélection dynamique des ensembles de classificateurs. En effet, la sélection statique des ensembles de classificateurs suppose que le niveau de com-pétence du meilleur ensemble est élevé pour tous les exemples de test à classer. Cette remarque s'applique évidemment au choix du meilleur classificateur individuel. Une so-lution novatrice est proposée dans ce chapitre et repose sur le concept des Oracles asso-ciés aux données de la base de validation (KNORA). En effet, supposons une observation appartenant à la base de validation, la définition d'un Oracle réfère aux classificateurs individuels qui sont en mesure de classer correctement cette observation. La sélection dynamique consiste à localiser les observations de la base de validation qui sont dans le voisinage immédiat de 1' exemple de test à classer et de constituer dynamiquement un ensemble de classificateurs défini par tous les oracles associés aux observations faisant parti de ce voisinage. Le principe de la méthode est simple et les résultats expérimentaux obtenus sont très prometteurs.
La méthode des sous-espaces aléatoires (Random Subspace Method - RSS) proposée par T.K. Ho permet la génération de pools de classificateurs diversifiés et bien adaptés pour la création des EoC. Actuellement il n'y a pas de méthode efficace pour la sélection des sous-espaces pertinents. Une nouvelle approche est proposée dans ce chapitre pour la sé-lection des sous-espaces de représentation à partir d'une mesure de diversité évaluée entre les paires de partitions. La première étape est de partitionner la base de validation en K clusters pour chaque sous-espace de représentation. L'hypothèse que nous posons est que la diversité entre les partitions dans les sous-espaces est reliée à la diversité d'opinions des classificateurs spécialisés dans ces mêmes sous-espaces de représentation. Nous avons montré expérimentalement que cette relation existe et que le choix des sous-espaces de représentation qui montrent une grande diversité permet de générer des pools de classifi-cateurs adaptés pour la création des EoC. Un avantage important de la méthode proposée est que le choix des sous-espaces de représentation est indépendant du choix de la machine d'apprentissage.
Les méthodes proposées dans les cinq chapitres ont été soumis dans des journaux spé-cialisés et reconnus dans notre domaine de recherche (Pattern Recognition, International Journal on Pattern Recogniton and Artificial Intelligence, Pattern Analysis and Applica-tion et TPAMI). De plus, plusieurs communicaApplica-tions dans les conférences internaApplica-tionales ont également été présentées (GECC02006, IJCNN2006, ICPR2006, MCS2007 et IC-DAR2007). Les ensembles de classificateurs constituent une nouvelle approche pour la conception de systèmes de classification robustes. Cette thèse apporte quelques solutions novatrices pour tenter de faire avancer notre compréhension dans ce domaine de recherche en pleine expansion.
TABLE OF CONTENT Page ACKNOWLEDGMENTS ... i ABSTRACT ... i SOMMAIRE ... iii RÉSUMÉ ... i
TABLE OF CONTENT ... iii
LIST OF TABLES ... vii
LIST OF FIGURES ... xiii
LIST OF ABBREVIATIONS ... xx
LIST OF SYMBOLS ... xxv
CHAPTER 1 INTRODUCTION ... 1
1.1 Background: Ensemble of Classifiers ... 1
1.2 State-of-the-Art of the Methodology ... 2
1.2.1 Ensemble Generation ... 2
1.2.2 Ensemble Selection ... 3
1.2.3 Classifier Combination ... 4
1.3 Problem Statement. ... 5
1.4 Objectives and Contributions ... 7
1.5 Organization of the Thesis . . . 10
CHAPTER 2 COMPOUND DIVERSITY FUNCTIONS FOR ENSEMBLE SELECTION ... 14
2.1 Introduction... . . . 14
2.2 Dilemma of the Ambiguity towards the Ensemble Accuracy ... 18
2.3 Proposed Compound Diversity Functions ... 21
2.4 Con cern about the Number of Classes and the Number of Classifiers ... 27
2.5 Diversity Measures ... 32
2.6 Correlations between Diversity and Ensemble Accuracy ... 33
2.6.2 Bagging ... 35
2.6.3 Boosting ... 38
2.6.4 Discussion on the Correlation between Diversity and Ensemble Accuracy ... 39
2.7 Ensemble Selection and Diversity as Objective Function ... 40
2.7 .1 Experimental Protocol for Ensemble Selection ... 40
2.8 Discussion ... 45
2.9 Conclusion ... 47
CHAPTER 3 PAIR WISE FUSION MATRIX FOR COMBINING CLASSIFIERS ... 49
3.1 3.2 3.2.1 3.2.2 3.2.3 3.2.4 3.3 3.3.1 3.3.2 3.3.3 3.3.4 3.4 3.5 3.5.1 3.5.2 3.5.2.1 3.6 3.7 Introduction ... 49
Fusion Functions for Label Outputs Classifier Combination ... 53
Simple Majority Voting Rule (MAJ) ... 53
Weighted Majority Voting Rule (W-MAJ) ... 54
Naïve Bayes (NB) ... 54
Behavior-Knowledge Space (BKS) and Wernecke's method (WER) .... 55
The Concept of Pairwise Fusion Matrices ... 56
Pairwise Fusion Matrix Transformation (PFM) ... 56
Apply PFM on fusion functions of Continuous-values outputs ... 59
Apply PFM on fusion functions oflabel outputs ... 60
Other Alternatives for PFM ... 61
The Relationship between BKS and PFM-MAJ ... 64
Experimental Comparison of Classifier Combination Rules of Crisp Label Outputs ... 65
Experiments on UCI Machine Learning Repository ... 66
Large Size and High Dimensional Ensembles: Random Subspace with KNN Classifiers ... 71
Experimental Protocol for KNN ... 72
Discussion ... 78
Conclusion ... 79
CHAPTER 4 ENSEMBLE OF HMM CLASSIFIERS BASED ON THE CLUSTERING VALIDITY INDEX FOR A HANDWRITTEN NUMERAL RECOGNIZER ... 81
4.1 Introduction ... 81
4.2 Clustering Validity Indices ... 86
4.2.1 R-squared (RS) index ... 87
4.2.2 Root-Mean-Square Standard Deviation (RMSSTD) index ... 89
4.2.3 Dunn's Index ... 90
4.2.4 Xie-Beni (XB) index ... 91
v
4.2.6 Davies-Bouldin (DB) index ... 94
4.2.7 clustering validity index for Codebook Size Selection ... 96
4.2.8 Generation of HMM classifiers ... 97
4.3 Experiments with EoHMMs ... 98
4.3.1 Behaviors of clustering validity indices in HMM features ... 99
4.3.2 The Multiple Levels of Granularity in Codebook Size Selection ... 102
4.3.3 Optimum Codebooks Selected by XB Index ... 106
4.3.4 Column-EoHMM and Row-EoHMM ... 107
4.3.5 Ensemble Selection ... 108
4.4 Discussion ... 112
4.5 Conclusion ... 113
CHAPTER 5 FROM DYNAMIC CLASSIFIER SELECTION TO DY-NAMIC ENSEMBLE SELECTION ... 116
5.1 Introduction ... 116
5.2 Dynamic Classifier Selection Methods ... 119
5.2.1 Overall Local Accuracy (OLA) ... 119
5.2.2 Local Class Accuracy (LCA) ... 119
5.2.3 A Priori Selection Method (a priori) ... 120
5.2.4 A Posteriori Selection Method (a posteriori) ... 120
5.3 K-Nearest-Oracles (KNORA) Dynamic Ensemble Selection ... 120
5.3.1 Comparison ofDynamic Selection Schemes on UCI Repository ... 123
5.3.2 Random Subspace ... 124
5.3.3 Bagging ... 125
5.3.4 Boosting ... 127
5.4 Experiments for Dynamic Selection on Handwritten Numerals ... 128
5.4.1 Experimental Protocol for KNN ... 128
5.4.2 Static Ensemble Selection with Classifier Performance ... 131
5.4.3 Dynamic Ensemble Selection ... 131
5.4.4 Effect of Validation Sample Size ... 135
5.4.5 Effect of Classifier Pool Size ... 138
5.5 Discussion ... 141
5.6 Conclusion ... 144
CHAPTER 6 THE IMPLICATION OF DATA DIVERSITY FOR A CLASSIFIER-PREE ENSEMBLE SELECTION IN RAN-DOM SUBSPACES ... 146
6.1 Introduction ... 146
6.2 Clustering Diversity Measures ... 149
6.2.1 Basic Concept of Clustering Diversity ... 149
6.3 Evaluation of Objective Functions for Ensemble Selection on
the UCI Machine Learning Repository ... 155
6.3.1 Search with the Single Genetic Algorithm ... 160
6.3.2 Search with the Multi-Objective Genetic Algorithm ... 163
6.4 Evaluation of Objective Functions for Ensemble Selection on a Handwritten Numeral Recognition Problem ... 168
6.4.1 Single Genetic Algorithm for Ensemble Selection for Handwritten Numeral Recognition ... 171
6.4.2 Multi-Objective Genetic Algorithms for Ensemble Selection for Handwritten Numeral Recognition ... 173
6.4.3 Classifier-Pree Ensemble Selection Combined with Pairwise Fusion Functions for Handwritten Numeral Recognition ... 177
6.5 Discussion ... 179 6.6 Conclusion ... 180 CHAPTER 7 CONCLUSION ... 182 7.1 Contributions ... 182 7.2 Future Works ... 183 APPENDIX 1: The Random Subspaces ensemble creation method ... 185
2: The Effects of the Class Size and of the Ensemble Size on the Correlation between the Classifier Diversity and the Ensemble Accuracy ... 188
3: Classifier Diversity Measures ... 192
4: Justification of Disagreement Measure (DM) as a Classifier Diversity Index .198 5: From Classifier Diversity to Clustering Diversity: A Case Study of Disagreement Measure ... 202
6: The Approximation of the Disagreement Measure Based on Mirkin's Metric219 BIBLIOGRAPHY ... 237
Tabler Table II Table III Table IV Table V Table VI Table VII Table VIII LIST OF TABLES Page
UCI data for ensembles of classifiers ... 33 Correlation for the Random Subspaces method between
ensemble accuracy and: (a) Mean Classifier Error; (b) the average of diversity measures; (c) the proposed compound diversity functions. The arrows indicate the expected
correlations:
l
for -1 andi
for 1 ... 36 Correlation for Bagging method between ensemble accuracyand: (a) Mean Classifier Error; (b) the average of pure diversity measures; (c) the proposed compound diversity functions. Note that the arrows indicate the expected
correlations:
l
for -1 andi
for 1 ... 37 Correlation for Boosting method between ensemble accuracyand: (a) Mean Classifier Error; (b) the average of pure diversity measures; (c) the proposed compound diversity functions. Note that the arrows indicate the expected
correlations:
l
for -1 andi
for 1 ... 38 The recognition rates of the ensembles selected by differentobjective functions, including traditional diversity measures and compound diversity functions (CDF), on NIST SD19
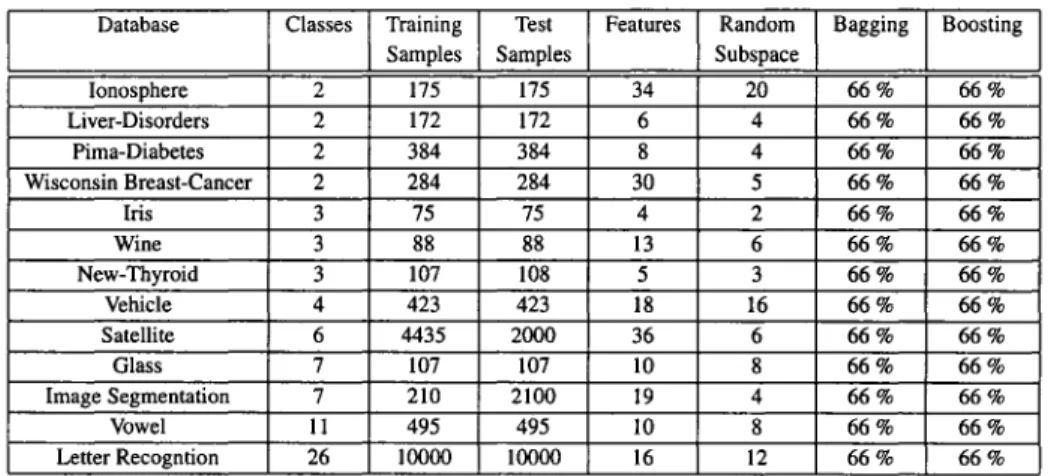
handwritten numerals ... 43 uer data for ensembles of classifiers ... 68 Comparison of recognition rates of different fusion functions
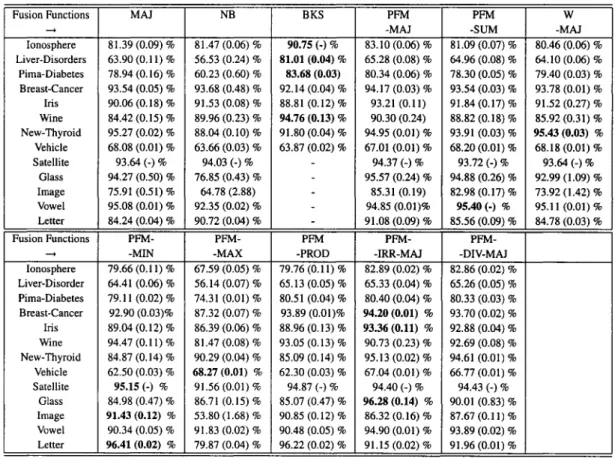
with Random Subspace on uer machine learning problems. AU numbers are in percents (%),the variances are indicated in parenthesis. Note that 3 classification algorithms were
used and only average values are shawn here ... 69 Comparison of recognition rates of different fusion functions
with Bagging on uer machine learning problems. AU numbers are in percents (%), the variances are indicated in parenthesis. Note that 3 classification algorithms were used
Table IX Table X Table XI Table XII Table XIII Table XIV Table XV Table XVI
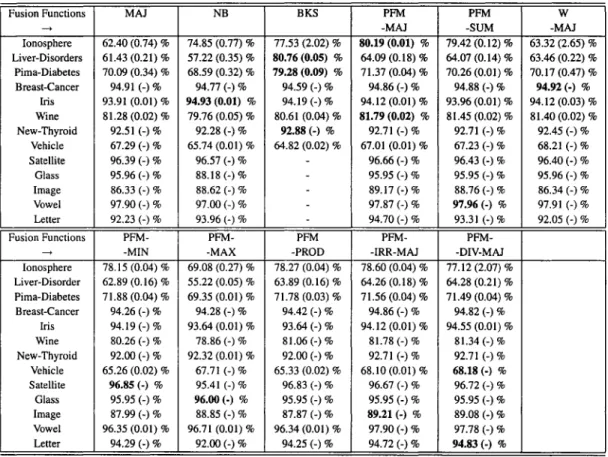
Comparison of recognition rates of different fusion functions with Boosting on UCI machine learning problems. AU numbers are in percents (%), the variances are indicated in parenthesis. Note that 3 classification algorithms were used
and only average values are shown here ... 71 Mean recognition rates of ensembles selected by compound
diversity functions and combined with various fusion functions. The accuracy of the PFM-DIV-MAJ is the mean value ofthe results applying 10 different diversity measures. Ali variances are smaller than 0.01 %. O.F. = Objective
Functions; F.F. =Fusion Functions ... 74 Comparison classification accuracy
with ensembles composed of 5 absolute optima (ABS) and of 5 relative optima (REL) in terms of XB index. Results are shown on test set and validation set. The number of
classifiers is shown in parenthesis .. .. .. .. .. .. .. .. .. .. .. .. .. .. .. .. .. .. . 105 Classification accuracies of 20 column HMM classifiers and
20 row HMM classifiers generated by different codebook sizes on test data set. CCS: Column Codebook Size; RCS: Row Codebook Size; CA: Classification Accuracy. The codebook sizes are ranked by their XB index from left to
right ... 107 Comparison of classification accuracies on test data set with
two different fusion functions and on different types of
EoHMMs. The number of classifiers is shown in parenthesis . . . 108 Best Performances from 30 GA replications on the test data
set. The numbers of classifiers are noted in parenthesis. The
SUM was used as the fusion function in EoC . . . 109 Best Performances from 30 GA replications on the test data
set. The numbers of classifiers are noted in parenthesis. The
PCM-MAJ was used as the fusion function in EoC ... 110 UCI data for ensembles of classifiers. Tr = Training
Samples; Ts
=
Test Samples; RS-Card.=
Random Subspace Cardinality; Bagging=
Proportion of samples used forTable XVII Dynamic Selection results for Random Subspace using KNN classifiers. KN-E = KNORA-ELIMINATE; KN-E-W = KNORA-ELIMINATE-W;. U= KNORA-UNION; KN-U-W= KNORA-UNION-W; a Pr = a Priori; a Post = a
lX
Posteriori; SB= Single Best ... 125 Table XVIII Dynamic Selection results for Random Subspace using
Parzen classifiers. KN-E = KNORA-ELIMINATE; KN-E-W = KNORA-ELIMINATE-KN-E-W;. KN-U= KNORA-UNION; KN-U-W= KNORA-UNION-W; a Pr =a Priori; a Post= a
Posteriori; SB= Single Best ... 125 Table XIX Dynamic Selection results for Random Subspace using QDC
classifiers. KN-E = KNORA-ELIMINATE; KN-E-W = KNORA-ELIMINATE-W;. U= KNORA-UNION; KN-U-W= KNORA-UNION-W; a Pr = a Priori; a Post = a
Posteriori; SB= Single Best ... 126 Table XX Dynamic Selection results for Bagging using
KNN classifiers. KN-E = KNORA-ELIMINATE; KN-E-W = KNORA-ELIMINATE-KN-E-W;. KN-U= KNORA-UNION; KN-U-W= KNORA-UNION-W; a Pr =a Priori; a Post= a
Posteriori; SB= Single Best ... 126 Table XXI Dynamic Selection results for Bagging using Parzen
classifiers. KN-E = KNORA-ELIMINATE; KN-E-W = KNORA-ELIMINATE-W;. U= KNORA-UNION; KN-U-W= KNORA-UNION-W; a Pr = a Priori; a Post = a
Posteriori; SB= Single Best ... 127 Table XXII Dynamic Selection results for Bagging using
QDC classifiers. KN-E = KNORA-ELIMINATE; KN-E-W = KNORA-ELIMINATE-KN-E-W;. KN-U= KNORA-UNION; KN-U-W= KNORA-UNION-W; a Pr =a Priori; a Post= a
Posteriori; SB= Single Best ... 127 Table XXIII Dynamic Selection results for Boosting using KNN
classifiers. KN-E = KNORA-ELIMINATE; KN-E-W = KNORA-ELIMINATE-W;. U= KNORA-UNION; KN-U-W= KNORA-UNION-W; a Pr = a Priori; a Post = a
Table XXIV Dynamic Selection results for Boosting using Parzen classifiers. KN-E = KNORA-ELIMINATE; KN-E-W = KNORA-ELIMINATE-W;. U= KNORA-UNION; KN-U-W= KNORA-UNION-W; a Pr = a Priori; a Post = a
Posteriori; SB= Single Best ... 129 Table XXV
Table XXVI
Dynamic Selection results for Boosting using QDC classifiers. KN-E = KNORA-ELIMINATE; KN-E-W = KNORA-ELIMINATE-W;. U= KNORA-UNION; KN-U-W= KNORA-UNION-W; a Pr = a Priori; a Post = a
Posteriori; SB = Single Best . . . 130 The recognition rates on test data of ensembles searched by
GA with the Mean Classifier Error, Majority Voting Error. ME = Mean Classifier Error; MYE = Majority Voting Error;
OF= Objective Functions ... 131 Table XXVII The best recognition rates of proposed dynamic ensemble
selection methods. RR= Recognition Rates . . . 132 Table XXVIII The best recognition rates of each dynamic ensemble
selection methods. RR= Recognition Rates . . . 133 Table XXIX The problems extracted from the UCI Machine Learning
Data Repository ... 157 Table XXX The average recognition rates of KNN classifiers selected by
GA with different objective functions. The average ensemble
sizes of MYE and ME are shown in the parenthesis . . . 161 Table XXXI The average recognition rates of QDC classifiers selected by
GA with different objective functions. The average ensemble
sizes of MYE and ME are shown in the parenthesis . . . 161 Table XXXII The average recognition rates of the ensembles of PARZEN
WINDOWS classifiers selected by GA with different objective functions. The average ensemble sizes of MYE
and ME are shown in the parenthesis . . . 162 Table XXXIII The average recognition rates of the ensembles of KNN
classifiers selected by MOGA with different objective functions on problems extracted from the UCI machine
Table XXXIV The average ensemble sizes of KNN classifiers selected by MOGA with different objective functions on problems
xi
extracted from the UCI machine leaming repository ... 164 Table XXXV The average recognition rates of the ensembles of QDC
classifiers selected by MOGA with different objective functions on problems extracted from the UCI machine
leaming repository . . . 165 Table XXXVI The average ensemble sizes of QDC classifiers selected
by MOGA with different objective functions on problems
extracted from the UCI machine leaming repository ... 165 Table XXXVII The average recognition rates of the ensembles of PARZEN
WINDOWS classifiers selected by MOGA with different objective functions on problems extracted from the UCI
machine leaming repository . . . 166 Table XXXVIII The average ensemble sizes of PARZEN WINDOWS
classifiers selected by MOGA with different objective
functions on problems extracted from the UCI ... 166 Table XXXIX The significance p value of the recognition rates between
Table XL
Table XLI
Table XLII
classifier-free MOGA search and classifier-free GA search ... 167 The average recognition rates on test data of ensembles
searched by GA with different objective functions including: original clustering diversity measures, compared with mean classifier errors and majority voting errors. The simple majority voting was used as the fusion functions, and the
ensemble sizes were indicated in parenthesis . . . 172 The average recognition rates on test data of ensembles
searched by MOGA with different objective functions including: original clustering diversity measures, three approximations of classifier diversity measures, compared with mean classifier errors and majority voting errors. The simple majority voting was used as the fusion functions, and
the ensemble sizes were indicated in parenthesis ... 175 The p-value of hypothesis test on the recognition rates of
ensembles selected by various objective functions compared
Table XLIII The average recogmtwn rates on test data of ensembles searched by MOGA with different objective functions. The pairwise confusion matrix applying the pairwise-majority voting was used as the fusion functions. The ensemble sizes
are the same as those in Table. XLI . . . 179 Table XLIV Key concept for relating clustering diversity to classifier diversity .. 205 Table XLV The synthetic databases generated for proof of concept . . . 211 Table XLVI The centroids of the generated synthetic clusters ... 213 Table XLVII The correlations between the disagreement measure (DM)
and the clustering diversities in the synthetics data. The nearest prototype (the centroid of the nearest cluster) is used
as the classification method ... 215 Table XLVIII The problems extracted from the
uer
Machine LearningData Repository for the correlation measurements between
DM and the clustering diversities ... 215 Table XLIX The correlations between the clustering diversities and the
disagreement measure (DM) in
Uer
databases . . . 216 Table L Definition of the four variations of information measures ... 224 Table LI Decomposition of C10 by Fig.47 ... 228LIST OF FIGURES
Figure 1 The map of relationship between the proposed methods. The solid lines indicate that the methods are compatible and can be used together, and the dash lines means that the application as post-processing is possible. The double line between CDF and
Page
PFM indicates that both are pairwise based ... 12 Figure 2 Distribution of 100 votes in ensembles: (a) 10-class problem; (b)
3-class problem ... 30 Figure 3 An ensemble of 7 classifiees (Cl "" C7); the shadowed circles
represent the classifiers needed to achieve the majority, the solid lines represent the pairwise diversities among classifiers, and the dashed lines represent t e required modified-pairwise-diversities so that the majority of votes could be shifted into another class: (a) at least 4 votes needed in 2-class problems; 6 modified pairwise-diversities needed for majority-shifting; (b) at !east 2 votes needed in 6-class problems; 2 modified pairwise-diversities needed for majority-shifting. This figure serves only as an
example. For details, please see appendix 2 ... 31 Figure 4 The correlations between the CDFs and the accuracy on the letter
recognition problem extracted from the
uer
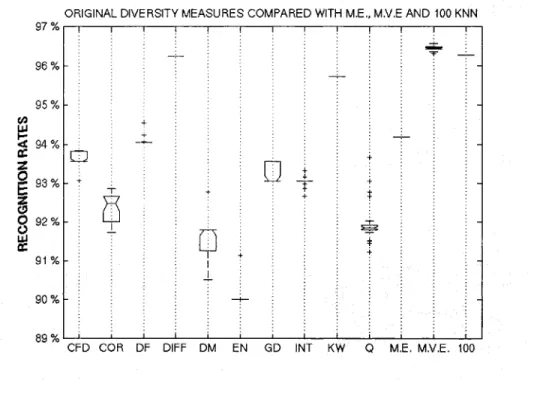
machine learning database with the Random subspaces as the ensemble creation method. We can observe that the larger the ensemble size, thelower the correlation ... 41 Figure 5 The recognition rates achieved by EoCs selected by original
diversity measures, compared with the Mean Classifier Error (ME), Majority Voting Error (MVE), and the ensemble of all
( 1 00) KNN classifiers ... 42 Figure 6 The recognition rates achieved by EoCs selected by compound
diversity functions, compared with the Mean Classifier Error (ME), Majority Voting Error (MVE), and the ensemble of all
Figure 7 An example of pairwise confusion matrices transformation in a 6-classifier ensemble. (a) The original ensemble with 6 6-classifiers; and (b) the transformation yields to 6;5
=
15 classifier pairs. Note that each classifier pair is equal to the link between twoclassifiers in (a) ... 52 Figure 8 The recognition rates achieved by EoCs selected by 10 compound
diversity functions and Majority Voting Error (MVE), using the
simple MAJ as fusion function ... 75 Figure 9 The recognition rates achieved by EoCs selected by 10 compound
diversity functions and Majority Voting Error (MVE), using
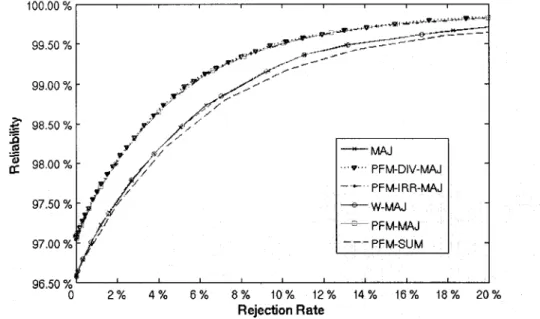
PFM-MAJ as fusion function ... 76 Figure 10 The rejection curve of ensemble of KNNs selected by Majority
Voting Error (MVE), with evaluated fusion functions: MAJ, W-MAJ, PFM-SUM, PFM-W-MAJ, PFM-IRR-MAJ and PFM-DIV-MAJ. The accuracy of the PFM-DIV-MAJ is the mean value of
the results applying 10 different diversity measures ... 77 Figure 11 The benchmark HMM classifiers: For any character image, we
scan the image from left to right, and obtain a sequence of columns as the observations; we then scan this image again from top to bottom, and obtain a sequence of rows as the observations. By this means, features are extracted from each column and each row, a column HMM classifier and a row HMM classifier are thus
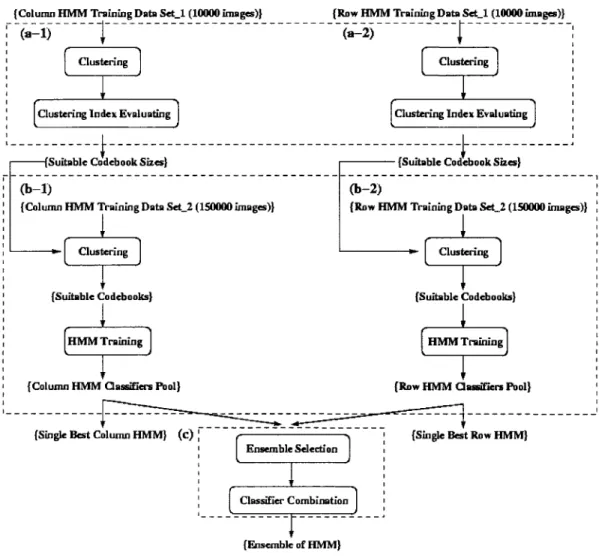
constructed for isolated handwritten numeral recognition ... 83 Figure 12 The EoHMM classification system approach includes: (a) the
adequate codebook sizes searching; (b) code books generation and HMM classifiers training (c) EoHMM selection and combination. Both (a) and (b) were carried out separately on
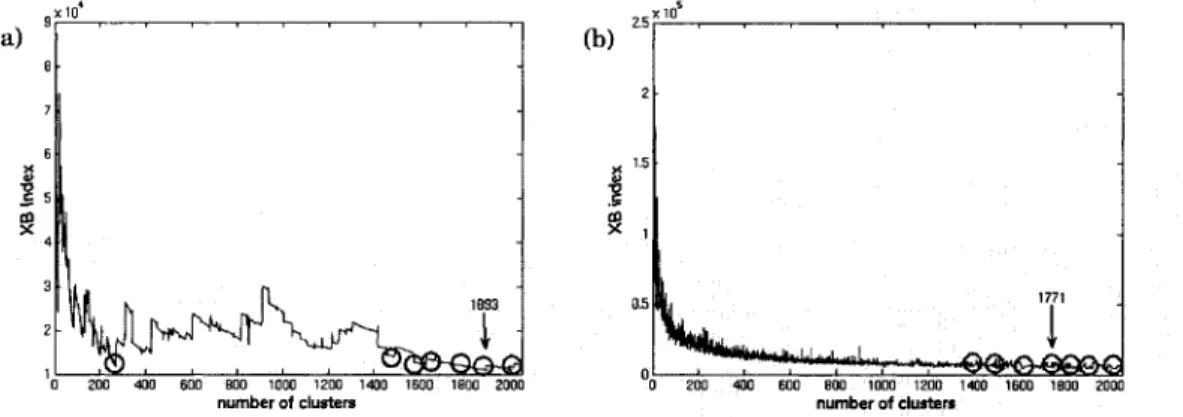
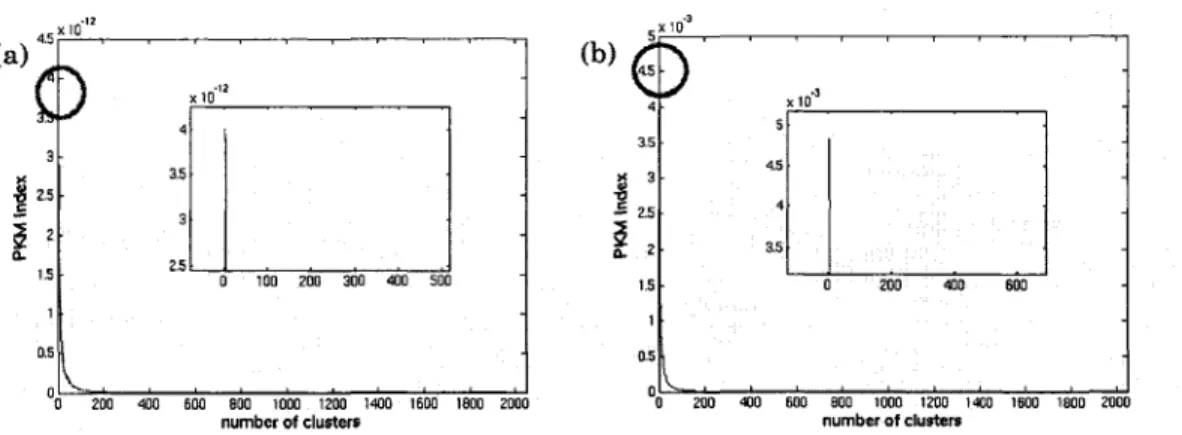
column and row HMM classifiers ... 85 Figure 13 The relationship between XB index and the number of clusters
for: (a) HMM colurnn features; (b) HMM row features. The circled areas indicate the places where the best 40 optima were found. The arrow indicates the smallest XB value with the respective number of clusters. Note that clusterings were carried out on the first 10000 images of the training data set. (See Table
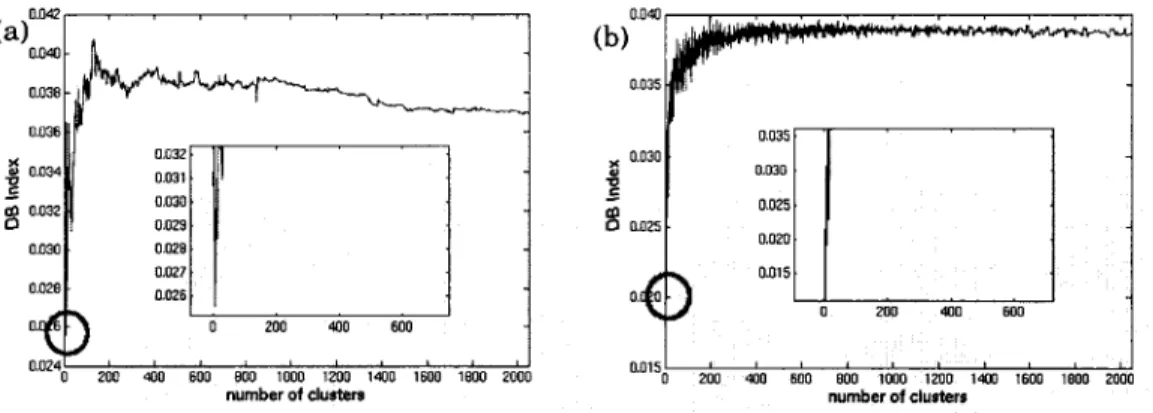
Figure 14 The relationship between DB index and the number of clusters for: (a) HMM column features; (b) HMM row features. Optima are minima in DB index, we enlarge the part where the optimum is located. Note that clusterings were carried out on the first
xv
10000 images of the training data set ... 101 Figure 15 The relationship between PBM index and the number of clusters
for: (a) HMM column features; (b) HMM row features. The optimum has the maximum value in PBM index, we enlarge the part where the optimum is located. Note that clusterings were
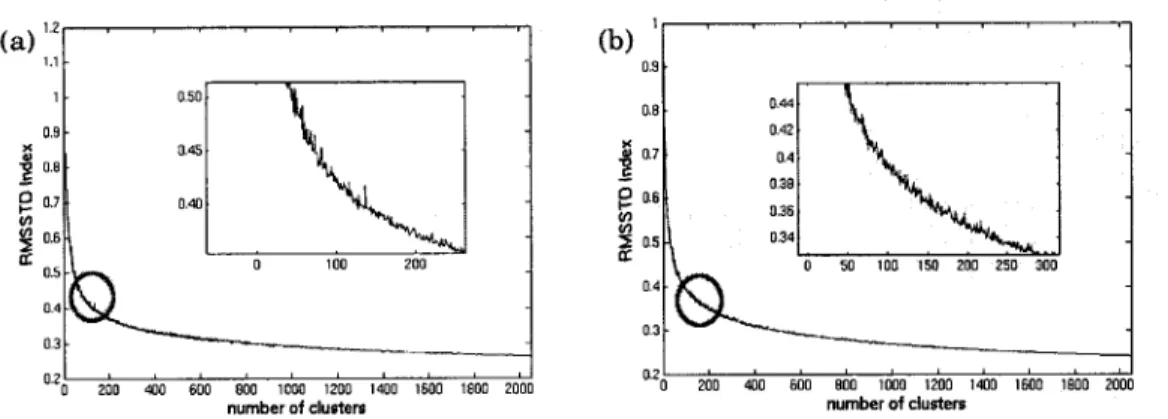
carried out on the first 10000 images of the training data set . . . 102 Figure 16 The relationship between RMSSTD index and the number of
clusters for: (a) HMM column features; (b) HMM row features. The optimum is located on the "knee" of the curve in RMSSTD index, we enlarge the part where the optimum is located. Note that clusterings were carried out on the first 10000 images of the
training data set. . . 103 Figure 17 The relationship between RS index and the number of clusters
for: (a) HMM column features; (b) HMM row features. The optimum is located on the "knee" of the curve in RS index, we enlarge the part where the optimum is located. Note that clusterings were carried out on the tir t 10000 images of the
training data set. . . 104 Figure 18 The Rejection mechanism with the SUM rule . . . 109 Figure 19 The Rejection mechanism with the PCM-MAJ rule ... 111 Figure 20 Three different schemes for selection and combining classifiers:
(a) static ensemble selection; (b) dynamic classifier selection; (c) proposed dynamic ensemble selection. The solid line indicates a static process carried out only once for all patterns, and the dash lines indicate dynamic process repeated each time for a different
test pattern . . . 118 Figure 21 The KNORA-ELIMINATE only uses classifiers that correctly
classify all the K-nearest patterns. On the left side, test pattern is shown as a hexagon, validation data points are shown as circles and the 5 nearest validation points are darkened. On the right side, the used classifiers -the intersection of correct
Figure 22 The KNORA-UNION uses classifiers that correctly classify any ofthe K-nearest patterns. On the left side, test pattern is shown as a hexagon, validation data points are shown as circles, and the 5 nearest validation points are darkened. On the right side, the used
classifiers -the union of correct classifiers- are darkened ... 122 Figure 23 The performances of proposed dynarnic ensemble selection
schemes based on different neighborhood sizes 1 ~ k ~ 30 on NIST SD19 database. In the figure KNORA-ELIMINATE overlaps with KNORA-ELIMINATE-W, and KNORA-UNION
overlaps with KNORA-UNION-W ... 132 Figure 24 The performances of various ensemble selection schemes based
on different neighborhood sizes 1 ~ k ~ 30 on NIST SD 19
database. In the figure OLA overlaps with a priori selection ... 134 Figure 25 The performances of proposed dynarnic ensemble selection
schemes based on different validation sample sizes from 1000 to 10000 on NIST SD19 database. The best performances from neighborhood sizes 1 ~ k ~ 30 are shown. The classifier pool size is 100. In the figure KNORA-ELIMINATE overlaps with KNORA-ELIMINATE-W, and KNORA-UNION overlaps with
KNORA-UNION-W ... 135 Figure 26 The performances of various ensemble selection schemes based
on different validation sample sizes from 1000 to 10000 on NIST SD 19 database. The best performances from neighborhood sizes 1 ~ k ~ 30 are shown. The classifier pool size is 100. In the figure OLA overlaps with a priori selection, and LCA overlaps
with a posteriori selection . . . 136 Figure 27 The relationship between selected ensemble size and
neighborhood size on different validation sarnple sizes from 1000 to 10000 on NIST SD19 database for KNORA-ELIMINATE. The
classifier pool size is 100 ... 137 Figure 28 The
relationship between selected ensemble size and neighborhood size on different validation sample sizes from 1000 to 10000 on NIST SD19 database for KNORA-UNION. The classifier pool
Figure 29 The performances of proposed dynamic ensemble selection schemes based on different classifier pool sizes from 10 to 100 on NIST SD 19 database. The best performances from neighborhood sizes 1 ::; k ::; 30 are shawn. The validation sample size is 10000. In the figure KNORA-ELIMINATE overlaps with KNORA-ELIMINATE-W, and KNORA-UNION overlaps with
xvii
KNORA-UNION-W ... 139 Figure 30 The performances of various ensemble selection schemes based
on different classifier pool sizes from 10 to 100 on NIST SD19 database. The best performances from neighborhood sizes 1 ::;
k ::; 30 are shawn. The validation sample size is 10000. In the
figure OLA overlaps with a priori selection, and LCA overlaps
with a posteriori selection . . . 140 Figure 31 The relationship between selected ensemble size
and neighborhood size on different classifier pool sizes from 10 to 100 on NIST SD19 database for KNORA-ELIMINATE. The
validation sample size is 10000 ... 141 Figure 32 The relationship between selected ensemble size
and neighborhood size on different classifier pool sizes from 10 to 100 on NIST SD19 database for KNORA-UNION The validation
sample size is 10000 ... 142 Figure 33 The proposed classifier-free ensemble selection scheme is, in
fact, a feature subset selection in Random Subspaces. We carried out this feature subset selection using clustering diversity as objective function. Note that the pre-calculation of diversities is carried out once for ali, while GA or MOGA search are repeated
from generation to generation ... 148 Figure 34 Illustration of 2 clustering partitions. The first clustering
generates 2 partitions and the second clustering generates 3 partitions. . . 151 Figure 35 The 2 partitions of the first clustering can be denoted as (M1k and
M2k), and those of the second clustering can be denoted as (Mi1,
Miz and Mi3). Ali data points are classified into Mik based on
these partitions ... 152 Figure 36 Examples of the calculation of C11 ,
C
00 , C10 , C01 based on 4 dataFigure 37 The processing steps of the proposed classifier-free ensemble selection method. The selected ensembles of feature subsets can be used to train ensembles of classifiers. These ensembles must be tested in a validation set in arder to select the best ensemble.
The detailed part of "feature subset selection" is shawn on Fig. 33 ... 156 Figure 38 The archive validation set is used to validate the population found
by GA or MOGA and then stores the best solutions in a separate archive 160 Figure 39 The average recognition rates achieved by EoCs selected by
modified clustering diversities with the single GA, compared with Mean Classifier Error (ME), Majority Voting Error (MVE), and
the ensemble of aU ( 1 00) knn classifiers . . . 173 Figure 40 The evaluated population (diamonds) and and selected solution
(the circle) based on the single GA search with Mirkin's Metric as the objective function. The number of selected feature subsets is shawn to illustrate the process of the convergence into the
minimum feature subset size ... 174 Figure 41 Box plot of the classifier-free ensemble selection schemes using
MOGA compared with the classifier-based ensemble selection using Mean Error (ME) and Majority Voting Error (MVE) as
objective functions ... 176 Figure 42 The pareto front of the MOGA search for the
classifier-free ensemble selection scheme. The evaluated population ( diamonds ), the population in the pareto front ( circles) and the validated solution (crosses) based on the MOGA search with Mirkin's Metric and the number of selected feature subsets the objective functions. The best performance evaluated on the
validation set is shawn in the text boxes . . . 177 Figure 43 The validated recognition rates of individuals on pareto front.
E.S. =Ensemble Size; V.R.R. =Validation Recognition Rate in percents 178 Figure 44 The data points in different feature subspaces. There are 3 classes
and the feature dimension is 6 ... 212 Figure 45 The relationships between DM and 3 approximations: E(2C),
Figure 46 In a two class problem, with class x and class y, each class can form multiple clusters. For classifier Di, Nxx
+
Nxy samples are classified as class x and clustered into Mxo clusters, andNyx
+
Nyy samples are classified as class y and clustered intoMyo clusters; for classifier Dk, Nxx
+
Nyx samples are classified as class x and clustered into Mox clusters, and Nxy+
Nyy samplesXl X
are classified as class y and clustered into Moy clusters ... 222 Figure 47 Assuming each class can form multiple clusters, we hope to
derive the relation between the clustering diversity and the classifier diversity. We show an example of how to calculate C10 : For 4 partitions, 6 different relationships must be considered and
ABS ALL-HMM BKS CDF CDF-CFD CDF-COR CDF-DF CDF-DIFF CD F-EN CDF-GD CDF-INT CDF-KW CDF-Q CFD COL-HMM COR DB DF Absolute Optima
Ensemble of bath Column and Row Hidden Markov Madel Classifiers Behavior Knowledge Space
Compound Diversity Function
Compound Diversity Function using Coïncident Failure Diversity Compound Diversity Function using Correlation Coefficient Compound Diversity Function using Double Fault
Compound Diversity Function using Difficulty Measure Compound Diversity Function using Entropy Measure Compound Diversity Function using Generalized Diversity Compound Diversity Function using Interrater Agreement Compound Diversity Function using Kohavi-Wolpert Variance Compound Diversity Function using Q-Statistics
Coïncident Failure Diversity
Ensemble of Column Hidden Markov Madel Classifiers Correlation Coefficient
Davies-Bouldin Index Double Fault
DIFF DM
ose
DT EN EoC EoHMM E(2C) E(MC) E(VI) GA GD HMM INT KNORA KNN KNP KW XXI Difficulty Measure Disagreement Measure Dempster-Shafer Combination Decision Template Entropy Measure Ensemble of ClassifiersEnsemble of Hidden Markov Madel Classifiers
Approximation of Disagreement Measure from Mirkin's Metric based on 2-Clusters Hypothesis
Approximation of Disagreement Measure from Mirkin's Metric based on Multi-Clusters Hypothesis
Approximation of Disagreement Measure from Mirkin's Metric based on the Variation of Information Hypothesis
Genetic Algorithm Generalized Diversity Hidden Markov Madel Interrater Agreement K-Nearest Oracles K-Nearest Neighbors K-Nearest Prototypes Kohavi-Wolpert Variance
LCA LDC MAX MAJ MCS ME MiN MLP MOGA MSE MSE(2) MSE(L) MVE NB NBC NIST SD NNC NSGA2 OLA PBM
Local Class Accuracy
Normal Densities Based Linear Classifier Maximum Rule for classifier combination Majority Voting Rule for classifier combination Multiple Classifier System
Mean Error
Minimum Rule for classifier combination Multi-layer Perceptrons
Multi-Objective Genetic Algorithm Mean Square Error
Mean Square Error for 2 Classifiers Mean Square Error for L Classifiers Majority Voting Error
Naive Bayes for classifier combination Naive Bayes Classifier
NIST Scientific and Technical Databases
Neural Network Classifier with Back-propagation Elitist Non-Dorninated Sorting Genetic Algorithm. Overall Local Accuracy
PFM PFM-DIV PFM-IRR PFM-P PFM-MAX PFM-MAJ PFM-MIN PFM-SUM PFM-PRO PPFM PRO PWC Q QDC REL RBN RMSSTD ROW-HMM RS xxiii
Pairwise Fusion Matrix
Pairwise Fusion Matrix weighted by Diversity of Classifier-Pair
Pairwise Fusion Matrix weighted by lndividual Classifier Recognition Rate
Pairwise Fusion Matrix weighted by Class Probabilities Pairwise Fusion Matrix applying Maximum Rule Pairwise Fusion Matrix applying Majority Voting Rule Pairwise Fusion Matrix applying Minimum Rule Pairwise Fusion Matrix applying Sum Rule Pairwise Fusion Matrix applying Product Rule Probability-Based Pairwise Fusion Matrix Product Rule for classifier combination Parzen Windows Classifier
Q-Statistics
Quadratic Discriminant Classifier Relative Optima
Radial Basis Neural Network Classifier Root-Mean-Square Standard Deviation Index Ensemble of Row Hidden Markov Model Classifiers R-Squared Index
ss
SUM SVM UCI WER W-MAJ XB Sum of SquaresSum Rule for classifier combination Support Vector Machine
UCI Machine Learning Repository (University of Califomia, Irvine) Wemecke's Method for classifier combination
Weighted Majority Voting Rule for classifier combination Xie-Beni Index
Cao
c( i)
c(i)r
DLIST OF SYMBOLS
Recognition rate of classifier f(i)
Ambiguity between classifier f(i) and classifier f(j) Average bias
Coefficient of classifier f( i)
Cluster center of ali data points Average covariance
Cluster centroid for cluster ci
The number of data point pairs that are in different clusters under both clustering
ci
and clusteringck
The number of data point pairs that are in the same cluster under both clustering
ci
and clusteringck
The number of data point pairs that are in the same cluster under clus-tering Ci, but not clustering Ck
The number of data point pairs that are in the same cluster under clus-tering Ck, but not clustering Ci
The number of samples belonging to cluster ci The class label output from classifier
f (
i)The number of classifiers voting for class i in a T -class problem Data Observation
Inter-cluster measure Average diversity
Dissimilarity between cluster ci and cluster ci
d· J Distance between the test sample and the training sample xi
Diversity between classifier
f (
i)
and classifierf
(j) Distance between cluster e; and cluster ciMinimum Inter-cluster distance
diam(ci) Diameter of cluster ci
div(!( i) ,f(j)) Diversity between classifier f( i) and classifier f(j)
-divamb -div sim E(yjx) f(x, D) fens g(llx)Compound diversity function for diversity measures that represent am-biguity between classifiers
Compound diversity function for diversity measures that represent sim-ilarity between classifiers
Estimated probability of a pattern x belonging to class y
Fowlkes-Mallows Index of clustering Ci and clustering
Ck
Probability estimated by a classifier
f
trained with dataset D of a pattern x belonging to an indicated classProbability estimated by an ensemble of classifiers trained with dataset D of a pattern x belonging to an indicated class
Classifier
f (
i) trained with dataset DiJ(Ci, Ck)
Im(U,V)
M m(T) N n(c(i), c(j)) ne0
P(ljc(i), x) xxviiJacard Index of clustering Ci and clustering Ck
Sum of the squared error with the partition matrix U and the set of cluster centroids V
Mirkin's Metric of clustering Ci and clustering Ck
The number of classifiers in an ensemble Class label
Class label selected among ali classes The total number of classifiers in a pool
The black of a contingency table with column-i and row-k
The number of correct classifiers exceeding the threshold of being ma-jority
The value of a contingency table at the black column-i and row-k The number of samples
The number of samples on which classifier
f(i)
votes on class c(i) and classifierf
(j) votes on class c(j)The number of samples in cluster ci The number of clusters
Complexity
Probability of a pattern x belonging to class l when the classifier
f (
i)P(ljc(i),
c(j), x) Probability of a pattern x
belonging to class l when the classifier f(i)votes on class c( i) and the classifier
f
(j) votes on class c(j)P(ljc(l),··· ,c(i),···
,c(L),x)
P(yjx) p Pi R(J(i)) p(T) T t u·. >,]Probability of a pattern x belonging to class l when classifier
f (
1) votes on class c(l), classifier f( i) votes on class c( i), and classifier f(L) votes on class c(L), etc
Probability of a pattern x belonging to class y
Significance value
Classification accuracy of classifier
f (
i)Rand Index of clustering Ci and clustering Ck
Individual classifier recognition rate of classifier f(i)
Ratio of within-cluster scatter to between-cluster separation Variance of cluster ci
Sum of squares between clusters Total Sum of Squares
Sum of squares within clusters
Threshold of the majority voting in a T -class problem The number of classes
Class label
Membership value in a partition matrix between cluster ci and cluster Cj
XXIX
Cluster centroid of cluster ci
First Wallace Index of clustering Ci and clustering Ck
Second Wallace Index of clustering Ci and clustering Ck
Weight of classifier
f(i)
x
A set of samples; a set of data pointsCluster center; centroid Mean of the cluster ci
Sample in cluster Cx x Pattern sample; data point
y Class label
1.1 Background: Ensemble of Classifiers
Pattern recognition is a task which enables machines to recognize different patterns. In general, patterns with known labels (or classes) are used to train agents called classifiers. Once these classifiers have been trained, they can classify new patterns with unknown labels into certain classes, and thus recognize those patterns. In other words, classifiers are designed to find the relationship between pattern features and pattern labels.
There are various types of classification algorithms for classifiers, such as multi-layer per-ceptrons (MLP), hidden markov models (HMM), k-nearest neighbors (KNN) and support vector machines (SVM), among others. Due to the complexity of a problem, the feature dimension, the class dimension and the number of training samples available, sorne clas-sification algorithms might perform better than others. When we consider selecting an adequate classification algorithm for a particular problem, the basic objective is twofold: To enhance accuracy to the fullest extent possible, and to reduce classifier training time as much as possible.
There are several ways to improve the accuracies of these classification algorithms. One is to use more than one classifier to carry out the pattern recognition tasks, and this is called a multiple classifier system (MCS) or an ensemble of classifiers (EoC). An MCS or an EoC aims to enhance recognition rates by employing multiple classifiers, rather than by improving the accuracy of a single classifier. It bas been shown theoretically and experimentally that by combining the outputs of multiple classifiers we can achieve a better recognition rate (11; 56; 66; 77; 81; 103; 111).
2
Nevertheless, to create an EoC, we are still faced with severa! problems: How can we generate multiple classifiers? Then, once these classifiers have been generated, should we use ali of them or should we select a sub-group of them? If we decide to select a sub-group, how do we go about it? Then, once the sub-group has been selected, how can we combine the outputs of these classifiers?
These problems have been investigated in the literature, and we present the state of the art in the next section.
1.2 State-of-the-Art of the Methodology
1.2.1 Ensemble Generation
There are severa! systematic methods for generating multiple classifiers which are cur-rently popular. The idea is to use different datasets to train classifiers, so that these classi-fiers will behave differently. This gives us multiple diverse classiclassi-fiers. We describe sorne basic ensemble generation methods below.
We can use different examples to train classifiers. Supposing we have a large database, for example, if we randomly select only two-thirds of the data points to train a classifier, very likely each classifier will have diverse training samples and thus behave differently. This ensemble generation method is calied Bagging (63).
In arder to generate different datasets for multiple classifier training more efficiently, we can also select the training samples in a more systematic manner. For example, we can set a probability for each training sample, and we select only two-thirds of ali the samples. If a sample has a higher selection probability, then it is more likely to be selected to train classifiers. However, once we train a classifier, we check whether or not this classifier can correctly classify a particular sample. If a sample is correctly classified, it is assigned a lower selection probability. By contrast, if it is wrongly classified, it is assigned a higher
selection probability. We repeat this process for all the samples, which will have the effect of adjusting the selection probability of each sample. In this way, we can focus on more difficult samples. This ensemble generation method is called Boosting (31; 90).
We can also use all the samples, but only a part of their features, to train classifiers. Sup-posing that the data have a large feature dimension, we can only use a portion of its features to train classifiers. For example, if ali the samples have 20 features, we may use differ-ent 5 features to train each classifier. This ensemble generation method is called Random Subspaces ( 49), and the size of the feature subspace is called its cardinality.
In general, once the classifiers have been generated, we need to collect the best of them in a sub-group. We discuss the process of selection in the next section.
1.2.2 Ensemble Selection
Not ali the classifiers generated will be helpful for obtaining the best pattern recognition result. Sorne might have relatively low accuracy, and others rnight be identical and thus not very useful. For this reason, we need to select the best classifiers from the pool and form a sub-group of them. This selection process is called ensemble selection, because we select certain classifiers to construct an EoC. In general, we select one ensemble for all test patterns, which is referred to as static ensemble selection.
One way to perform static ensemble selection is to make use of the diversity among clas-sifiers ( 11; 66; 80; 89). Diversity is important, because if ali clasclas-sifiers are the same, we cannot improve the pattern recognition results by combining them. In other words, they must give quite different outputs. Based on this concept, we can simp1y define a diversity of classifiers and then evaluate different EoCs by measuring their diversities. Finally, we select the EoC with the best diversity.
Another way to do this is to use the classifier combination results directly (5; 61; 89; 101). We select EoCs, combine their outputs and measure their recognition rates on an
4
independent validation dataset. If a particular EoC achieves the best recognition rates on this validation dataset, then we suppose that it will also be the best on the test dataset.
It bas been demonstrated that the measure of the recognition results of EoCs is more reliable than the measure of their diversity (63; 66; 89). However, the fact that we use the recognition results for ensemble selection means that we must know how to combine classifiers before we select them. The problem is that, in general, we do not know the best way to combine these classifiers. Since classifier combination is not optimized, we doubt that ensemble selection based on one classifier combination method will be optimal.
Another interesting approach is to measure classifier accuracy based on the features of a sample, and select a single classifier with the best accuracy for this sample. This means that each sample canuse different classifiers. This approach is known as dynamic classifier selection (12; 15; 14; 28; 44; 65; 107). Moreover, since only one classifier would be used for each sample, there is no need to proceed with classifier combination.
If we perform static ensemble selection, we need to combine the outputs of these classi-fiers. We present sorne known methods for classifier combination in the next section.
1.2.3 Classifier Combination
After an EoC bas been selected, we need to combine the classifiers in the ensemble, and this process is called classifier combination. Many methods can be used to combine the outputs of classifiers (50; 56; 69; 81; 89; 92; 96; 1 04; 109; 111 ), and these are called fusion functions. In general, there are two types of fusion function: one which only requires the crisp class label outputs (for example, this sample belongs to class A, that sample belongs to class B), and the other which requires the probability outputs for each class (for example, this sample bas a 90% probability of belonging to class A, and a 10% probability of belonging to class B).
For fusion functions which use the probability outputs for each class, we can simply com-bine their outputs by summing the probabilities for each class from ali classifiers (the SUM rule), or we can combine their outputs by multiplying the probabilities for each class from all classifiers (the PRODUCT rule). We can also simply choose the class label with the maximum probability, either by referring to the maximum probability from ali classifiers (the MAX rule) or by referring to the minimum probability from ali classifiers (the MIN rule) (50; 56; 69; 81; 89; 92; 96; 104; 109; 111).
For fusion functions which use only the crisp class label outputs, the options are some-what lirnited. The simplest way to combine them is to use the majority voting rule: each classifier has a vote on a sample, and the class that obtains the most votes wins (the MAJ rule).
Besides these simple fusion functions, there are a number of trained fusion functions that use another independent database to make up the combination rules, such as the Behavior-Knowledge Space (BKS), the Decision Template (DT), Naïve Bayes (NB) (50; 69; 92; 104), etc. These will be discussed later in this thesis, following a short discussion on sorne of the potential problems and drawbacks of the current methods for ensemble creation, ensemble selection and classifier combination.
1.3 Problem Statement
Although there are a number of useful methods proposed in the literature for ensemble cre-ation, ensemble selection and classifier combincre-ation, our understanding of the ensemble remains lirnited. Below are sorne of the limitations and potential disadvantages of current methods:
• Ensemble Generation
In general, ensemble generation methods use a part of data subset to train classifiers, however:
6
a. The Random Subspaces method requires a minimum number of features, and is therefore only adequate for problems with high feature dimension.
b. If the number of available samples is small, then Bagging or Boosting might encounter "the dimensional curse" for classifier training.
c. The reduction of features or training samples might not be desirable for sorne complex classification algorithms.
• Ensemble Selection
In order to select the best ensemble from a classifier pool, different objective func-tions have been proposed :
a. The use of diversity for ensemble selection does not perform weiL
b. In order to use a fusion function (such as majority voting error) for ensemble selection, we should first define it, and there is no guarantee that the fusion function chosen will be optimal for the problem at band.
c. The ensemble selection process is mainly static; that is, we select one ensem-ble for all test patterns. Again, this is sub-optimal.
d. Dynamic classifier selection does not consider the use of the ensemble, which might further boost its performance and stability.
e. In order to carry out ensemble selection, we need to train classifiers. Since not ail the classifiers trained will be used, the time spent for additional classifier training is wasted.
f. If the size of classifier pool is large, th en ensemble selection occurs in a large search space. This is particularly time-consuming.
• Classifier Combination
Once an ensemble has been selected, we need a fusion function to combine its clas-sifiers :
a. Most simple fusion functions require the class probability outputs from the classifiers, which are not adequate for classifiers with only class label outputs. b. Most trained fusion functions will require a significant number of training
samples. This causes problems for small data.
c. Sorne trained fusion functions, such as BKS, can be applied only for problems with small class dimensions.
As we can see from the problems described above, there is still much room for improve-ment and innovation in the field of EoC. The objective of our work is to propose applicable methods with a view resolving, at least partly, sorne of these problems. We remind read-ers, however, that EoC optimization is a very complex issue. It is related to a number of varied processes, and our contribution constitutes only part of an improved understanding of the use of EoCs.
1.4 Objectives and Contributions
We propose three new methods for ensemble selection for different contexts, a new ensem-ble creation scheme for HMMs and a new classifier combination method for classifiers. Our objective is to partly resolve sorne of the difficulties associated with EoCs presented in the previous section. It is important to mention that we do not assume that these methods are the best choices for all problems, since the best method is usually problem-dependent, given that the most adequate ensemble method often depends on the feature dimension and
8
the features of the classes and classifiers, on data size, on problem complexity and on the choice of classification algorithm. We offer alternative ways to employ an EoC system, rather than to achieve an optimization of all factors involved in EoC selection, which is nearly impossible. The methods we propose make the following contributions:
• Ensemble Generation:
We propose an ensemble generation method that does not require using data subset forHMMs:
a. Ensemble of HMM classifiers based on the Clustering Validity Index.
Besides the traditional Bagging, Boosting and Random Subspaces ensemble creation methods, we propose a new ensemble creation method for HMMs. In general, HMMs need sufficient samples for training to enable them to per-form weiL But the fact that these ensemble creation methods use only data subsets could cause problems for HMM training. We thus propose a method for creating an ensemble of HMMs which not only employs all data points and ali features, but also offers diversity among classifiers.
• Ensemble Selection:
We make three major contributions conceming ensemble selection:
a. Compound Diversity Functions for Ensemble Selection.
Our first contribution is to combine diversity and classifier accuracy for en-semble selection. This is a more general enen-semble selection method, and is not based on any one classifier combination method. We will show that this method has a strong theoretical basis and performs better than the tra-ditional ensemble selection based on diversity among classifiers. Moreover,