HAL Id: insu-02991691
https://hal-insu.archives-ouvertes.fr/insu-02991691
Submitted on 6 Nov 2020HAL is a multi-disciplinary open access
archive for the deposit and dissemination of sci-entific research documents, whether they are pub-lished or not. The documents may come from teaching and research institutions in France or abroad, or from public or private research centers.
L’archive ouverte pluridisciplinaire HAL, est destinée au dépôt et à la diffusion de documents scientifiques de niveau recherche, publiés ou non, émanant des établissements d’enseignement et de recherche français ou étrangers, des laboratoires publics ou privés.
Distributed under a Creative Commons Attribution| 4.0 International License
The Impact of Thermal History on Water Adsorption in
a Synthetic Nanolayered Silicate with Intercalated Li +
or Na +
L. Michels, C. da Fonseca, Yves Méheust, M. Altoé, E. dos Santos, G. Grassi,
R. Droppa, K. Knudsen, L. Cavalcanti, K. Hunvik, et al.
To cite this version:
L. Michels, C. da Fonseca, Yves Méheust, M. Altoé, E. dos Santos, et al.. The Impact of Ther-mal History on Water Adsorption in a Synthetic Nanolayered Silicate with Intercalated Li + or Na +. Journal of Physical Chemistry C, American Chemical Society, 2020, 124 (45), pp.24690-24703. �10.1021/acs.jpcc.0c05847�. �insu-02991691�
The Impact of Thermal History on Water Adsorption in a Synthetic
Nanolayered Silicate with Intercalated Li
+
or Na
+
L. Michels,
*
C. L. S. da Fonseca, Y. Me
́heust, M. A. S. Altoé, E. C. dos Santos, G. Grassi, R. Droppa, Jr.,
K. D. Knudsen, L. P. Cavalcanti, K. W. B. Hunvik, J. O. Fossum,
*
G. J. da Silva, and H. N. Bordallo
Cite This:https://dx.doi.org/10.1021/acs.jpcc.0c05847 Read Online
ACCESS
Metrics & More Article RecommendationsABSTRACT: For applications benefitting from the swelling properties of nanolayered silicates (clay minerals), it is of paramount importance to understand the hysteresis in the clay−water interaction. In this context, the present work investigates how the thermal history of Na+- and Li+-intercalatedfluorohectorite affects the hydration process. By combining X-ray diffraction and thermogravimetric analysis, water adsorption of preheated and non-preheated fluorohectorite was measured and analyzed in terms of the characteristic interlayer distance. The number of water molecules per cation was also inferred. We find that some of the hydration states in preheated samples are suppressed, and transitions to higher hydration states are achieved at higher relative humidity values. This could be due to the initial water content that facilities crystalline swelling. However, the data for Li-fluorohectorite do not exclude the possibility of a low temperature Hofmann−Klemen effect at 150 °C. Our study also provides strong hints that the so-called 1.5 water layer state, observed in previous studies on smectites, is a metastable state. In addition, the impact of a hydrogenous structure in the interlayer space of Li-fluorohectorite on the clay’s hydration behavior is demonstrated. The
results, if generalized, would have strong implications on a wide range of applications, where the thermal history of smectites is important.
1. INTRODUCTION
Nanolayered silicates or clay minerals, one of the most abundant materials in nature, are used in a large spectrum of products and applications, in particular as a confinement material for nuclear waste in subsurface storage,1as cap rocks in the framework of carbon dioxide storage2−7 in deep aquifers and depleted oil reservoirs and subsurface methane storage,4,8−10 as carrier material for drug delivery,11−15 or to trap heavy metals in the context of soil remediation.16−18 Like all 2:1 phyllosilicates, synthetic fluorohectorite (FHt) is composed of layers of thickness≈ 0.97 nm, which consist of two SiO4 tetrahedral sheets connected by a Mg6‑xLix octahedral sheet. Due to the charge substitution (quantified by x) in the sheets, these layers have a structural net negative charge, which is compensated by interlayer cations of different types, in the present study Li+ or Na+. These cations link adjacent layers to each other, creating an ordered lamellar structure of layers separated by cations; this structure is what is commonly referred to as a clay mineral particle.
One of the main reasons for the widespread use of clay minerals is their low permeability and ability to swell, which is most commonly associated with their interaction with water. At the macroscopic scale, clay swelling may be seen as an apparent increase in volume. However, the swelling phenomenon is a multiscale process,19 which can be
described by observing changes in both the interparticle mesoporous space and the interlayer nanospace20within clay particles. In the latter case at low water content, crystalline swelling is a stepwise expansion resulting from the con fine-ment of water molecules in the interlayer space. This adsorbed water is structured in a molecular packing that has thermodynamically favored configurations corresponding to different hydration states, commonly denoted as water layers (WLs). Dehydrated (0WL), monohydrated (1WL), bihydrated (2WL), trihydrated (3WL) states,21,22and 4WL23 are observed, depending on the type of swelling clay. They correspond to basal spacing of approximately ∼1.0, ∼1.2, ∼1.5, ∼1.8, and ∼1.9 nm, respectively. Water intercalation in swelling clays (also called smectites) is strongly dependent on the nature of the interlayer cation, the layer’s structural charge, temperature, and the surrounding water state (liquid or vapor, and the level of vapor relative humidity). The interlayer cation plays an important role in the water
Received: June 26, 2020 Revised: September 25, 2020
Article pubs.acs.org/JPCC
© XXXX American Chemical Society
A
https://dx.doi.org/10.1021/acs.jpcc.0c05847
J. Phys. Chem. C XXXX, XXX, XXX−XXX
License, which permits unrestricted use, distribution and reproduction in any medium, provided the author and source are cited.
Downloaded via 91.161.104.125 on November 6, 2020 at 08:50:22 (UTC).
adsorption process,24,25since water can form different H2O− cation complexes depending on the intrinsic charge and ionic radius of the cation, which can significantly change the water adsorption properties. An increase in the layer charge will result in an increase in the number of interlayer cations, but this can also cause a decrease in the interlayer distance and consequently can make the clay material more hydro-phobic.26,27 Additionally, it is well established that the dissimilarities in H2O uptake and loss between different smectites are related to the manner in which the intercalated cation changes the H-bond network around H2O mole-cules.28,29
Several methods have been employed to study the multiscale process of clay swelling. For instance, X-ray diffraction (XRD) provides a direct measurement of the interlayer distance as a function of water content from the measurement of the angular positions of Bragg reflections, and valuable information (basal spacing, crystallite size, and induced lattice strain) about the water adsorption process can be readily obtained30−35 from peak shape evaluation and comparison with data modeling. In addition, quasi-elastic neutron scattering (QENS),28,36,37 nuclear magnetic reso-nance (NMR),8,38−42 infrared spectroscopy (IR),43−45 and computer simulations24,46−52 provide valuable insights on water mobility, such as the diffusion coefficient in the interlayer, proton exchange dynamics, cation mobility, etc.
For clay swelling related applications, it is of paramount importance to understand how the interaction between water and clay minerals results in hysteresis in the adsorption process, since in nature or in industrial processes, these materials are rarely found without water. Consequently, over the years, several studies have been dedicated to better understanding this phenomenon.42,53The explanations range from structural rearrangements in the clay,54 which changes the water diffusion coefficient,28,29,52,55 to changes in the layers during swelling or shrinkage, which is attributed to a phase transition between hydration states.56,57 Hsiao and Hedström47 concluded that processes occurring outside of the interlayer structure must be considered since traces of hysteresis in the interlayer space could not be found, while Gates et al.58 performed an in situ QENS experiment and found that rehydrated clay adsorbs less water, thus confirming that water adsorption is hysteretic.
Synthetic fluorohectorites generally have a surface charge that is proportional to the number of Li+ ions that substitute Mg2+ ions in the center of the octahedral layers.21
FHt’s advantage over laponite is due to its surface charge and particle sizes. This material has been used to expand various studies (hydration and phase diagrams of suspensions) to configurations not available to laponite when it comes to aspect ratio, charge range, and layer−platelet size.59,60Using this clay mineral, it was previously demonstrated that thermal treatment of Ni-fluorohectorite (NiFHt) greatly influences its hydration pathway,61 in accordance with the general assumption that sample history is an important factor in hydration. Additionally, our recent QENS−thermal analysis29 clearly demonstrates the presence of an interlayer species that decreases the mobility of interlayer water. This result is in accordance with the subdiffusive behavior of water vapor transport in LiFHt powders.62 In the present work, we investigate the impact of thermal treatment on the hydration of Na-fluorohectorite (NaFHt) and Li-fluorohectorite (LiFHt), with nominal chemical formula of Mx-[Mg6‑xLix]
-Si8O20F4, where x = 1.2 and M represents the interlayer cation. XRD was used to quantify the effect of sample preparation by measuring the interlayer displacement from the (001) Bragg reflection as a function of relative humidity (RH), controlled by a humidity chamber between 0 and 100%. The number of water molecules per cation was then quantified from the thermal analysis, and the hysteresis due to temperature treatment and rehydration was analyzed. This work demonstrates that heat treatment and rehydration introduce significant differences in the sample behavior in terms of crystallinity and amount of water adsorbed, a result that can have important implications for the design of clay-based sorbents or confinement materials.
2. MATERIALS AND METHODS
2.1. Sample Preparation. LiFHt was purchased from Corning Inc. and used without further purification, while NaFHt was obtained from LiFHt through a cation exchange procedure.63,64The cation exchange consists in mixing LiFHt and a sufficiently large amount of NaCl in a water solution, collecting the powder after centrifuging, andfinally removing excess Li+, Na+, and Cl− ions by washing and rinsing the powders with deionized water in a standard dialysis process. Aiming to study the influence of sample treatment on the H2O adsorption, we separated each sample batch in two sets, which were placed individually inside a sample cell, as shown inFigure 1. The cell consists of a closed cylinder chamber in which the temperature and the mixing of humid and dry gases can be controlled accurately; two Kapton windows allow X-rays to penetrate and exit the cell with little interaction other than the scattering by the clay sample.
Figure 1. (a) Sketch of the sample cell, where the humidity and temperature are controlled near the powder sample. (b) Angular distribution of the X-rays scattered by the isotropic clay powder, recorded on a 2D detector. (c) Azimuthal integration of the 2D diffractogram provides the intensity as a function of the scattering vector, with Bragg reflections. (d) q position of the (001) Bragg reflection provides the average interlayer distance (d001) of the clay
sample in the scattering volume.
https://dx.doi.org/10.1021/acs.jpcc.0c05847
J. Phys. Chem. C XXXX, XXX, XXX−XXX
We used two different sample conditions: the clay sample set, hereafter called non-preheated, was dried under a N2 atmosphere at room temperature, while the other, hereafter referred to as preheated, was dried under a N2atmosphere at 150°C. This treatment was done for 8 h before exposing the samples to different values of RH. This procedure is analogous to the one used in our previous study of Ni-fluorohectorite.61
2.2. Control of Relative Humidity. All subsequent measurements were performed at room temperature while controlling the relative humidity (RH) through regulation of a N2 flux into the sample chamber. The N2 gas line was separated in two branches before reaching the chamber: one passing through a water container, where N2 was saturated with water vapor, and the other conducting the dry N2 gas directly to the chamber. Both channels had flowmeters installed in their respectiveflow paths for accurate control of the applied RH, with suitable reproducibility.Figure 1shows a sketch of this setup. This is a custom-made setup, which was also used and described in detail in the references.61,65
Prior to thermal gravimetric analysis (TGA) measurements, the samples were prepared inside desiccators whose atmosphere was in contact with a water solution saturated with either NaCl or K2SO4salts, with a RH value of∼75 and ∼95%, respectively. Samples equilibrated at lab room humidity equal to RH ≈ 37%, monitored by two relative humidity sensors, were also collected. In this case, the samples were kept in an open recipient inside the lab until they reached equilibrium. After the samples were measured, the powders were placed inside the desiccators and left overnight (8 h) to rehydrate. These rehydrated samples allowed us to quantify the initial amount of H2O in the clay mineral layers as well as to describe different hydration states. This procedure was also used in refs 29, 45, 61.
2.3. X-ray Diffraction Experiments. The non-preheated samples were measured with an in-house Bruker NanoSTAR X-ray scattering setup attached to a Xenocs X-ray source with a copper (Cu) anode. The preheated samples were measured in the XRD2 beamline at the Brazilian Synchrotron (LNLS) using radiation with λ = 0.154 nm and a 6-circle Huber goniometer.
The scattered X-ray intensities were recorded by a two-dimensional detector Pilatus (Dectris). The isotropic powder diffractograms were subsequently integrated over the azimuthal angle and plotted as a function of the scattering vector q (see Figure 1c):
π
λ θ
=
q 4 sin
(1)
where 2θ is the scattering angle. The positions and full width at half maximum (FWHM) of the deconvoluted Bragg reflections were obtained by fitting to a Voigt peak function:
∫
π = + × + − ‐ −∞ ∞ − −( ) (
)
I I A w w e t t 2ln 2 ln 2 2 ln2 d t w w q q w X ray bck 3/2 L G2 2 2 2 L G c G i k jjjj y{zzzz (2)where Ibck, A, wL, wG, qc denote the background, amplitude, Lorentzian width of the sample’s Bragg reflection, Gaussian width of the instrumental resolution function, and peak
position, respectively. The parameter A, which is considered constant over the (001) q range, contains factorial contributions that include the Lorentz polarization factor and the silicate layer factor.31 The Bragg reflection is a convolution of a Lorentzian (of width wL) with a Gaussian profile. The former is due to the sample’s contribution to the line width, while the latter results from the instrumental resolution. The instrument resolution was wG‑NTNU= 0.18 ± 0.02 nm−1 and wG‑LNLS = 0.014 ± 0.005 nm−1 for the in-house instrument and the XRD2 beamline at the LNLS, respectively.
In order to perform equilibrium measurements, the diffractogram corresponding to each RH step was recorded repeatedly until the Bragg reflection had stopped evolving. The equilibration time was between 1 and 2 h.
2.4. Thermogravimetric Analysis. TGA measurements were performed using a TG 209F1 LIBRA instrument from NETZSCH with a platinum top-opened crucible. The experimental conditions as recommended by the instrument manufacturer were as follows: a N2 atmosphere (N2 purge rate of 40 mL/min) and a heating rate of 10 °C·min−1. To correct mass change values, a baseline run is always carried out under identical measurement conditions, such as the heating rate, gas type, gas flow rate, crucible type and geometry, etc., and subtracted (automatically by the instru-ment software) from the sample measureinstru-ment. The baseline takes instrument and buoyancy influences into consideration. Two types of measurements were performed: One was to measure the mass loss as a function of the imposed temperature, which was changed between 25 and 150 °C at a heating rate of 10 °C/min, in order to obtain the temperature at which the H2O molecules desorb from the sample, and the other was to measure the evolution of the mass at a constant temperature. The samples were heated only up to 150 °C to avoid the layer charge reduction (Hofmann−Klemen effect).66,67 After the first measurement run, the samples were left to rehydrate (see section 2.2:
Control of relative humidity) for 8 h inside a chamber with controlled RH, and were subsequently remeasured. This allowed us to directly compare the relation between the initial H2O content and the XRD Bragg reflection position under dried conditions.
2.5. Hendricks−Teller Theory for Diffraction by Partially-Ordered Layer Lattices. In their seminal paper, Hendricks & Teller68 derive the formula for the X-ray intensity scattered by a layer lattice whose repetition distance between adjacent layers can take two distinct values d1 and d2, with a random spatial distribution of these two values across the lattice according to the respective probabilities f and 1− f. Considering the phase shifts ϕi= 4πdi sinθi/λ, (i = 1, 2), the scattered intensity is
θ θ θ θ ϕ θ θ ϕ ϕ ϕ ϕ = − [ ] − ̅ + [ ] = − ̅ + − − ̅ I F C C C C f f ( ) ( ) 1 ( ) 1 2 ( )cos( ) ( ) , with ( ) cos( ) (1 )cos( ) 2 2 1 2 (3)
where F(θ) is the form factor, and the mean phase shift ϕ̅ is defined by the following equation:
ϕ ϕ ϕ ϕ ϕ ̅ = + − + − f f f f
tan( ) sin( ) (1 )sin( ) cos( ) (1 )cos( )
1 2
1 2 (4)
The relations (eqs 3 and 4) can be rewritten as follows:
https://dx.doi.org/10.1021/acs.jpcc.0c05847
J. Phys. Chem. C XXXX, XXX, XXX−XXX
Figure 2.Diffraction peaks corresponding to the stable hydration states for (a, c) NaFHt and (b, d) LiFHt for samples subjected to different thermal treatments prior to the in situ hydration. Gray curves show intermediate states during the hydration transitions. The measurements marked with colored symbols are the stable peaks.
Table 1. Summary of the XRD Peak Positions for the Hydration States. The Uncertainties on the Peak Positions Are Less than 0.01 Nm−1a
dehydrated peak peak I peak II peak III peak IV
sample peak position (nm−1) RH (%) peak position (nm−1) RH (%) peak position (nm−1) RH (%) peak position (nm−1) RH (%) peak position (nm−1) RH (%) NaFHt 6.40 5.10 30 4.10 99 LiFHt 6.10 a 5.29 0 4.53 58 4.10 77 3.37 90
aCould only be measured in the preheated sample.
Figure 3.Evolution of the FWHM for NaFHt (a, c) and LiFHt (b, d) for different relative humidities. The peaks corresponding to the local minima of the FWHM are labeled as peak I to IV.
https://dx.doi.org/10.1021/acs.jpcc.0c05847
J. Phys. Chem. C XXXX, XXX, XXX−XXX
θ θ ϕ ϕ = − − − − − − ϕ ϕ ϕ ϕ − −
(
)
(
)
I F f f f f f f ( ) ( ) 2 (1 )sin1 cos( ) (1 )cos( ) 2 (1 )sin
2 2 1 1 2 2 1 2 1 2 Ä Ç ÅÅÅÅÅ ÅÅÅ É Ö ÑÑÑÑÑ ÑÑ (5)
which is the formula mostly found in the clay minerals literature. By expressing the half scattering angle θ as a function of the scattering vector q or structural length d, the scattered intensity can alternatively be expressed as a function of these parameters.
3. RESULTS
3.1. XRD Results. The expansion of the clay minerals resulting from intercalation of H2O molecules is directly measured from the change in position of the (001) Bragg reflection with the increasing values of relative humidity (RH), according to the relation d001= 2π/qc. As discussed in the Introduction, this intercalation of water molecules in the clay particles is strongly influenced by the type of interlayer species (cations, hydrogenous complexes, or impurities).
Figure 2 shows the evolution of the XRD patterns as a function of the scattering vector q when RH is changed stepwise from 0 to 100% in a quasi-static manner. Results are shown for NaFHt (Figure 2a,c) and LiFHt (Figure 2b,d), for samples subjected to different thermal treatments prior to the in situ hydration, i.e., preheated samples (Figure 2c,d) and non-preheated samples (Figure 2a,b). As the RH is increased, the scattering vector qc characteristic of the (001) Bragg reflection moves to a lower value. To identify the hydration states, the (001) Bragg reflections at different RH values are denoted respectively as the dehydrated peak and peaks I to IV. NaFHt exhibits only peaks I and II in addition to the dehydrated peak, whereas LiFHt exhibits four peaks, peaks I to IV. One should note that the only difference between these samples is the type of interlayer cation.
A well-defined dehydrated state could only be reached after preheating the samples. For non-preheated LiFHt, the X-ray spectra feature an additional transition for the highest humidity used (RH ≈ 96%), to the left of peak IV. This transition curve features two local maxima at qc≈ 3.33 nm−1 and qc ≈ 2.23 nm−1, cf. to the yellow curve in Figure 2b. Otherwise, the peak positions remain the same for the preheated samples as for the non-preheated ones, with the difference that peak IV does not appear for the preheated LiFHt sample. Table 1 shows a summary of the XRD peak positions for the pure hydration states.
To identify the hydration states, the FWHM of the (001) reflection peak, extracted by means ofeq 2, was evaluated for different RH levels. The results are shown inFigure 3. Such analysis is useful to determine stable hydration states in clay minerals.61 Indeed, stable hydration states are characterized by a smaller FWHM than for transition peaks, so they can be determined from the positions of the local minima in the plots of the FWHM for different RH values.
The amount of water layers (WL) corresponding to each indexed peak was inferred following the procedure used in ref
61, whereby the average H2O molecule diameter is taken to be approximately 0.27 nm (see Table 2).61 For NaFHt, the 1WL hydration state corresponds to peak I and the 2WL state to peak II. For LiFHt, the hydration states are 1WL for peak I, the so-called 1.5WL for peak II, 2WL for peak III, and 3WL for peak IV. The mixed state labeled as the transition peak in Figure 2b has a Bragg reflection growing
from the position of peak IV (3.37 nm‑1) to ∼2.25 nm‑1. Based on the corresponding interlayer distance, this latter component has approximately 5 water layers, which could be a transition from crystalline to osmotic swelling. To the best of our knowledge, this is thefirst time such a hydration state is observed experimentally in Li-intercalated clay minerals. Such a state has, however, been predicted by H2O adsorption simulations in Na-montmorillonite.69
Figure 4shows the evolution of the interlayer distance d001 as a function of the RH for the preheated and non-preheated NaFHt and LiFHt samples. In contrast to NiFHt,61 NaFHt and LiFHt show a step-like process, with transitions between the hydration states occurring within a narrow range of relative humidity values, a behavior which is also observed in natural smectites, such as montmorillonite,30 saponite,70 and vermiculite.17 However, in LiFHt, transitions from 1.5WL to 2WL occur more gradually (both for preheated and non-preheated samples). For the non-non-preheated NaFHt, inFigure 4, the sample is in the dehydrated 0WL state when exposed to a N2atmosphere at room temperature. At RH≈ 16%, the sample makes a transition to the 1WL state, and at RH ≈ 63%, the system goes from the 1WL to the 2WL state. For the preheated NaFHt, the 0WL to 1WL and 1WL to 2WL transitions occur, respectively, at RH≈ 25% and RH ≈ 94%. For LiFHt (seeFigure 4b), the dehydrated state 0WL could only be achieved by heating the sample to 150 °C. Consequently, for the non-preheated LiFHt sample, the hydration experiments start with the sample already in the 1WL state and the d-spacing increases continuously but at a low rate until RH ≈ 52%, where the system undergoes a transition to the 1.5WL state. At RH ≈ 62%, the sample reaches the 2WL state, and finally at RH ≈ 89%, the system moves to the 3WL state. For the preheated sample the 0WL to 1WL transition occurs at RH ≈ 1%, the 1WL to 1.5WL transition around RH≈ 74%, and the 1.5WL to 2WL around RH ≈ 88%. Hence, after thermal treatment, the transitions between the hydration states are shifted to higher RH values, both for NaFHt and LiFHt. One should also note that for each hydration state and for all samples, a continuous regime of the slow increase of d001is observed within a certain range of relative humidity, demonstrating that small water uptake inside the interlayers spaces causes texture rearrangement (changes in the crystallographic orientations) prior to the hydration transition.54,62,71 This property has been used in previous studies to infer local RH values from XRD measurements of d001.54,62,71
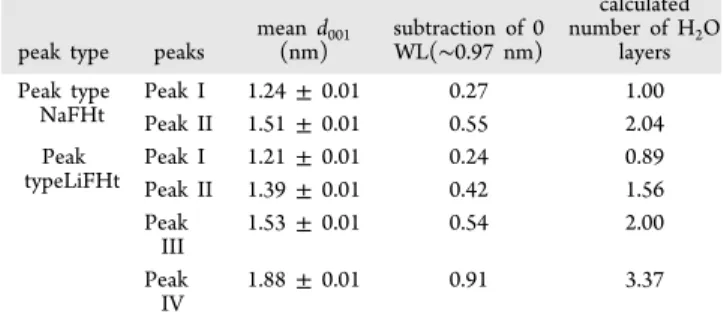
Table 2. Hydration States of LiFHt and NaFHt with Their Respective Mean Values ford001, as Inferred from the Experimental Data Shown in Figure 4, for Samples Prepared under Different Initial Conditions
peak type peaks
mean d001 (nm) subtraction of 0 WL(∼0.97 nm) calculated number of H2O layers Peak type NaFHt Peak I 1.24± 0.01 0.27 1.00 Peak II 1.51± 0.01 0.55 2.04 Peak typeLiFHt Peak I 1.21± 0.01 0.24 0.89 Peak II 1.39± 0.01 0.42 1.56 Peak III 1.53± 0.01 0.54 2.00 Peak IV 1.88± 0.01 0.91 3.37 https://dx.doi.org/10.1021/acs.jpcc.0c05847 J. Phys. Chem. C XXXX, XXX, XXX−XXX E
Note that inFigure 4, the dehydrated states for NaFHt and LiFHt differ in d001. For NaFHt, the 0WL yields a d-spacing of 0.97 nm, which is close to the theoretical value of 0.96 nm reported in the literature for dehydrated smectites.72,73 However, for LiFHt, this value is∼1.03 nm for the preheated sample. The observed 0.06 nm difference between the two samples is most likely related to disordered H2O interstratification, or it is caused by the presence of the hydrogenous complexes in the interlayer observed by Larsen et al.29 using QENS and TGA (see section 4.4). In the full diffractograms of LiFHt and NaFHt (see Figure 5), besides the(00 )S reflections, three extra phases are identified: brucite (Mg(OH)2), quartz (SiO2), and Li2O·2SiO2. These exoge-nous phases are byproducts of the LiFHt synthesis. Here, we note that quartz (SiO2) and Li2O·2SiO2have been quantified by Rivera et al.74 by using atomic absorption spectroscopy (AAS). The authors showed that the LiFHt powder received from the producer (Corning Inc.) contains about 20% by mass of impurities. This is confirmed in the XRD data, where Li2O·2SiO2 (lithium disilicate−Li2Si2O5), SiO2 (quartz), and Mg(OH)2(brucite) are identified phases in the sample, while brucite was also observed by Larsen et al.29
From the measured FWHM values depicted in Figure 3
and the subsequent extraction of the parameter ωL corresponding to the Lorentzian contribution, the thickness of the stack of clay platelets (that is, its size in the [00S]
direction), N·d, can be obtained using the Scherrer equation:
π · = N d w 2 L (4b)
The results are shown in Figure 6 for preheated and non-preheated NaFHt and LiFHt samples.
In Figure 6, the particle thicknesses in the preheated and non-preheated samples fall close to each other in the 1WL state, indicating that for the pure 1WL hydration state; the particle thickness seems to depend neither on thermal
Figure 4.Evolution of d001, obtained from the Bragg reflection position, as a function of the relative humidity at room temperature for (a)
NaFHt, preheated and non-preheated, and (b) LiFHt, preheated and non-preheated. Vertical lines are RH values at which TGA measurements were performed (see below).
Figure 5.Bragg reflections corresponding to different hydration states of preheated LiFHt. Data collected on the XRD2 beamline at the LNLS. B, Q, and L indexes denote brucite (Mg(OH)2), quartz, and Li2O·2SiO2, respectively. The hk-band is an in-plane feature found in FHt.75
Figure 6.Clay particle thickness with error bars, obtained from the Scherrer equation and the Lorentzian width, as a function of the number of water layers for the Na- and LiFHt non-preheated and preheated samples.
https://dx.doi.org/10.1021/acs.jpcc.0c05847
J. Phys. Chem. C XXXX, XXX, XXX−XXX
treatment nor on cation type. For that state, the small differences observed could be due to the different X-ray geometries; since for technical reasons, the preheated samples were measured in reflection, while the non-preheated samples were measured in transmission. In the 2WL state, the particle thickness for the two LiFHt samples are similar but not for NaFHt as water is less strongly bound to the Na+cation than to the Li+ cation, and therefore the heat treatment impacts the particle thickness more in NaFHt. An important observation is the low value of the calculated thickness for LiFHt in the 1.5WL hydration state, which is consistent with the corresponding large FWHM for the LiFHt peak around the 1.5WL region (qc≈ 4.5 nm−1) inFigure 3. This, together with the more gradual transition from 1.5WL to 2WL shown in Figure 4, strongly indicates that the nature of this 1.5WL hydration state is fundamentally different from that of the
other pure hydration states, suggesting a metastable or an interstratified state.
Since LiFHt exhibits more hydration states than NaFHt, the evaluation of the crystalline size via eq 4 was complemented using a Williamson−Hall analysis.31 With this aim, higher order Bragg reflections of the preheated LiFHt sample were considered, see Figure 5. The Williamson−Hall analysis is a generalization of the Scherrer equation that considers the contribution of the lattice strainξ to the widening of the Lorentzian peak:
S ω = π ξ · + N d q 2 L (00 ) (5b)
The Lorentzian widthωL,extracted from the(00 )S peaks in
Figure 5is thus expected to depend linearly onq(00 )S, with an
Figure 7.(a) Results of the Williamson−Hall analysis for the preheated LiFHt, with straight lines showing a near linear behavior of wLas a
function ofq(00 )S, except for 1.5WL. (b) Particle thickness N·d and lattice strain ξ obtained from the linear fits. Error bars are statistical errors in
the parameter determination from thefits.
Figure 8.Mass loss as a function of temperature for NaFHt (a) and LiFHt (b), measured with TGA on samples prepared at different RH values. The corresponding derivative of the mass loss (dML/dT) curves are shown in (c) for NaFHt and (d) for LiFh. The inset shows the
behavior at much larger temperatures.
https://dx.doi.org/10.1021/acs.jpcc.0c05847
J. Phys. Chem. C XXXX, XXX, XXX−XXX
intercept related to the particle thickness and a slope representing the lattice strain.
Figure 7shows the results of the Williamson−Hall analysis for preheated LiFHt. A significant increase in particle thickness is observed in the transition from 0WL (∼34 nm) to 1WL (∼150 nm), but the thickness then hardly changes between the 1WL and 2WL states. However, for 1.5WL, the extracted particle thickness is very small, around 30 nm. Such a behavior is similar to what was found in our previous analysis for NiFHt,61 implying that the intercalated water does not occupy the interlayer space homogeneously in the 1.5WL state (see theDiscussionsection), resulting in the broadening of the Bragg reflection. Note also that for 1.5WL, there is a significant departure from the linear dependence of ωLonq00S, which puts in question the usefulness of applying the Williamson−Hall analysis in that state. This departure in turn results in much larger uncertainties in the inferred mean particle thickness. The lattice strain remains approximately constant for lower hydration states and increases threefold between 1.5WL and 2WL, due to the higher water mobility,76 since in the 2WL, much more water molecules are outside the hydration shells of the cations. Another feature that can be seen inFigure 7, is that in the 1.5WL hydration state, the Bragg reflection intensities for the(00 )S reflections decrease, while the intensities of the other peaks increase (as compared to other hydration states). Such a feature is likely related to the rotation of the clay mineral layers around the [00S]
direction, which causes the in-plane reflection planes to align, thus increasing the intensity of the corresponding in-plane peaks.77,78
3.2. TGA Results. Figure 8 shows the mass loss as a function of temperature for samples initially prepared at RH ≈ 37, ∼75, and ∼95% for both NaFHt and LiFHt; data for the samples rehydrated for 8 h are also shown. The mass loss (Figure 8a,b) together with its derivative (dML/dT, see
Figure 8c,d) provide direct macroscopic information on the desorption process of these samples.
Using the XRD data as reference, we have established that NaFHt at RH = 37% is in the 1WL state (see Figure 4a), while at RH = 70%, it is in the 1WL state for the preheated sample and in the 2WL state for the non-preheated sample, and at RH = 90%, both samples are in the 2WL state.
For LiFHt, the RH = 37% curve represents the 1WL state (see Figure 4b). At RH = 75%, the curves of hydrated and rehydrated LiFHt are shown to have similar amounts of adsorbed H2O. This might be due to the rehydrated smectite (similarly to the preheated sample inFigure 4)being close to the transition between the 1.5WL and 2WL state. Then, a slight deviation in the RH level can cause the sample state to change to the 2WL state. On the contrary, for RH ≈ 90%, there is a clear difference between the behaviors of the hydrated and rehydrated sample, since as shown inFigure 4, the non-preheated sample is at 3WL and the preheated is at 2WL. Hence, the TGA is consistent with the XRD analysis discussed above.
Based on the dML/dT data (Figure 8c,d), in which the local minima correspond to inflection points in the TGA curves (Figure 8a,b), the data for NaFHt and LiFHt exhibit a broad inflection point around 80 and 70 °C, respectively. This can be associated with interparticle H2O populations and H2O molecules confined in the intraparticle nanopores, between the layers.28,29,58−61Furthermore, from the dML/dT
data, the small additional mass loss at ∼120 °C for NaFHt and ∼140 °C for LiFHt is most likely related to adsorbed surface H2O or the coordinated interlayer cation.
28
In fact, Xie et al.,23,51 using TGA, divided the dehydration of Na-montmorillonite samples into three steps: Thefirst is the loss of tightly bounded H2O (cationic interlayer H2O), the second step is the loss of interlayer surface H2O (easy to remove upon heating), and the third step is the loss of H2O coming from both interlayer surfaces and bulk. These are defined according to the difficulty of removal.
The inset in Figure 8d shows another inflection starting at 450°C and lasting until 600 °C with a peak at 580 °C in the rehydrated LiFHt sample. This inflection is associated with exogenous phases present in the powder sample in accordance with the XRD data of Figure 5.
To better compare the amount of water loss depending on the cation type, NaFHt and LiFHt at RH = 37% were heated to 150 °C and maintained at that temperature, where the mass loss was measured as a function of time. The result is shown inFigure 9and compared with NiFHt taken from ref
61.
Figure 9 demonstrates that NiFHt loses mass much faster than NaFHt and LiFHt, with 11% of the mass lost in 200 s. NaFHt loses 9% of its total mass in 600 s with no significant mass loss observed afterwards, while LiFHt takes much longer (∼1000 s) to lose 7% of its total mass. LiFHt has been demonstrated in refs 29, 62 to hold more interparticle H2O, but it also retains interlayer and cationic H2O more strongly than NaFHt, since the cation Li+has a smaller ionic radius, and thus a more concentrated charge. Therefore, H2O is more strongly bound to it, which could explain why the dynamics of dehydration is slower in LiFHt than in NaFHt. Restricted mobility was also clearly reflected in ref 29 by significantly longer residence times and a smaller diffusion coefficient in NiFHt at RH = 70%, which was attributed to the presence of Ni2+−H2O complexes in the interlayer.29,61
Using the information contained in the TGA data, it is possible to calculate the number of H2O molecules per milligram of the sample. Assuming that the mass loss shown in Figure 8 corresponds to the total amount of adsorbed
Figure 9.Mass loss as a function of time for LiFHt and NaFHt at RH = 37% when maintained continuously at 150°C. The data are compared with NiFHt data from ref61.
https://dx.doi.org/10.1021/acs.jpcc.0c05847
J. Phys. Chem. C XXXX, XXX, XXX−XXX
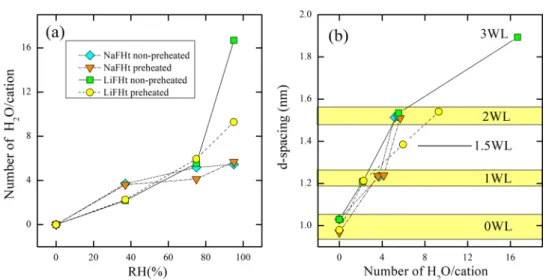
H2O,29then, the latter can be calculated as a function of the RH. By using the chemical formula of LiFHt and NaFHt, first, the number of cations can be estimated per unit of mass (mg). Dividing the amount of H2O molecules obtained from the mass loss in TGA by the number of cations then allows a direct estimation of the number of H2O molecules per cation. These results are presented in Figure 10.
Figure 10a shows the number of H2O molecules per cation as a function of RH, which is related to the d-spacings according to the relation shown in Figure 4. Consequently, the d-spacing as a function of the number of H2O molecules per cation can also be obtained. This is shown inFigure 10b. This analysis demonstrates that a number of H2O molecules per cation between 2.19 and 4.14 correspond to a 1WL state, while the number is between 5.18 and 9.29 for a 2WL state. For LiFHt, the 1.5WL and 3WL correspond to approximately 6.0 and 16.7 number of H2O molecules per cation, respectively. Interestingly, in a study using molecular dynamics, Morrow et al.72 did predict the existence of a 1.5 WL in NaFHt with 5.5 H2O/Na+. Although in the present work no 1.5 WL was detected for NaFHt, the predicted number is similar to the one measured here for LiFHt in this state. In the 1WL hydration state, the inferred values for the number of H2O molecules per cation match those found in a previous study38,39but deviate at higher RH for NaFHt. This might be a consequence of the inevitable loss of H2O in the time interval between the chamber opening and the start of the measurement, where we observe the loss of weakly bonded water molecules, such as surface and mesoporous water. Of more importance, however, is the fact that similar values are reported in the literature, either from molecular dynamics simulations or from other experimental techniques,43,44,69,70,76,79 which supports the idea that this methodology is very accurate in estimating the interlayer water population responsible for clay mineral swelling.
4. DISCUSSION
4.1. Effect of Heat Treatment. It is important to note that the samples were preheated only up to 150 °C in order to prevent layer charge reduction by the Hofmann−Klemen effect, which is when the interlayer cations can migrate to the octahedral sites of the silicate layer, partially neutralizing the
negative charge there. This effect has been reported to start at temperatures around 250 °C66,67,80 and is particularly important for the Li+ cation in smectites due to its small size. Significant differences between preheated and non-pre-heated samples have been noted previously for NiFHt.61 In the present work with NaFHt and LiFHt, also, significant differences between the preheated and non-preheated samples are observed, which raises the question whether a layer charge reduction is taking place at temperatures below 200 °C. The hydration state of a clay mineral is dependent on many factors: interlayer cation, layer charge, lateral dimensions, and hydroxyl groups in the layers.33 For FHt, which has a high layer charge and features F−instead of OH− in the silicate layers, which provides it with a higher hydrophobicity when compared to a natural hectorite or montmorillonite, we argue that the lack of higher hydration states (above 2WL) in the non-preheated NaFHt is a direct consequence of this hydrophobic nature26 together with its higher layer charge compared to montmorillonite.81 The preheated NaFHt was found to have its hydration state transitions shifted to a higher RH value, and the same was observed for preheated LiFHt, with the consequence (not seen for NaFHt) that the 3WL state was not reached.
It is evident from Figure 4a that flushing with N2 was enough to bring the Bragg reflection close to the 0WL position for NaFHt; there is still a small difference between the Bragg reflections of preheated and non-preheated 0WL. The former being ∼0.97 nm, which is close the theoretical value for smectites, while the latter is ∼0.98 nm. The difference between the hydration paths for NaFHt could thus be due to initial random intercalation of small amounts of H2O, which could facilitate the crystalline swelling.
In the case of LiFHt, the non-preheated sample did not reach its 0WL state at ∼1.03 nm, which shows that there is initial 1WL in the interlayer space, which can facilitate the intercalation of more H2O. Preheating LiFHt reduced this initial H2O content, which caused the hydration transitions to be shifted to higher values of RH and suppression of the 3WL state. As explained below (section 4.4), preheating to 150 °C should not have affected the hydrogenous structure reported by Larsen et al.29 The 3WL suppression could also happen if there was a cation population reduction in the interlayers due to the Hofmann−Klemen effect, which could
Figure 10. (a) Number of H2O molecules per cation as function of relative humidity; (b) d-spacing as function of the number of H2O
molecules per cation.
https://dx.doi.org/10.1021/acs.jpcc.0c05847
J. Phys. Chem. C XXXX, XXX, XXX−XXX
reduce the swelling capacity of this smectite upon heating at 150°C. However, to the best of our knowledge, there are no reports in the literature suggesting such a low temperature Hofmann−Klemen effect in FHt.
4.2. Lateral Dimensions. A key point to consider when discussing hydration states is the lateral dimensions of the silicate layers, since one potential mechanism for interlayer hydration is that coordination cations closer to the edge of the layers will become fully hydratedfirst, followed by cations positioned farther away from the edges of the silicate layer. This implies that when H2O molecules hydrate the innermost cations, this region is in the 1WL state, while in a continuous hydration process, cations closer to the edge could already be in the 2WL state.23,82Indeed, Bowers et al.8showed that one of the reasons why the d-spacing increases with increasing RH is related to the lateral dimensions of the silicate layers, which is dependent on the interlayer cations. The authors proposed that in the case where lateral dimensions are large enough for more than one hydration state to occur in the same interlayer at the time of observation, only a single Bragg reflection is observed during the transient phase between two hydration states. In the present experiment, this effect did not impact the X-ray data since at each RH step the powder samples were measured repeatedly until the steady state was reached, i.e., until the diffractogram had ceased to evolve in time.
4.3. One-and-a-Half Water Layer Hydration State (1.5WL). According to ref 76, the 1.5WL state in LiFHt could be a stable hydration state, in which the Li+cation goes from being part of an inner-sphere complex, which is a position close to the smectite layers, to a position located near the middle of the interlayer space, i.e., within an outer-sphere complex. However, other studies such as ref30 argue that the 1.5WL state is due to structural or chemical heterogeneities in the sample leading to interstratification of 1WL and 2WL and resulting in a different average d-spacing. Na-hectorite simulations have provided a third possible explanation according to which the predicted 1.5WL state is a result of a five-coordinate nearest neighbor Na+ cation, which lacks well-defined planes in the interlayers.72 The current results show that the 1.5WL state is present in the preheated and non-preheated LiFHt samples (cf. Figure 4), and that the dependence of the FWHM of the peak on the position exhibits a local minimum (cf. peak II in Figure 3b,d), indicating a potential hydration state in both cases. Note, however, that the Bragg reflection for 1.5WL is broader than for 1WL, 2WL, and 3WL. According to ref31, for the pure hydration states, the particle size is expected to be nearly independent of the type of interlayer cation. It can be noted that the Williamson−Hall (WH) analysis of Figure 7
provides a plot that is not linear for the 1.5WL peak, as a result of the wider Bragg reflections, as compared to the other hydration states (see Figure 3). In the complete X-ray diffractogram ofFigure 5, the(00 )S reflections corresponding to the 0WL state are very close to neighboring reflections, which causes uncertainties in the fitted parameters. This is particularly a problem for the 1.5WL data where the nonlinearity is even more pronounced, meaning that we here approach the limit of the WH analysis. This suggests that the 1.5WL is not a standard hydration state, since the particle thicknesses of hydrated states are otherwise approximately identical (except for 0WL).
In order to further our understanding of the 1.5WL state, we note that fitting the Hendricks−Teller (HT) interference function I(θ(q)) of eq 3 to the experimental 1.5WL Bragg reflections yields the orange dashed curve inFigure 11, which
is significantly broader than the experimental peak. Here, we have assumed, for simplicity, that the layer factor, F(q), is independent of q, since computing the complete layer factor would hardly modify the width of the HT interference function. A HT peak as measured by the setup, however, would be the convolution of the interference function by the Voigt profile, in eq 2, accounting for the finite thickness of the clay nanostacks and the resolution of the instrument (as shown for example in the 2WL hydration peak). Such a simulated HT peak is shown as a continuous thick red line in
Figure 11. Due to the convolution, the result is a peak that is even wider than the interference function peak and approximately twice as wide as the 1.5WL peak. Hence, the 1.5WL peak seen in the data is unlikely to result from Hendricks−Teller mixed intercalation between the 1WL and 2WL hydration states, which points to a metastable hydration state. Although in Figure 3, the 1.5WL state has a broader FWHM than the 1WL and 2WL; it still corresponds to a local minimum in the FWHM, which corroborates a possible metastability of this particular hydration state. However, we cannot fully exclude the possibility that the presence of a hydrogenous species (see section 4.4) in LiFHt could be responsible for this 1.5WL state, which is not seen in NaFHt. 4.4. Role of the Hydrogenous Species in the Interlayer of FHt. In previous works,29,61
it has been shown that NiFHt contains an extra phase that is present in the interlayers, since the basal spacing was 1.146 nm and not the theoretical 0.96 nm. The authors proposed that a Ni2+− H2O complex or Ni(OH)2 (Ni-hydroxide) could coexist in the interlayer galleries, causing the d-spacing to be larger than 0.96 nm even after heating the sample to 150 °C. This has been confirmed and thoroughly investigated by Loch et al.83 In LiFHt, the Bragg reflection for the dehydrated state had a d-spacing of ∼1.03 nm. Before proposing what is causing such an expansion, it is important to discuss the effect of temperature on the three exogenous phases identified in the XRD data in Figure 5. The inset of TGA data for LiFHt
Figure 11. Hendricks−Teller (HT) interference function and the corresponding simulated HT peak that bestfit the 1.5WL peak of LiFHt. The simulated HT peak accounts for thefinite thickness of the clay nanostacks and the resolution of the instrument. The 1WL and 2WL peaks of LiFHt are shown as well.
https://dx.doi.org/10.1021/acs.jpcc.0c05847
J. Phys. Chem. C XXXX, XXX, XXX−XXX
shows a small inflection in the dML/dT when the sample reaches ∼400 °C, lasting until 600 °C. This phase transition cannot be lithium disilicate (Li2Si2O5), since this material only changes at a temperature of approximately 942 °C.84 Quartz undergoes an α-SiO2 to β-SiO2 transition between 500 and 575°C,84,85which hardly would cause a variation in the dML/dT. Brucite (Mg(OH)2) is reported to start its dehydroxylation process between 400 and 525°C,29,86which is too low to correspond to OH groups in the silicate sheets.87,88 These impurities are byproducts of the sample synthesis and they are unlikely to occupy the interlayer space of LiFHt. However, it is expected that Li+ forms strong complexes with H2O, which was predicted in a simulation study by Greathouse and Sposito50 in Li-smectites. One of such complexes could be lithium hydroxide (LiOH), which is known to retain H2O and to dehydroxylate at ∼427 °C,89 and could be present in the interlayer space of LiFHt in small amounts, thus causing the dehydrated d-spacing to deviate from 0.96 nm. Another possibility for a Li+−H2O complex is one of the many aqualithium ions,90,91 which could form in the interlayer space during the cation exchange procedure or during the hydration experiments. More investigations are needed to evaluate the role of this hydrogenous structure in hydration processes, since they can influence the H2O mobility and retention in the interlayer galleries.
In any case, it has been demonstrated here that a simple cation exchange process to convert LiFHt to NaFHt removed this hydrogenous structure from the interlayers, since NaFHt’s dehydrated peak was measured to be approximately 0.97 nm, which is close to the theoretical value for dry smectites.72,73
5. CONCLUSIONS
The present work studied water adsorption at room temperature, as a function of relative humidity, in isotropic powders of Na- and Li-fluorohectorite subjected to different prior thermal treatments: preheated to 150 °C and non-preheated. The synthetic samples were analyzed in situ using XRD and TGA as a function of temperature and RH.
From the XRD measurements, the dependence on RH of the d-spacing for the thermally treated samples showed a significant difference with respect to the non-treated ones. Besides the obtention of a 0WL hydration state in preheated LiFHt, some of the hydration states were suppressed, for example, 3WL in preheated LiFHt and transitions to higher hydration states were achieved at higher relative humidity values. Furthermore, the XRD data from the preheated samples showed a different hydration path when compared to the non-preheated sample. An explanation for this behavior could be an initial H2O population in the interlayer and possibly an additional low temperature Hofmann−Klemen effect (at a temperature lower than 200 °C), for which migration of the interlayer cation to the octahedral sites of the smectite layers takes place. Consequently, smectite particles adsorb less water. This behavior is confirmed by the TGA data, which quantifies the global amount of adsorbed water depending on the ambient temperature and shows that the preheated sample and its rehydrated counterpart adsorb less water than the non-preheated sample, both initially and in its rehydrated state. This observation can be attributed to a hysteresis effect during clay mineral rehydration. For LiFHt, the Williamson−Hall analysis was used to investigate the effect of increased relative humidity on
the apparent particle thickness and strain. It showed a decrease of the particle thickness in the 1.5WL state, which is consistent with the peak broadening of the (001) Bragg reflection peak for that hydration state but contradicts the otherwise increasing trend of particle thickness as a function of the amount of intercalated water. Finally, by combining the XRD and TGA results, the number of water molecules per cation was estimated for each sample as a function of the RH; the estimates are in good agreement with previous results obtained from NMR and QENS data as well as molecular dynamics simulations. The number of water molecules per cation is not affected by the thermal treatment for NaFHt. For LiFHt in the 1WL hydration state, the number of water molecules per cation has a low impact, but in the 2WL state, that number is strongly impacted by the thermal treatment.
In addition to characterizing the impact of thermal treatment on adsorption of water by clay mineral particles, this study shows that the so-called 1.5WL hydration state observed in LiFHt is likely to be a metastable state resulting from a displacement of the Li+ cation within the interlayer space of the FHt. This interpretation is privileged since the corresponding Bragg reflection is too narrow to result from mixed intercalation, such as described by Hendricks and Teller’s theory of random mixed intercalation, and the dependence of the Bragg reflection’s FWHM on the scattering vector clearly exhibits a local minimum for the scattering vector that corresponds to the 1.5WL peak. Furthermore, it has been demonstrated that LiFHt contains a hydrogenous structure in the interlayers, which could be related to Li+−H2O complexes, such as LiOH or one of the many aqualithium ions. More investigations are needed to verify the role of these hydrogenous complexes in the hydration behavior of smectites.
These findings demonstrate that the evolution of water absorption properties of smectite materials resulting from exposure to temperatures significantly higher than ambient conditions depends on the nature of the intercalation cation. Prospects to this work include the study of this phenomenon on natural smectites, such as montmorillonite/bentonite. Indeed, if generalizable to natural hectorites, ourfindings may have strong implications for the design of confinement materials, such as those of interest for nuclear waste. However, one must be aware of the challenges of studying natural smectites, which is well demonstrated by Bowers et al. in an XRD and NMR study of a natural hectorite sample from San Bernardino.42Even after purifying the material, the partial substitutions of OH−to F−and the non-uniformity in cation/layer charge distribution amplifies the complexity of the system as compared to a synthetic hectorite.
■
AUTHOR INFORMATIONCorresponding Authors
L. Michels − Department of Physics, Norwegian University of Science and Technology, Trondheim 7495, Norway;
orcid.org/0000-0002-0023-681X; Email: leander.michels@ntnu.no
J. O. Fossum − Department of Physics, Norwegian University of Science and Technology, Trondheim 7495, Norway; Email: jon.fossum@ntnu.no
https://dx.doi.org/10.1021/acs.jpcc.0c05847
J. Phys. Chem. C XXXX, XXX, XXX−XXX
Authors
C. L. S. da Fonseca − Instituto de Fı ́sica, Universidade de Brasi ́lia, DF 70.919-970, Brazil
Y. Méheust − Univ. Rennes, CNRS, Géosciences Rennes - UMR 6118, F-35000, France
M. A. S. Altoé − Departamento de Quı ́mica e Fı ́sica, Universidade Federal do Espi ́rito Santo, Alegre, ES 29.500-000, Brazil
E. C. dos Santos − Departamento de Quı ́mica, Faculdade de Ciências, Universidade Estadual Paulista Júlio de Mesquita Filho (UNESP), Bauru, SP 17033-360, Brazil
G. Grassi − Instituto de Fı ́sica, Universidade de Brasi ́lia, DF 70.919-970, Brazil; Fundação Universidade Aberta do Distrito Federal − FUNAB, DF 70635-815, Brazil R. Droppa, Jr. − Centro de Ciĉncias Naturais e Humanas,
Universidade Federal do ABC, Santo André, SP 09.210-580, Brazil
K. D. Knudsen − Department of Physics, Norwegian University of Science and Technology, Trondheim 7495, Norway; Institute for Energy Technology, IFE, Kjeller 2027, Norway L. P. Cavalcanti − Department of Physics, Norwegian
University of Science and Technology, Trondheim 7495, Norway; Institute for Energy Technology, IFE, Kjeller 2027, Norway; orcid.org/0000-0002-0408-0058
K. W. B. Hunvik − Department of Physics, Norwegian University of Science and Technology, Trondheim 7495, Norway
G. J. da Silva − Instituto de Fı ́sica, Universidade de Brasi ́lia, DF 70.919-970, Brazil
H. N. Bordallo − Niels Bohr Institute, University of Copenhagen, Copenhagen 2100, Denmark; European Spallation Source, Lund 22100, Sweden; orcid.org/0000-0003-0750-0553
Complete contact information is available at:
https://pubs.acs.org/10.1021/acs.jpcc.0c05847
Notes
The authors declare no competing financial interest.
■
ACKNOWLEDGMENTSThe authors acknowledge the Brazilian Synchrotron Light Laboratory (LNLS) technical staff at the XRD2 beam line. Specially, we also wish to thank Antônio Gasperini and Fabio Zambello for their helpful assistance at the LNLS. H.N.B. acknowledges the financial support received from the University of Copenhagen, Niels Bohr Institute, the CoNexT project, and from the MAX4ESSFUN of the European Regional Development Fund Interreg Oresund-Kattegat-Skagerrak (project KU-019). H.N.B. also acknowledges the support from the Carlsbergfond grant ref: 2013-01-0589. In turn, E.C.S. acknowledges thefinancial support received from CAPES (process 88887.468152/2019-00) and CNPq (proc-ess 159936/2018-7). L.M., J.O.F. thank the CLIMIT Program of the Research Council of Norway (project number 200041). L.M., E.C.S., and J.O.F. appreciate the support from the Research Council of Norway (SYNKNØYT grant number 228551). K.W.B.H., L.P.C., K.D.K., and J.O.F. were supported by the Research Council of Norway under the Frinatek Program, project number 250728. Y.M. grate-fully acknowledges the support from the Research Council of Norway for a stay as a guest researcher at the Norwegian Univ. of Science and Technology in 2019, under project no.
280643. The authors thank the three anonymous reviewers for their contributions to significantly improving the manu-script.
■
REFERENCES(1) Sellin, P.; Leupin, O. X. The Use of Clay as an Engineered Barrier in Radioactive-Waste Management - a Review. Clays Clay Miner. 2013, 61, 477−498.
(2) Michels, L.; et al. Intercalation and Retention of Carbon Dioxide in a Smectite Clay Promoted by Interlayer Cations. Sci. Rep. 2015, 5, 8775.
(3) Espinoza, D. N.; Santamarina, J. C. Clay Interaction with Liquid and Supercritical Co2: The Relevance of Electrical and Capillary Forces. Int. J. Greenhouse Gas Control 2012, 10, 351−362. (4) Loganathan, N.; Yazaydin, A. O.; Bowers, G. M.; Ngouana-Wakou, B. F.; Kalinichev, A. G.; Kirkpatrick, R. J. Role of Cations in the Methane/Carbon Dioxide Partitioning in Nano-and Mesopores of Illite Using Constant Reservoir Composition Molecular Dynamics Simulation. J. Phys. Chem. C 2020, 124, 2490−2500.
(5) Botan, A.; Rotenberg, B.; Marry, V.; Turq, P.; Noetinger, B. Carbon Dioxide in Montmorillonite Clay Hydrates: Thermody-namics, Structure, and Transport from Molecular Simulation. J. Phys. Chem. C 2010, 114, 14962−14969.
(6) Cygan, R. T.; Romanov, V. N.; Myshakin, E. M. Molecular Simulation of Carbon Dioxide Capture by Montmorillonite Using an Accurate and Flexible Force Field. J. Phys. Chem. C 2012, 116, 13079−13091.
(7) Romanov, V. N. Evidence of Irreversible Co2 Intercalation in Montmorillonite. International Journal of Greenhouse Gas Control 2013, 14, 220−226.
(8) Bowers, G. M.; Loring, J. S.; Walter, E. D.; Burton, S. D.; Bowden, M. E.; Hoyt, D. W.; Arey, B.; Larsen, R. K., IV; Kirkpatrick, R. J. Influence of Smectite Structure and Hydration on Supercritical Methane Binding and Dynamics in Smectite Pores. J. Phys. Chem. C 2019, 123, 29231−29244.
(9) Jin, Z.; Firoozabadi, A. Effect of Water on Methane and Carbon Dioxide Sorption in Clay Minerals by Monte Carlo Simulations. Fluid Phase Equilib. 2014, 382, 10−20.
(10) Li, Y.; Chen, M.; Liu, C.; Song, H.; Yuan, P.; Zhang, B.; Liu, D.; Du, P. Effects of Layer-Charge Distribution of 2:1 Clay Minerals on Methane Hydrate Formation: A Molecular Dynamics Simulation Study. Langmuir 2020, 36, 3323−3335.
(11) dos Santos, E. C.; et al. Ciprofloxacin Intercalated in Fluorohectorite Clay: Identical Pure Drug Activity and Toxicity with Higher Adsorption and Controlled Release Rate. RSC Adv. 2017, 7, 26537−26545.
(12) Iliescu, R. I.; Andronescu, E.; Ghitulica, C. D.; Voicu, G.; Ficai, A.; Hoteteu, M. Montmorillonite-Alginate Nanocomposite as a Drug Delivery System Incorporation and in Vitro Release of Irinotecan. Int. J. Pharm. 2014, 463, 184−192.
(13) Viseras, C.; Cerezo, P.; Sanchez, R.; Salcedo, I.; Aguzzi, C. Current Challenges in Clay Minerals for Drug Delivery. Appl. Clay Sci. 2010, 48, 291−295.
(14) Joshi, G. V.; Kevadiya, B. D.; Bajaj, H. C. Design and Evaluation of Controlled Drug Delivery System of Buspirone Using Inorganic Layered Clay Mineral. Microporous Mesoporous Mater. 2010, 132, 526−530.
(15) dos Santos, E. C.; Gates, W. P.; Michels, L.; Juranyi, F.; Mikkelsen, A.; da Silva, G. J.; Fossum, J. O.; Bordallo, H. N. The Ph Influence on the Intercalation of the Bioactive Agent Ciprofloxacin in Fluorohectorite. Appl. Clay Sci. 2018, 166, 288−298.
(16) Oueslati, W.; Ben Rhaiem, H.; Amara, A. B. Xrd Investigations of Hydrated Homoionic Montmorillonite Saturated by Several Heavy Metal Cations. Desalination 2011, 271, 139−149. (17) Pascual, C. M.; Argu308elles, A.; Leoni, M.; Khainakov, S. A.; Blanco, J. A. Location of Ni2+ in Nickel-Intercalated Vermiculites.
Appl. Clay Sci. 2014, 91-92, 79−86.
https://dx.doi.org/10.1021/acs.jpcc.0c05847
J. Phys. Chem. C XXXX, XXX, XXX−XXX
(18) Maged, A.; Ismael, I. S.; Kharbish, S.; Sarkar, B.; Peräniemi, S.; Bhatnagar, A. Enhanced Interlayer Trapping of Pb (Ii) Ions within Kaolinite Layers: Intercalation, Characterization, and Sorption Studies. Environ. Sci. Pollut. Res. 2020, 27, 1870−1887.
(19) Kunz, R.; Amschler, S.; Edenharter, A.; Mayr, L.; Herlitz, S.; Rosenfeldt, S.; Breu, J. Giant Multistep Crystalline Vs. Osmotic Swelling of Synthetic Hectorite in Aqueous Acetonitrile. Clays Clay Miner. 2020, 1−7.
(20) Salles, F.; Bildstein, O.; Douillard, J. M.; Jullien, M.; Raynal, J.; Van Damme, H. On the Cation Dependence of Interlamellar and Interparticular Water and Swelling in Smectite Clays. Langmuir 2010, 26, 5028−5037.
(21) Bergaya, F.; Lagaly, G., Chapter 7.1 - Purification of Natural Clays. In Developments in Clay Science; Faïza, B.; Gerhard, L., Eds.; Elsevier: 2013; 5, 213−221.
(22) Laird, D. A. Model for Crystalline Swelling of 2:1 Phyllosilicates. Clays Clay Miner. 1996, 44, 553−559.
(23) Xie, G.; Xiao, Y.; Deng, M.; Zhang, Q.; Huang, D.; Jiang, L.; Yang, Y.; Luo, P. Quantitative Investigation of the Hydration Behavior of Sodium Montmorillonite by Thermogravimetric Analysis and Low-Field Nuclear Magnetic Resonance. Energy Fuels 2019, 33, 9067−9073.
(24) Szczerba, M.; Kalinichev, A. G.; Kowalik, M. Intrinsic Hydrophobicity of Smectite Basal Surfaces Quantitatively Probed by Molecular Dynamics Simulations. Appl. Clay Sci. 2020, 188, 105497.
(25) Marty, N. C. M.; Grangeon, S.; Lassin, A.; Madé, B.; Blanc, P.; Lanson, B. A Quantitative and Mechanistic Model for the Coupling between Chemistry and Clay Hydration. Geochim. Cosmochim. Acta 2020, 124.
(26) Dazas, B.; Lanson, B.; Breu, J.; Robert, J.-L.; Pelletier, M.; Ferrage, E. Smectite Fluorination and Its Impact on Interlayer Water Content and Structure: A Way to Fine Tune the Hydrophilicity of Clay Surfaces? Microporous Mesoporous Mater. 2013, 181, 233−247. (27) Sato, T.; Watanabe, T.; Otsuka, R. Effects of Layer Charge, Charge Location, and Energy Change on Expansion Properties of Dioctahedral Smectites. Clays Clay Miner. 1992, 40, 103−113.
(28) Bordallo, H. N.; Aldridge, L. P.; Churchman, G. J.; Gates, W. P.; Telling, M. T. F.; Kiefer, K.; Fouquet, P.; Seydel, T.; Kimber, S. A. J. Quasi-Elastic Neutron Scattering Studies on Clay Interlayer-Space Highlighting the Effect of the Cation in Confined Water Dynamics. J. Phys. Chem. C 2008, 112, 13982−13991.
(29) Larsen, S. R.; et al. Physicochemical Characterisation of Fluorohectorite: Water Dynamics and Nanocarrier Properties. Microporous Mesoporous Mater. 2020, 306, 110512.
(30) Ferrage, E. Investigation of the Interlayer Organization of Water and Ions in Smectite from the Combined Use of Diffraction Experiments and Molecular Simulations. A Review of Methodology, Applications, and Perspectives. Clays Clay Miner. 2016, 64, 348− 373.
(31) da Silva, G. J.; Fossum, J. O.; DiMasi, E.; Måløy, K. J.; Lutnaes, S. B. Synchrotron X-Ray Scattering Studies of Water Intercalation in a Layered Synthetic Silicate. Phys. Rev. E 2002, 66, No. 011303.
(32) da Silva, G. J.; Fossum, J. O.; DiMasi, E.; Måløy, K. J. Hydration Transitions in a Nanolayered Synthetic Silicate: A Synchrotron X-Ray Scattering Study. Phys. Rev. B 2003, 67, No. 094114.
(33) Vinci, D.; Dazas, B.; Ferrage, E.; Lanson, M.; Magnin, V.; Findling, N.; Lanson, B. Influence of Layer Charge on Hydration Properties of Synthetic Octahedrally-Charged Na-Saturated Triocta-hedral Swelling Phyllosilicates. Appl. Clay Sci. 2020, 184, 105404.
(34) Ferrage, E.; Lanson, B.; Sakharov, B. A.; Drits, V. A. Investigation of Smectite Hydration Properties by Modeling Experimental X-Ray Diffraction Patterns: Part I. Montmorillonite Hydration Properties. Am. Mineral. 2005, 90, 1358−1374.
(35) Ferrage, E.; Sakharov, B. A.; Michot, L. J.; Delville, A.; Bauer, A.; Lanson, B.; Grangeon, S.; Frapper, G.; Jiménez-Ruiz, M.; Cuello, G. J. Hydration Properties and Interlayer Organization of Water and
Ions in Synthetic Na-Smectite with Tetrahedral Layer Charge. Part 2. Toward a Precise Coupling between Molecular Simulations and Diffraction Data. J. Phys. Chem. C 2011, 115, 1867−1881.
(36) Marry, V.; Dubois, E.; Malikova, N.; Breu, J.; Haussler, W. Anisotropy of Water Dynamics in Clays: Insights from Molecular Simulations for Experimental Qens Analysis. J. Phys. Chem. C 2013, 117, 15106−15115.
(37) Marry, V.; Malikova, N.; Cadène, A.; Dubois, E.; Durand-Vidal, S.; Turq, P.; Breu, J.; Longeville, S.; Zanotti, J.-M. Water Diffusion in a Synthetic Hectorite by Neutron ScatteringBeyond the Isotropic Translational Model. J. Phys.: Condens. Matter 2008, 20, 104205.
(38) Tenório, R. P.; Alme, L. R.; Engelsberg, M.; Fossum, J. O.; Hallwass, F. Geometry and Dynamics of Intercalated Water in Na-Fluorhectorite Clay Hydrates. J. Phys. Chem. C 2008, 112, 575−580. (39) Tenório, R. P.; Engelsberg, M.; Fossum, J. O.; da Silva, G. J. Intercalated Water in Synthetic Fluorhectorite Clay. Langmuir 2010, 26, 9703−9709.
(40) Bowers, G. M.; Bish, D. L.; Kirkpatrick, R. J. H2o and Cation
Structure and Dynamics in Expandable Clays: 2h and 39k Nmr Investigations of Hectorite. J. Phys. Chem. C 2008, 112, 6430−6438. (41) Bowers, G. M.; Singer, J. W.; Bish, D. L.; Kirkpatrick, R. J. Structural and Dynamical Relationships of Ca2+ and H2o in Smectite/2h2o Systems. Am. Mineral. 2014, 99, 318−331.
(42) Bowers, G. M.; Singer, J. W.; Bish, D. L.; Kirkpatrick, R. J. Alkali Metal and H2o Dynamics at the Smectite/Water Interface. J. Phys. Chem. C 2011, 115, 23395−23407.
(43) Schnetzer, F.; Johnston, C. T.; Premachandra, G. S.; Giraudo, N.; Schuhmann, R.; Thissen, P.; Emmerich, K. Impact of Intrinsic Structural Properties on the Hydration of 2:1 Layer Silicates. Acs Earth Space Chem. 2017, 1, 608−620.
(44) Yeşilbaş, M.; Holmboe, M.; Boily, J. F. Cohesive Vibrational and Structural Depiction of Intercalated Water in Montmorillonite. Acs Earth Space Chem. 2018, 2, 38−47.
(45) Aguiar, A. S.; Michels, L.; da Silva, F.; Kern, C.; Gomide, G.; Ferreira, C. M.; Depeyrot, J.; Aquino, R.; da Silva, G. J. The Use of a Laponite Dispersion to Increase the Hydrophilicity of Cobalt-Ferrite Magnetic Nanoparticles. Appl. Clay Sci. 2020, 193, 105663. (46) Honorio, T.; Brochard, L.; Vandamme, M. Hydration Phase Diagram of Clay Particles from Molecular Simulations. Langmuir 2017, 33, 12766−12776.
(47) Hsiao, Y.-W.; Hedström, M. Swelling Pressure in Systems with Na-Montmorillonite and Neutral Surfaces: A Molecular Dynamics Study. J. Phys. Chem. C 2017, 121, 26414−26423.
(48) Tambach, T. J.; Bolhuis, P. G.; Hensen, E. J. M.; Smit, B. Hysteresis in Clay Swelling Induced by Hydrogen Bonding: Accurate Prediction of Swelling States. Langmuir 2006, 22, 1223− 1234.
(49) Greathouse, J. A.; Refson, K.; Sposito, G. Molecular Dynamics Simulation of Water Mobility in Magnesium-Smectite Hydrates. J. Am. Chem. Soc. 2000, 122, 11459−11464.
(50) Greathouse, J.; Sposito, G. Monte Carlo and Molecular Dynamics Studies of Interlayer Structure in Li (H2o) 3− Smectites. J. Phys. Chem. B 1998, 102, 2406−2414.
(51) Xie, G.; Huang, D.; Xiao, Y.; Deng, M.; Luo, P. Intercalation Inhibits Surface Hydration of Sodium Montmorillonite: Experiment and Density Functional Theory Simulation. ACS Sustainable Chem. Eng. 2020, 10303.
(52) Underwood, T. R.; Bourg, I. C. Large-Scale Molecular Dynamics Simulation of the Dehydration of a Suspension of Smectite Clay Nanoparticles. J. Phys. Chem. C 2020, 124, 3702− 3714.
(53) Lindholm, J.; Boily, J.-F.; Holmboe, M. Deconvolution of Smectite Hydration Isotherms. Acs Earth Space Chem. 2019, 3, 2490−2498.
(54) Neaman, A.; Pelletier, M.; Villieras, F. The Effects of Exchanged Cation, Compression, Heating and Hydration on Textural Properties of Bulk Bentonite and Its Corresponding Purified Montmorillonite. Appl. Clay Sci. 2003, 22, 153−168.
https://dx.doi.org/10.1021/acs.jpcc.0c05847
J. Phys. Chem. C XXXX, XXX, XXX−XXX