HAL Id: hal-00317877
https://hal.archives-ouvertes.fr/hal-00317877
Submitted on 14 Oct 2005
HAL is a multi-disciplinary open access
archive for the deposit and dissemination of
sci-entific research documents, whether they are
pub-lished or not. The documents may come from
teaching and research institutions in France or
abroad, or from public or private research centers.
L’archive ouverte pluridisciplinaire HAL, est
destinée au dépôt et à la diffusion de documents
scientifiques de niveau recherche, publiés ou non,
émanant des établissements d’enseignement et de
recherche français ou étrangers, des laboratoires
publics ou privés.
The first coordinated observations of mid-latitude
E-region quasi-periodic radar echoes and lower
thermospheric 557.7-nm airglow
T. Ogawa, Y. Otsuka, F. Onoma, K. Shiokawa, M. Yamamoto
To cite this version:
T. Ogawa, Y. Otsuka, F. Onoma, K. Shiokawa, M. Yamamoto. The first coordinated observations of
mid-latitude E-region quasi-periodic radar echoes and lower thermospheric 557.7-nm airglow. Annales
Geophysicae, European Geosciences Union, 2005, 23 (7), pp.2391-2399. �hal-00317877�
SRef-ID: 1432-0576/ag/2005-23-2391 © European Geosciences Union 2005
Annales
Geophysicae
The first coordinated observations of mid-latitude E-region
quasi-periodic radar echoes and lower thermospheric 557.7-nm
airglow
T. Ogawa1, Y. Otsuka1, F. Onoma1, K. Shiokawa1, and M. Yamamoto2
1Solar-Terrestrial Environment Laboratory, Nagoya University, Honohara, Toyokawa, Aichi 442-8507, Japan 2Research Institute for Sustainable Humanosphere, Kyoto University, Gokasho, Uji, Kyoto 611-0011, Japan
Received: 10 January 2005 – Revised: 19 April 2005 – Accepted: 1 June 2005 – Published: 13 October 2005 Part of Special Issue “SEEK-2 (Sporadic-E Experiment over Kyushu 2)”
Abstract. We present the first coordinated observations of quasi-periodic (QP) radar echoes from sporadic-E (Es) field-aligned irregularities (FAIs), OI 557.7-nm airglow, and neutral winds in a common volume over Shigaraki, Japan (34.9◦N, 136.1◦E) on the night of 5 August 2002 during the SEEK-2 campaign. QP echo altitudes of 90–110 km were lower than usual by 10 km, enabling us to make a detailed comparison among QP echoes, airglow intensity, and neu-tral wind at around 96 km altitude. Eastward movement of the QP echo regions is consistent with the motions of neutral winds, airglow structures, and FAIs, suggesting that the elec-trodynamics of Es-layers is fundamentally controlled by the neutral atmospheric dynamics. During the QP echo event, the echo altitudes clearly went up (down) in harmony with an airglow enhancement (subsidence) that also moved to the east. This fact suggests that the eastward-moving enhanced airglow region included an upward (downward) component of neutral winds to raise (lower) the altitude of the wind-shear node responsible for the Es formation. The airglow intensity, echo intensity, and Doppler velocity of FAIs at around 96 km altitude fluctuated with periods from 10 min to 1 h, indicating that these parameters were modulated with short-period atmospheric disturbances. Some QP echo re-gions below 100 km altitude contained small-scale QP struc-tures in which very strong neutral winds exceeding 100 m/s existed. The results are compared with recent observations, theories, and simulations of QP echoes.
Keywords. Ionosphere (Ionosphere-atmosphere interac-tions; Ionospheric irregularities; Mid-latitude ionosphere)
Correspondence to: T. Ogawa
(ogawa@stelab.nagoya-u.ac.jp)
1 Introduction
Detailed behavior of 3.2-m field-aligned irregularities (FAIs) in the nighttime mid-latitude E-region in summer was pre-sented for the first time by Yamamoto et al. (1991), who used the powerful middle and upper atmosphere (MU) radar at Shigaraki, Japan (34.9◦N, 136.1◦E; 25.0◦N geomagnetic). They found spectacular radar echoes, called “quasi-periodic” (QP) echoes, that appear intermittently at altitudes above 100 km with periods of 5–20 min from post-sunset to mid-night. Since then, some characteristics of the MU radar QP echoes have been revealed by Yamamoto et al. (1992, 1994, 1997) and Ogawa et al. (1995, 1998, 2002), and QP echoes similar to the MU QP echoes have been detected at other lo-cations (e.g. Yamamoto et al., 2005). See a paper by Tsunoda et al. (2004) for radar observations of QP-like echoes prior to the finding of the QP echoes by Yamamoto et al. (1991).
QP echoes from the E-region are usually related to sporadic-E (Es) layers that accompany electron density gra-dients capable of inducing the gradient-drift instability under the action of the ambient electric field. A recent nonlocal theory by Seyler et al. (2004) predicts that this instability can produce electron density irregularities responsible for radar wave backscatter from both sides of a thin Es-layer, super-imposed on a background electron density distribution, under constant electric field and/or neutral wind. Strong polariza-tion electric fields associated with an Es-layer can rarely ex-cite FAIs through the two-stream instability (Haldoupis et al., 1996). Neutral winds may also play a role in generating FAIs (Kagan and Kelley, 1998). From MU radar observations, Rao et al. (2000) found the new type of QP echoes (low-altitude QP echoes) at (low-altitudes of 90–100 km that have ver-tical wavelengths of 0.6–1.2 km and periods of 30–90 s (see also Ogawa et al., 2002). Since then, similar low-altitude QP echoes at other locations have been reported (e.g. Urbina et
2392 T. Ogawa et al.: QP radar echoes and 557.7-nm airglow
37
35 36
North Latitude (deg.)
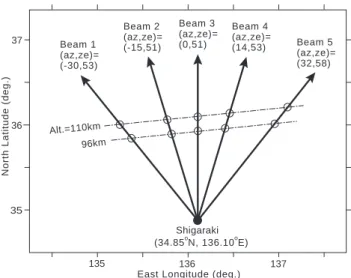
East Longitude (deg.) 136 135 137 96km Alt.=110km Beam 1 (az,ze)= (-30,53) Beam 2 (az,ze)= (-15,51) Beam 3 (az,ze)= (0,51) Beam 4 (az,ze)= (14,53) Beam 5(az,ze)= (32,58) Shigaraki (34.85 N, 136.10 E)o o
Fig. 1. Bearings (azimuth and zenith) of 5 MU radar beams on
geographic coordinates. Points where the beams penetrate 96 and 110 km altitudes are indicated by white circles.
al., 2000; Urbina et al., 2004 and references therein). Urbina et al. (2004) have pointed out that the gradient-drift insta-bility does not play a primary role in the generation of low-altitude QP echoes, though a secondary gradient-drift pro-cess is supposed to be the cause of radar wave backscatter. The production mechanism of low-altitude QP echoes is still not clear. Atmospheric gravity waves (AGWs) may play a role.
Mid-latitude Es-layer is believed to be created by a ver-tical shear of neutral winds at around 100 km altitude (e.g. Mathews, 1998). Such a process has been experimentally confirmed through, for example, the SEEK (Sporadic-E Ex-periment over Kyushu) −1 (Fukao et al., 1998) and SEEK–2 rocket campaigns (Yamamoto et al., 2005) that were suc-cessfully conducted in Japan in the summer of 1996 and 2002, respectively. The wind shear may excite the Kelvin-Helmholtz instability to bring about QP structures in an Es -layer (Larsen, 2000a, 2000b; Bernhardt, 2002). Kagan and Kelley (1998) have suggested that short-period AGWs inter-acting with an Es may create QP structures (see also Kagan et al., 2000; Kagan, 2002). On the other hand, Cosgrove and Tsunoda (2002, 2003) have proposed an azimuth-dependent
Es instability to produce QP structures (see also Tsunoda et al., 2004). Their theory predicts a southwestward movement of the QP echo regions with phase fronts aligned NW–SE. Such a movement has been well documented since the dis-covery of QP echoes by the MU radar (e.g. Yamamoto et al., 1994, 1997; Ogawa et al., 1995, 2002; Hysell et al., 2004; Hussey et al., 2004; Saito et al., 2005). Contrary to this, we show below a case in which QP echo regions move to the east.
Echo intensity, Doppler velocity, and spectral width of QP echoes usually show large temporal and spatial fluctu-ations (e.g. Yamamoto et al., 1991; Ogawa et al., 1995, 2002), which suggests that these fluctuations are invoked by
AGWs and/or polarization electric fields in an Es (Huang and Kelley, 1996; Horinouchi et al., 2002; Horinouchi, 2004; Yokoyama et al., 2004b, 2005). Strong electric field fluc-tuations were actually found from the rocket flights during SEEK–1 (Pfaff et al., 1998) and SEEK–2 (Wakabayashi et al., 2005).
Until now, QP echoes and their related FAIs have been studied primarily by means of radars and sounding rock-ets. However, the relationship between QP echoes (FAIs) and neutral atmospheric disturbances has remained unsolved. To clarify this relationship to some extent, we present the first coordinated observations of MU radar QP echoes, air-glow, and neutral winds at around 96 km over Shigaraki on the night of 5 August 2002 during the SEEK–2 campaign. We use an 557.7-nm all-sky CCD imager and an 557.7-nm Fabry-Perot interferometer (FPI) located at Shigaraki to mea-sure the airglow intensity and neutral winds, respectively.
2 Experimental setup
2.1 The MU radar
The 46.5-MHz MU radar with a peak power of 1 MW has a sharp antenna beam, and can measure 3.2-m scale E-region FAIs by directing the beam northward with zenith angles of 50◦–60◦. Almost simultaneous observations in multi-directions are possible by using the capability of high speed beam-swinging with an interpulse period of 1.5 m/s. We used 5 beams for the observations which will be discussed in this paper. The range and time resolutions were 600 m and around 20 s, respectively. (See papers by Yamamoto et al. (1991) and Ogawa et al. (1995) for the detailed 5-beam observation technique). Figure 1 shows azimuth and zenith of each beam. The two-way half-power total beam width at these zenith angles is 4.5◦ and 2.3◦ in the vertical and horizontal planes, respectively. The 5 beams provide an az-imuth coverage of ±30◦about geographic north. At 100 km altitude this azimuth coverage corresponds to an east-west distance of about 155 km. All the beam bearings are within 1.8◦of perpendicular to the geomagnetic field at an altitude of about 100 km. The points where the beams penetrate the 96 and 110 km altitudes are indicated in Fig. 1 by the white circles. Note that these points are nearly aligned in the ge-omagnetic east-west direction with separation distances of 30–50 km between neighboring beams.
Figure 2 depicts detailed configuration of the antenna pat-tern of beam 3 in the geographical meridian plane that looks due north (5◦E of geomagnetic north) with an elevation an-gle of 39◦(Ogawa et al., 2002). Contours of the geomagnetic aspect angle “A”, defined in the upper left corner in the fig-ure, between the radar wave vector and the model geomag-netic field (IGRF85) are also shown. The beam bearing is exactly perpendicular to the geomagnetic field at 100 km alti-tude. The geomagnetic aspect angles along the beam bearing are within 90◦±1◦at ranges of 110–220 km, i.e. at altitudes of 70–135 km.
2.2 557.7-nm all-sky camera and Fabry-Perot interferome-ter
An all-sky CCD imager for measuring OI 557.7-nm airglow in the lower thermosphere has been operated at Shigaraki to obtain two-dimensional airglow intensity maps (512×512 pixels) every 5.5 min with an exposure time of 105 s (Sh-iokawa et al., 1999). As the 557.7-nm emission occurs mostly at altitudes of 90–100 km with its peak intensity at around 96 km (McDade et al., 1986; Iwagami et al., 2003), we assume the emission altitude of 96 km in this paper. A Fabry-Perot interferometer (FPI) has also been operated at Shigaraki to measure the Doppler shift of 557.7-nm emis-sion at zenith angles of 50◦±4.75◦and at four azimuthal di-rections of N, S, E, and W, every 15 min, and to obtain neu-tral wind speed for the first and second fringes independently (Shiokawa et al., 2001). The difference of winds between the both fringes is estimated to be mostly less than 20 m/s. Note that the horizontal distances between the N and S points and between the E and W points are about 230 km, so that winds observed by the FPI represent those that are averaged over a large area above Shigaraki.
We operated the MU radar, all-sky imager, and FPI on the nights from 28 July to 6 August (except for 4 August) during SEEK-2 in 2002. Weather conditions, however, were bad, except for 5 and 6 August on which we could obtain simul-taneous data from the radar and optical equipment. The min-imum altitude of the QP echo region was 90 km on 5 August and about 100 km on 6 August, so we analyzed data only on 5 August to see the relationship among QP echoes, airglow, and neutral winds in a common volume.
3 Observations and analysis
3.1 557.7-nm airglow
Simultaneous observations of E-region FAIs, airglow, and neutral winds were successfully carried out under clear sky conditions after about 20:00 LT on the night of 5 August. Using airglow image data from the all-sky imager, we cal-culated a deviation of airglow intensity in each pixel of the image. Here the deviation 1I558(t ) (in %) is defined as
(I558(t )−I0)/I0, where I558(t )is the absolute intensity (in
units of Rayleighs) at time t and I0is the 1-h running average
of I558(t ). Then the deviations were plotted on geographic
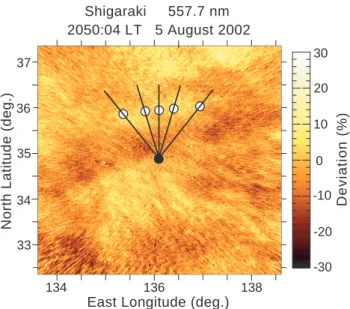
coordinates by assuming an emission altitude of 96 km. An example of the deviation map is displayed in Fig. 3, where, for example, the dark airglow region extending from ENE to WSW is discerned. The detailed analysis of the consecutive deviation maps indicates that the averaged motion of the air-glow patterns between 20:40 and 22:30 LT was toward SE at about 40 m/s.
The 5 beam directions of the MU radar shown in Fig. 1 are plotted in Fig. 3. A white circle on each beam represents the position where the beam penetrates the 96 km altitude. We picked up I558(t )and 1I558(t )in the pixel that is closest to
70 80 90 120 130 140 80 100 120 140 160 180 Horizontal Distance (km) Altitude (km) 100 150 B0 K 95 90 A=85 EL=39 o 4.5 o North South o o o R=200km 180 160 150 140 130 190 170 110 A Beam 3
Fig. 2. Configuration of beam 3 in the geographical meridian plane
that looks due north with an elevation angle of 39◦. The two-way beam width is 4.5◦(shaded) and 2.3◦in the vertical and horizontal planes, respectively. Contours of the geomagnetic aspect angle (A) between the radar wave vector (k) and the geomagnetic field vector (B0) are also shown, together with slant ranges from the MU radar.
2050:04 LT 5 August 2002 33 37 34 35 36
North Latitude (deg.)
East Longitude (deg.)
134 136 138 30 -20 -10 0 10 20 -30 Deviation (%) Shigaraki 557.7 nm
Fig. 3. Map of deviation of 557.7-nm airglow intensity (1I558)
taken at 20:50:04 LT on 5 August 2002. Position of Shigaraki (solid circle) and 5 MU radar beams (solid lines) are also shown. White circles represent positions where the beam penetrates 96 km alti-tude.
the white circle. Figure 4a plots temporal variations of these parameters on all the radar beams. The background intensity of I558 is about 200 R and the maximum intensity reaches
400 R. This indicates an increase in the atomic oxygen den-sity [O] of 26% of the background denden-sity, because I558is
ap-proximately proportional to the cube of [O] (McDade et al., 1986). Notice in Fig. 4a that the maximum absolute intensity of 400 R on beams 1 and 5 occurs at 21:37 and 22:14 LT, respectively, indicating an apparent eastward motion of the
2394 T. Ogawa et al.: QP radar echoes and 557.7-nm airglow Absolute Intensity (R) Shigaraki 557.7 nm 5-6 August 2002 200 400 0 Intensity Deviation (%) 0 -10 10 Dev. Abs. 1st Fringe 2nd Fringe 20
Local Time (hours)
21 22 23 0 1 2 FPI (557.7 nm) 200 400 0 200 400 0 200 400 0 200 400 0 0 -10 10 0 -10 10 0 -10 10 0 -10 10 20 21 22 23 0 1 2 15 15 15 15 15 -15 Beam 1 Beam 5 Beam 4 Beam 3 Beam 2 25 0 75 50 Wind Velocity (m/s) 90 0 180 Azimuth (deg.) (a) (b) S E N
Fig. 4. (a) Temporal variations of absolute intensity (I558) and
de-viation of 557.7-nm airglow intensity (1I558) at around 96 km al-titude (white circles in Fig. 1) on 5 MU radar beams. (b) Neutral wind speed and azimuth (clockwise from geographic north) of the wind vector determined from first and second fringes of the Fabry-Perot interferometer at Shigaraki.
bright air glow region at about 65 m/s along the dot-dashed lines at 96 km in Fig. 1. This apparent motion corresponds well to the motion of the airglow patterns in Fig. 3 (toward SE at about 40 m/s). The 1I558 values (dashed curves) in
Fig. 4a fluctuate with periods from 10 min (= twice the time resolution of 5.5 min for the airglow measurements) to 1 h. Interestingly, the dashed curves for beams 1 and 4 are simi-lar to those for beams 2 and 5, respectively, with a little time difference. This fact suggests that the airglow is modulated by AGWs with a horizontal scale of about 100 km (note the separation distances of 40–50 km between neighboring radar beams), in addition to smaller scales.
Figure 4b shows temporal variations of the neutral wind speed and azimuth (clockwise from geographic north) of the wind vector that were determined from the first and second fringes of the FPI. The wind speed at around 96 km altitude was between 20 and 50 m/s while changing slowly its az-imuth from the east to the south before about 22:30 LT, and from the south to the east thereafter. The wind may
repre-22 23
Local Time (hours)
130 120 110 100 90 80 Altitude (km)
MU Echo Intensity 5 August 2002
200 180 160 140 Range (km) 200 180 160 140 20 19 200 180 160 220 21 130 120 110 100 90 80 130 120 110 100 90 80 30 SNR (dB) 36 18 12 6 0 24 Beam 1 Beam 5 Beam 3 (c) (b) (a) Abs.
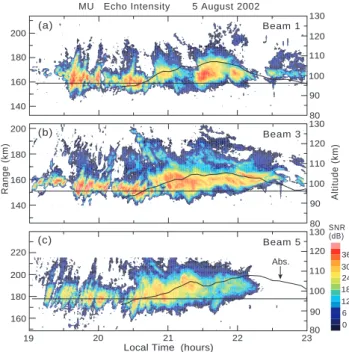
Fig. 5. Range-time-intensity (SNR) plots of MU radar echoes on
beams 1, 3 and 5. The right ordinate represents altitudes calculated using slant ranges and zenith angle of each radar beam. Temporal variations of absolute intensity (I558; solid curve) at around 96 km
altitude, shown in Fig. 4a, are also plotted.
sent a semidiurnal tidal wind. The wind speed (20–50 m/s) and its azimuth (ENE–SSE) between 20:30 and 22:30 LT are consistent with the eastward motion of both the airglow pat-terns (Fig. 3) and the most bright airglow region (Fig. 4a). 3.2 E-region radar echoes
Figure 5 displays range-time-intensity (RTI) plots of signal-to-noise ratio (SNR in dB) of the MU radar echoes observed on beams 1, 3 and 5 on the night of 5 August. The altitudes shown on the right ordinate were calculated from the steered zenith angle of the radar beam. Typical QP echoes were ob-served between 19:00 and 22:30 LT on all the beams. The QP echo altitudes are lower by about 10 km than those previ-ously observed by the MU radar (e.g. Yamamoto et al., 1991; Ogawa et al., 2002). The minimum altitude is about 90 km, which enables us to compare the behavior of the 557.7-nm airglow and FAIs at around 96 km (horizontal lines in the figure). In fact, an ionogram taken at 20:00 LT at Shigaraki indicates a very strong Es (foEs of about 13 MHz) at alti-tudes lower than 100 km (not shown). The slopes of the echo striations in the RTI plots are positive (i.e. the echo regions move away from the radar with time) before 20:40 LT for beam 1, 20:45 LT for beam 3, and 20:50 LT for beam 5, and negative after these times. Now we assume that a high-density plasma blob, in which 3.2-m FAIs are embedded, has a short altitude extent and a horizontal extent narrower than the radar beam width (4.5◦). Then Fig. 2 tells us that when the blob motion has a northward (southward) component, the radar detects an echo striation with positive (negative) slope,
200 180 160 140 Range (km) 180 160 140 200 180 160 220 Altitude (km) 120 110 100 90 80 100 0 -50 -100 50 Vel. (m/s)
MU Doppler Velocity (SNR > 0 dB) 5 August 2002 Beam 1 (a)
22 23
Local Time (hours)
20 19 21 200 130 120 110 100 90 80 130 120 110 100 90 80 130 (c) (b) Beam 5 Beam 3
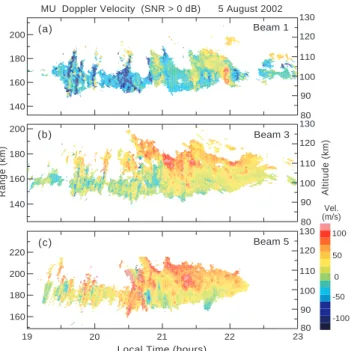
Fig. 6. Range-time-Doppler velocity plots of MU radar echoes with
SNRs higher than 0 dB on beams 1, 3 and 5. Plus (minus) sign of Doppler velocity represents motion away from (toward) the radar.
by allowing the geomagnetic aspect sensitivity to be not so severe. Relying on this and consulting with Fig. 1, we esti-mate that the radar echo regions moved approxiesti-mately to the NE before about 20:45 LT and to the SE after that. In fact, the neutral wind observed by FPI (Fig. 4b) was ENE before 20:30 LT, and thereafter changed slowly its direction toward the south. This suggests that the meridional winds control the striations of QP echoes; namely, the northward (southward) wind produces positive (negative) range rate (Pan and Tsun-oda, 1999). The wind had an eastward component during 20:00–22:30 LT when the QP echoes were observed.
The temporal variations of the absolute airglow intensity (I558) at around 96 km altitude shown in Fig. 4a are overlaid
in Fig. 5. From a comparison of the radar echoes and I558,
we point out that on beam 3 (and beam 2; not shown) the altitudes where the echo intensity is high go up and down in harmony with the enhancement and subsidence of I558,
respectively, though such a behavior is not always clear on beams 1, 4 (not shown), and 5.
Figure 6 shows range-time-Doppler velocity plots of the MU radar echoes with SNRs higher than 0 dB on beams 1, 3 and 5 on the night of 5 August. The Doppler velocity (Vd), i.e. the motion of FAIs along radar beam, is given as the first moment of a Doppler spectrum of FAIs. The plus (minus) sign of Vd represents motion away from (toward) the radar. The Vdvalues are less than ±150 m/s. Roughly speaking, the
Vdsigns are negative before 21:30 LT and positive thereafter for beam 1 (Fig. 6a), negative/positive before about 21:00 LT and positive thereafter for beam 3 (Fig. 6b), and almost pos-itive for beam 5 (Fig. 6c). These facts, together with Fig. 1, tells us that the velocity vectors of FAI drifts generally have
-100 0 Doppler Velocity (m/s) ( ) -50 50 20 -10 10 -20 557.7 nm Deviation (%) ( ) 100 21 20 22 23
Local Time (hours)
0 5 August 2002 Beam 1 Beam 5 Beam 3 (a) (c) (b) Echo Intensity (dB) ( ) 0 50 10 20 30 40 -100 0 -50 50 100 -100 0 -50 50 100 0 50 10 20 30 40 0 50 10 20 30 40 20 -10 10 -20 0 20 -10 10 -20 0
Fig. 7. Temporal variations of echo intensity, Doppler velocity, and
deviation of 557.7-nm airglow intensity (1I558) at around 96 km altitude (white circles in Fig. 1) on beams 1, 3 and 5.
an eastward component, being qualitatively consistent with the motions of the bright 557.7-nm airglow region (Fig. 4a), neutral winds (Fig. 4b), and FAI region (Fig. 5). It is clear that the Vd values on beams 3 and 5 after about 21:00 LT increase gradually with altitude: this is also true for beam 4 (not shown).
Using the Vd data from all the radar beams, we estimated a vector of FAI motion (V ) in the horizontal plane. To this end, we calculated Vdaveraged over 20:00–23:00 LT for al-titudes above 100 km and below that for each beam. Then, assuming that Vd is a projection of V along the radar beam, we obtained V above 100 km (V1) and below that (V2). The
results show that V1is 70 m/s with an azimuth of 66◦
(clock-wise from geographic north), and V2 is 53 m/s with an
az-imuth of 88◦(eastward). V2deviates not only from the
mo-tion of the airglow structures at around 96 km (toward SE at about 40 m/s) but also from the neutral wind motions there (toward ENE–SSE at 20–50 m/s in Fig. 4b), maybe because
Vdbelow the 100- km altitude is determined by both E×B
electron drift velocity and neutral winds.
Figure 7 shows temporal variations of echo intensity, Vd, and 1I558 at around 96 km altitude (white circles in Fig. 1)
on three radar beams. As is also seen in Fig. 6, Vdis negative (toward the radar) for beam 1 (Fig. 7a), and mostly positive (away from the radar) for beams 3 (Fig. 7b) and 5 (Fig. 7c), again suggesting the eastward movement of FAIs. As stated before, 1I558 fluctuates with periods of 10 min–1 h. Such
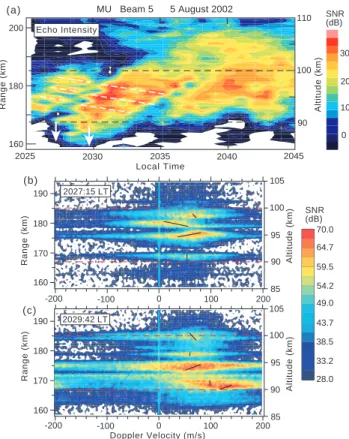
2396 T. Ogawa et al.: QP radar echoes and 557.7-nm airglow Range (km) 110 100 90 Altitude (km) MU Beam 5 5 August 2002 SNR (dB) 200 160 180 Echo Intensity 0 10 20 30 2035 2025 2030 2040 2045 Local Time (a) Altitude (km) 100 90 95 105 85 180 170 160 Range (km) 190 43.7 54.2 49.0 64.7 SNR (dB) 70.0 59.5 28.0 33.2 38.5 Doppler Velocity (m/s) 0 -100 -200 100 200 180 170 160 Range (km) 190 Altitude (km) 100 90 95 105 85 (b) (c) 0 -100 -200 100 200 2027:15 LT 2029:42 LT
Fig. 8. (a) Range-time-intensity plot of MU radar echoes on beam
5. Range variation of Doppler spectrum at time indicated by an arrow in (a): (b) 20:27:15 LT and (c) 20:29:42 LT. Plus (minus) sign of Doppler velocity represents motion away from (toward) the radar. Solid lines in (b) and (c) connect the peak position of each spectrum
.
fluctuations are also discerned in the echo intensity and Vd, suggesting these parameters are modulated by common at-mospheric disturbances.
The RTI plot between 20:25 and 20:45 LT in Fig. 5c is enlarged in Fig. 8a, where, as indicated by the white dashed-lines, some small-scale QP structures, embedded within the positive striations, with both high echo intensity and weakly negative striation, can be seen between 20:25 and 20:37 LT at altitudes of 87–100 km. This feature means that the eastward-moving plasma blob causing the positive striation includes some small-scale plasma structures that move to-ward the radar. Range variations of the Doppler spectra ob-tained at around 20:27 and 20:30 LT are displayed in Figs. 8b and c, respectively. In each figure there are four echo bands with a range separation of about 3 km, corresponding to the altitude separation of about 2 km. The Vd values at around 96 km altitude are between +40 and +80 m/s, being higher than the FPI winds (eastward ∼ 30 m/s) in Fig. 4b. Interest-ingly, very high Vd of about 120 m/s appears at 90 km alti-tude in Fig. 8c. Relying on that Vd at this altitude is almost equal to neutral wind speed because of the high collision fre-quency between electrons and neutrals, we can conclude that very strong neutral winds exceeding 100 m/s existed in a
lo-cal area at 90 km altitude. The solid lines in Figs. 8b and c connect the peak position of each spectrum. As can be seen, the range (altitude) profiles of Vdexhibit strong shears, which may be due to AGWs with sheared wind profiles.
4 Discussion
The results are summarized as follows:
1. MU radar QP echoes were observed at altitudes of 90– 110 km before midnight on 5 August 2002. The min-imum altitude (90 km) of the QP echoes was lower by 10 km than that of QP echoes previously observed by the MU radar, which made it possible to compare di-rectly the behavior of 3.2-m FAIs, 557.7-nm airglow, and neutral winds at around 96 km altitude.
2. Motion of QP echo regions had an eastward compo-nent. This motion was consistent with the motions of neutral wind, airglow structures, and FAIs. Slopes of QP echo striations in RTI plots were positive before about 20:45 LT and negative after that. This change was caused by a change in the neutral wind direction from ENE to SE.
3. During the QP echo event, airglow intensity at 96 km al-titude was enhanced up to 400 R, indicating an increase in the atomic oxygen density of 26%. The motion of the enhanced airglow region had an eastward component of about 65 m/s, which was consistent with the motion of airglow structures toward SE at about 40 m/s. Echo alti-tudes clearly went up and down in harmony with an en-hancement and subsidence of airglow intensity, respec-tively.
4. Airglow structures with periods of 10 min to 1 h moved to SE at about 40 m/s. Echo intensity and Doppler ve-locity of FAIs at around 96 km altitude also fluctuated with these periods.
5. Some QP echo regions contained small-scale QP struc-tures with a range separation of 3 km (altitude sepa-ration of about 2 km). Doppler spectra of the small-scale structures indicate that FAI velocities at around 96 km altitude (+40−+80 m/s) were higher than FPI wind (∼30 m/s), and that very strong neutral winds ex-ceeding 100 m/s existed in a local area at around 90 km altitude. Range (altitude) profiles of Vd exhibit strong shears.
The present QP echo event is a rare case because it is known that MU radar QP echoes before midnight usually appear above 100 km altitude (e.g. Yamamoto et al., 1991; Ogawa et al., 2002). In fact, the MU radar observations on the nights of 28 July to 6 August (except for 4 August) during the SEEK–2 campaign showed that the QP echoes appeared more or less on all the nights, and that the altitudes of typ-ical QP echoes before midnight were always above 100 km, except for the 5 August case.
Regarding the second result finding, the movements of QP echo regions that have been observed by the MU radar are mostly toward SW (e.g. Yamamoto et al., 1994, 1997; Ogawa et al., 1995, 2002). Such a movement has also been detected by the HF and VHF radars in Tanegashima during SEEK–2 (Saito et al., 2005) and at other locations (e.g. Hy-sell et al., 2004; Hussey et al., 2004; Tsunoda et al., 2004 and references therein). In the present case, however, the QP echo regions moved to the east. This movement is con-sistent with the results from the simultaneous observations of Doppler velocity, airglow structures, and neutral wind, which suggests that the Es-layers, including the 3.2-m FAIs, moved together with the neutral wind. Monitoring of some FM-broadcasting circuits at Wakkanai (northernmost part of Japan) indicated that the Es-layers at around 40◦N on the night of 5 August moved to the east (S. Saito, private com-munication). Ogawa et al. (1995) reported a case study in which QP echo regions first moved to the east and then to the west. The eastward neutral wind at around 96 km, above which a thin Esis located (as inferred from Fig. 5), together with speculated westward winds above Es, is suitable for the generation of Es through the well-known wind-shear mech-anism.
Cosgrove and Tsunoda (2002) predicted that a mid-latitude Es at a zonal wind-shear node is unstable at night to plane wave distortions. In the Northern Hemisphere the growth rate of the instability is positive (negative) for wave phase fronts with azimuthal alignment in the NW–SE (NE– SW) direction, and zero for phase fronts aligned E–W or N–S (Tsunoda et al., 2004). Then Cosgrove and Tsunoda (2003) showed results from numerical simulations confirming this azimuth-dependent Es instability (see also Yokoyama et al., 2004a). The southwestward movement of QP echo regions with phase fronts aligned NW–SE has been documented in many papers, and seems consistent with the theory of Cos-grove and Tsunoda (2002). However, our QP echoes on 5 August moved to the east, perhaps with phase front align-ment in the N–S direction, which seems unsuitable for the Cosgrove and Tsunoda theory.
The Vd values were mostly less than ±150 m/s (Fig. 6). FAIs can be generated by the gradient-drift instability un-der the combined action of an electric field and electron den-sity gradient, the two-stream instability due to strong elec-tric field, or a wind-driven gradient-drift instability. Vd of FAIs produced through the gradient-drift instability is slower than the E×B electron drift velocity by a factor (1+ψ ), where ψ =νeνi/ωeωi; νe(νi)is the electron (ion) collision frequency and ωe(ωi) is the electron (ion) cyclotron fre-quency (e.g. Tanaka and Venkateswaran, 1982). This factor increases rapidly with decreasing altitude; 0.01 at 108 km, 0.1 at 100 km, 1.0 at 93 km, and 10 at 87 km. Hence, Vd ob-served at altitudes lower than, say, 100 km does not always represent the electron drift velocity: see Ogawa et al. (2002) in detail. The very high Vd values exceeding 100 m/s at 90 km altitude (item 5) were observed only on beam 5 but not on other beams (Fig. 6) and are perhaps caused by local-ized, high-speed neutral winds. Very strong neutral winds
exceeding 100 m/s at around 90 km altitude were also ob-served by Larsen (2000b). Our FPI, however, which is most sensitive to the 557.7-nm airglow at around 96 km and can observe winds averaged over a large area above Shigaraki, could not detect such a strong wind in a local area at 90 km. Urbina et al. (2004) believe that the gradient-drift instabil-ity mechanism does not play a primary role in the generation of low-altitude (∼92 km) radar echo regions drifted at about 100 m/s although a secondary gradient-drift process is prob-ably the cause of Bragg-scale electron density waves.
The eastward movement of the isolated bright airglow re-gion is interesting (item 3). We suppose that the eastward neutral winds, which accompany vertical wind shears to form
Es, transported an enhanced [O] from the west to the east, and that this region included an upward (downward) wind component to raise (lower) the altitude of the wind-shear node, namely, the QP echo altitudes.
Regarding the fourth result finding, past QP echo observa-tions demonstrated that the radar echo intensity and Doppler velocity of FAIs usually fluctuates in space and time, perhaps due to AGWs in the neutral atmosphere (e.g. Ogawa et al., 1995). In this paper we have first showed that the temporal and spatial fluctuations of the echo intensity and Doppler ve-locity associated with QP echoes have counterparts in those of the 557.7-nm airglow in the lower thermosphere. Short-period AGWs causing these fluctuations may come from the lower atmosphere, as has first been demonstrated in nu-merical simulations by Horinouchi (2004). Moreover, re-cent simulations by Yokoyama et al. (2004b) have shown that AGWs from below modulate an Es to produce wave-like patterns (QP structures) of plasma density, and that southwestward-propagating gravity waves can create the QP echo structures whose phase fronts align from NW to SE, consistent with Cosgrove and Tsunoda’s theory (2002). The Yokoyama et al. (2004b) simulations suggest that eastward-propagating AGWs from below are saturated/dissipated at a critical level, located below a wind-shear node, due to the eastward wind. These eastward-propagating AGWs may ac-count for the south-eastward propagating airglow patterns at 96 km altitude below the Es-layer. Analyzing OI and OH airglows and E-region FAI data from Tanegashima (about 700 km southwest of Shigaraki) during SEEK–2, Onoma et al. (2005) conclude that the gravity waves seen in the airglow images during FAI events propagated mostly southeastward, which is consistent with our case.
Another candidate for the generation of QP-like echo pat-terns is the Kelvin-Helmholtz (K-H) instability caused by a sheared neutral wind profile (e.g. Larsen, 2000a, 2000b; Bernhardt, 2002), which does not always require a preferred phase front alignment of echo regions. Bernhardt (2002) have demonstrated from numerical simulations how K-H neutral turbulence evolves nonlinearly to modulate an Es -layer and plasma density in and around Es. The vortex struc-tures (“K-H billows”) seen in the simulations may account for the fluctuations of airglow intensity, QP echo intensity, QP echo altitudes, and Doppler velocity of FAIs. Sripathi et al. (2003) suggested the K-H instability as a possible source
2398 T. Ogawa et al.: QP radar echoes and 557.7-nm airglow for the daytime QP echoes in the lower E-region.
Short-period AGWs that interact with an Esmay form the QP struc-tures (e.g. Kagan, 2002). We need more investigations to know which process, K-H billows, AGWs from below, etc., is the primary cause for the fluctuations of the parameters that we observed.
Our fifth result finding strongly suggests that two kinds of atmospheric waves, one causing the positive QP stria-tions and the other causing the negative striastria-tions in an RTI plot, might exist in the same region. At this stage we do not know the generation mechanism of these low-altitude echoes, though some hints have been given by Urbina et al. (2004).
5 Conclusions
On the night of 5 August 2002 during the SEEK–2 cam-paign, we made, for the first time, coordinated observations of QP radar echoes, lower thermospheric OI 557.7-nm air-glow, and neutral winds in a common volume over Shigaraki. The QP echoes appeared at altitudes of 90–110 km, which were lower by 10 km than usual QP echo altitudes, enabling us to study the relationship among FAIs, short-period atmo-spheric disturbances, and neutral winds at around 96 km alti-tude. The QP echo regions moved toward the east, contrary to the southwestward movements that have been often ob-served by the MU radar and radars at other locations. Tem-poral and spatial fluctuations of echo intensity and Doppler velocity associated with the QP echoes had counterparts in those of the 557.7-nm airglow at around 96 km in the lower thermosphere.
The eastward movement of the QP echo regions was con-sistent with the motions of neutral winds, airglow structures, and FAIs, a very reasonable result expected when the elec-trodynamics of the Es is mainly controlled by the neutral atmospheric dynamics. During the QP echo event, 1) air-glow intensity at 96 km altitude was enhanced up to 400 R (increase of 26% in [O]), 2) the enhanced airglow region moved to the east, and 3) radar echo altitudes clearly went up (down) in harmony with the airglow enhancement (subsi-dence). These facts suggest that the enhanced airglow region included an upward (downward) wind component to raise (lower) the altitude of the wind-shear node, i.e. of the Es -layer. The airglow intensity, echo intensity, and Doppler ve-locity of FAIs at around 96 km altitude fluctuated with peri-ods from 10 min to 1 h, indicating that these parameters were modulated by common atmospheric disturbances. To under-stand the detailed physical relation between the fluctuations of FAIs and airglow, and the primary cause for the generation of QP structures, we need more coordinated observations of radar echoes, airglow, and neutral winds.
Interestingly, some QP echo regions below 100 km altitude contained small-scale QP structures in which very strong neutral winds exceeding 100 m/s existed. These strong winds may be due to short-period AGWs.
Acknowledgements. The MU radar belongs to and is operated by
the Research Institute for Sustainable Humanosphere, Kyoto Uni-versity. This work was supported by Grant-in-Aid for Scientific Re-search (11440145) and the 21st Century COE Program (Dynamics of the Sun-Earth-Life Interactive System, No.G-4) of the Ministry of Education, Culture, Sports, Science and Technology of Japan.
Topical Editor M. Pinnock thanks B. P. Rao and J. M. Rosado-Roman for their help in evaluating this paper.
References
Bernhardt, P. A.: The modulation of sporadic-E layers by Kelvin-Helmholtz billows in the neutral atmosphere, J. Atmos. Sol-Terr. Phys., 64, 1487–1504, 2002.
Cosgrove, R. B. and Tsunoda, R. T.: A direction-dependent instabil-ity of sporadic-E layers in the nighttime midlatitude ionosphere, Geophys. Res. Lett., 29(18), 1864, doi:10.1029/2002GL014669, 2002.
Cosgrove, R. B. and Tsunoda, R. T.: Simulation of the nonlin-ear evolution of the sporadic-E layer instability in the nighttime midlatitude ionosphere, Geophys. Res. Lett., 108(A7), 1283, doi:10.1029/2002JA009728, 2003.
Fukao, S., Yamamoto, M., Tsunoda, R. T., Hayakawa, H., and Mukai, T.: The SEEK (Sporadic-E Experiment over Kyushu) campaign, Geophys. Res. Lett., 25, 1761–1764, 1998.
Haldoupis, C., Schlegel, K., and Farley, D. T.: An explanation of type I radar echoes from the midlatitude E-region ionosphere, Geophys. Res. Lett., 23, 97–1000, 1996.
Horinouchi, T., Nakamura, T., and Kosaka, J.: Convec-tively generated mesoscale gravity waves simulated through-out the middle atmosphere, Geophys. Res. Lett., 29(21), 2007, doi:10.1029/2002GL016069, 2002.
Horinouchi, T.: Simulated breaking of convectively generated mesoscale gravity waves and airglow modulation, J. Atmos. Sol-Terr. Phys., 66, 755–767, 2004.
Huang, C. S. and Kelley, M. C.: Numerical simulations of grav-ity wave modulation of midlatitude sporadic E layers, Geophys. Res. Lett., 101, 24 533–24 543, 1996.
Hussey, G. C., Haldoupis, C., Bourdillon, A., Delloue, J., and Wiensz, J. T.: Mid-latitude E-region bulk motions inferred from digital ionosonde and HF radar measurements, Ann. Geophys., 22, 3789–3798, 2004,
SRef-ID: 1432-0576/ag/2004-22-3789.
Hysell, D. L., Larsen, M. F., and Zhou, Q. H.: Common volume co-herent and incoco-herent scatter radar observations of mid-latitude sporadic E-layers and QP echoes, Ann. Geophys., 22, 3277– 3290, 2004,
SRef-ID: 1432-0576/ag/2004-22-3277.
Iwagami, N., Shibagaki, T., Suzuki, T., Sekiguchi, H., Takegawa, N., and Morrow, W. H.: Rocket experiment of atomic oxygen density and airglow emission rate in the WAVE2000 campaign, J. Atmos. Sol-Terr. Phys., 65, 1349–1364, 2003.
Kagan, L. M. and Kelley, M. C.: A wind-driven gradient drift mech-anism for mid-latitude E-region ionospheric irregularities, Geo-phys. Res. Lett., 25, 4141–4144, 1998.
Kagan, L. M., Ogawa, T., Fukao, S., and Yamamoto, M.: A role of neutral motions in formation of midlatitude E-region field-aligned irregularities, Geophys. Res. Lett., 27, 939–942, 2000. Kagan, L. M.: Effects of neutral gas motion on midlatitude E region
irregular structure, J. Atmos. Sol-Terr. Phys., 64, 1479–1486, 2002.
Larsen, M. F.: A shear instability seeding mechanisms for quasiperiodic radar echoes, J. Geophys. Res., 105, 24 931– 24 940, 2000a.
Larsen, M. F.: Coqui 2: mesospheric and lower thermospheric wind observations over Puerto Rico, Geophys. Res. Lett., 27, 445–448, 2000b.
Mathews, J. D.: Sporadic E: current views and recent progress, J. Atmos. Sol-Terr. Phys., 60, 413–435, 1998.
McDade, I. C., Murtagh, D. P., Greer, R. G. H., Dickinson, P. H. G., Witt, G., Stegman, J., Llewellyn, E. J., Thomas, L., and Jenkins, D. B.: ETON2: Quenching parameters for the proposed precur-sors of O2(b16+g) and O(1S) in the terrestrial nightglow, Planet. Space Sci., 34, 789–800, 1986.
Ogawa, T., Yamamoto, M., and Fukao, S.: Middle and upper atmo-sphere radar observations of turbulence and movement of mid-latitude sporadic E irregularities, J. Geophys. Res., 100, 12 173– 12 188, 1995.
Ogawa, T., Sekito, N., Nozaki, K., and Yamamoto, M.: Height com-parison of midlatitude E region field-aligned irregularities and sporadic E layer, Geophys. Res. Lett., 25, 1813–1816, 1998. Ogawa, T., Takahashi, O., Otsuka, Y., Nozaki, K., Yamamoto, M.,
and Kita, K.: Simultaneous middle and upper atmosphere radar and ionospheric sounder observations of midlatitude E region ir-regularities and sporadic E layer, J. Geophys. Res., 107(A10), 1275, doi:10.1029/2001JA900176, 2002.
Onoma, F., Otsuka, Y, Shiokawa, K., Ogawa, T., Yamamoto, M., Fukao, S., and Saito, S.: Relationship between propagation di-rection of gravity waves in OH and OI airglow images and VHF radar echo occurrence during the SEEK-2 campaign, Ann. Geo-phys., 23, 2385–2390, 2005.
Pan, C. J. and Tsunoda, R. T.: Semidiurnal behavior of quasi-periodic echoes in the midlatitude Es region observed with the Chung-Li VHF radar, Geophys. Res. Lett., 26, 2621–2624, 1999. Pfaff, R., Yamamoto, M., Marionni, P., Mori, H., and Fukao, S.: Electric field measurements above and within a sporadic-E layer, Geophys. Res. Lett., 25, 1769–1772, 1998.
Rao, P. B., Yamamoto, M., Uchida, A., Hassenpflug, I., and Fukao, S.: MU radar observations of kilometer-scale waves in the mid-latitude lower E-region, Geophys. Res. Lett., 27, 3667–3670, 2000.
Saito, S., Marumoto, M., Yamamoto, M., Fukao, S., and Tsunoda, R. T.: Radar observations of field-aligned plasma irregularities in the SEEK–2 campaign, Ann. Geophys., 23, 2307–2318, 2005. Seyler, C. E., Rosanda-Rom´an, J. M., and Farley, D. T.: A non-local theory of the gradient-drift instability in the ionospheric
E-region plasma at mid-latitudes, J. Atmos. Sol-Terr. Phys., 66, 1627–1637, 2004.
Shiokawa, K., Katoh, Y., Satoh, M., Ejiri, M. K., Ogawa, T., Naka-mura, T., Tsuda, T., and Wiens, R. H.: Development of optical mesosphere thermosphere imagers (OMTI), Earth Planets Space, 51, 887–896, 1999.
Shiokawa, K., Kadota, T., Ejiri, M. K., Otsuka, Y., Katoh, Y., Satoh, M., and Ogawa, T.: Three-channel imaging Fabry-Perot interfer-ometer for measurement of midlatitude airglow, Appl. Opt., 40, 4286–4296, 2001.
Sripathi, S., Patra, A. K., Sivakumar, V., and Rao, P. B.: Shear insta-bility as a source of the daytime quasi-periodic radar echoes ob-served by the Gadanki VHF radar, Geophys. Res. Lett., 30(22), 2149, doi:10.1029/2003GL017544, 2003.
Tanaka, T. and Venkateswaran, S. V.: Characteristics of field-aligned E-region irregularities over Iioka (36◦N), Japan-I, J. At-mos. Terr. Phys., 44, 381–393, 1982.
Tsunoda, R. T., Cosgrove, R. B., and Ogawa, T.: Azimuth-dependent Es layer instability: A missing link found, J. Geophys. Res., 109, A12303, doi:10.1029/2004JA010597, 2004.
Urbina, J., Kudeki, E., Franke, S. J., Gonzalez, S., Zhou, Q., and Collins, S. C.: 50 MHz radar observations of mid-latitude E-region irregularities at Camp Santiago, Puerto Rico, Geophys. Res. Lett., 27, 2853–2856, 2000.
Urbina, J., Kudeki, E., Franke, S. J., and Zhou, Q.: Anal-ysis of a mid-latitude E-region LQP event observed during the Coqui 2 Campaign, Geophys. Res. Lett., 31, L14805, doi:10.1029/2004GL020031, 2004.
Wakabayashi, M., Ono, T., Mori, H., and Bernhardt, P. A.: Electron density and plasma wave measurement in mid-latitude sporadic-E layer observed during the Ssporadic-Esporadic-EK–2 campaign, Ann. Geophys., 23, 2335–2345, 2005.
Yamamoto, M., Fukao, S., Woodman, R. F., Ogawa, T., Tsuda, T., and Kato, S.: Mid-latitude E-region field-aligned irregular-ities observed with the MU radar, J. Geophys. Res., 96, 15 943– 15 949, 1991.
Yamamoto, M., Fukao, S., Ogawa, T., Tsuda, T., and Kato, S.: A morphological study of mid-latitude E-region field-aligned ir-regularities observed with the MU radar, J. Atmos. Terr. Phys., 54, 769–777, 1992.
Yamamoto, M., Komoda, N., Fukao, S., Tsunoda, R. T., Ogawa, T., and Tsuda, T.: Spatial structure of the E region field-aligned irregularities revealed by the MU radar, Radio Sci., 29, 337–347, 1994.
Yamamoto, M., Fukao, S., Tsunoda, R. T., Igarashi, K., and T. Ogawa, T.: Preliminary results from joint measurements of E-region field-aligned irregularities using the MU Radar and the frequency-agile radar, J. Atmos. Sol-Terr. Phys., 59, 1655–1663, 1997.
Yamamoto, M., Fukao, S., Tsunoda, R. T., and Hayakawa, H.: SEEK–2 (Sporadic-E Experiment over Kyushu II) – Project out-line and significance, Ann. Geophys., 23, 2295–2305, 2005. Yokoyama, T., Yamamoto, M., Fukao, S., and Cosgrove, R. B.:
Three-dimensional simulation on generation of polarization elec-tric fields in the midlatitude E-region ionosphere, J. Geophys. Res., 109(A01309), doi:10.1029/2003JA010238, 2004a. Yokoyama, T., Horinouchi, T., Yamamoto, M., and Fukao, S.:
Mod-ulation of the midlatitude ionospheric E region by atmospheric gravity waves through polarization electric field, J. Geophys. Res., 109, A12307, doi:10.1029/2004JA010508, 2004b. Yokoyama, T., Yamamoto, M., and Fukao, S.: Numerical
simula-tion of midlatitude ionospheric E region based on the SEEK and the SEEK–2 observations, Ann. Geophys., 23, 2377–2384, 2005.