HAL Id: insu-01300836
https://hal-insu.archives-ouvertes.fr/insu-01300836
Submitted on 11 Apr 2016
HAL is a multi-disciplinary open access
archive for the deposit and dissemination of
sci-entific research documents, whether they are
pub-lished or not. The documents may come from
teaching and research institutions in France or
abroad, or from public or private research centers.
L’archive ouverte pluridisciplinaire HAL, est
destinée au dépôt et à la diffusion de documents
scientifiques de niveau recherche, publiés ou non,
émanant des établissements d’enseignement et de
recherche français ou étrangers, des laboratoires
publics ou privés.
Atlas in northern Morocco: hydrological implications
Olivier Dauteuil, Frédérique Moreau, Khaoula Qarqori
To cite this version:
Olivier Dauteuil, Frédérique Moreau, Khaoula Qarqori. Structural pattern of the Saïss basin and
Tabular Middle Atlas in northern Morocco: hydrological implications. Journal of African Earth
Sciences, Elsevier, 2016, 119, pp.150-159. �10.1016/j.jafrearsci.2016.04.001�. �insu-01300836�
Structural pattern of the Saïss basin and Tabular Middle Atlas in northern Morocco: hydrological implications
O. Dauteuil, F. Moreau, K. Qarqori PII: S1464-343X(16)30108-X DOI: 10.1016/j.jafrearsci.2016.04.001
Reference: AES 2537
To appear in: Journal of African Earth Sciences
Received Date: 27 July 2015 Revised Date: 31 March 2016 Accepted Date: 1 April 2016
Please cite this article as: Dauteuil, O., Moreau, F., Qarqori, K., Structural pattern of the Saïss basin and Tabular Middle Atlas in northern Morocco: hydrological implications, Journal of African Earth Sciences (2016), doi: 10.1016/j.jafrearsci.2016.04.001.
This is a PDF file of an unedited manuscript that has been accepted for publication. As a service to our customers we are providing this early version of the manuscript. The manuscript will undergo copyediting, typesetting, and review of the resulting proof before it is published in its final form. Please note that during the production process errors may be discovered which could affect the content, and all legal disclaimers that apply to the journal pertain.
M
AN
US
CR
IP
T
AC
CE
PT
ED
1
2
Structural pattern of the Saïss basin and Tabular Middle Atlas in
3
northern Morocco: hydrological implications
4
5
6
O. Dauteuil1, F. Moreau1, K. Qarqori2
7
1) UMR-CNRS 6118 Géosciences Rennes, University of Rennes 1, 35042 Rennes cedex, France
8
2) Earth Sciences Department, Faculty of Sciences, Moulay Ismail University, 11201 Zitoune 50000, Meknes,
9
Morocco10
11
Abstract12
The plain of Saïss is a fertile area of great agricultural production with major economic interests. Therefore, the
13
improved knowledge about the water supply is imperative within a context of recurrent droughts and
14
overexploitation of the groundwater. This plain is located in the Meknes-Fes basin and between two deformed
15
domains: the Rif and Middle Atlas. The aquifers are fed by water coming from the Tabular Middle Atlas, for
16
which the pathways are poorly constrained. This study provides new data to determine the water pathways based
17
on a structural map produced from a novel analysis of SPOT images and a digital elevation model. This
18
structural map reveals two fracture sets trending NE-SW and NW-SE. The first set is well known and
19
corresponds to a main trend that controlled the tectonic and stratigraphic evolution of the study area. On the
20
other hand, the NW-SE set was poorly described until now: it is both diffuse and widespread on the Tabular
21
Middle Atlas. A comparison between the regional water flow trend, drainage pattern and structural map shows
22
that the NW-SE fractures control the water flow from the Tabular Middle Atlas to the Saïss plain. A
23
hydrological model is discussed where the water flow is confined onto Liassic carbonates and driven by NW-SE
24
fractures. This study explains how a detailed structural mapping shows hydrology constraints.
25
Keywords: structural map, SPOT images, DEM, water circulation
26
27
1-
I
NTRODUCTION28
The Atlas chains developed from the inversion of the Jurassic rift or transtensional basins as a
29
consequence of continental convergence between Africa and Europe during the Cenozoic. The mountain ranges
30
are associated with high seismic activity revealing intense deformation and defining several domains with their
M
AN
US
CR
IP
T
AC
CE
PT
ED
own history and structures (Chalouan et al., 2014). These domains are separated into less-deformed
32
intraorogenic basins (Bargach et al., 2004; Barbero et al., 2011) (Fig. 1). The Saïss plain, associated with the
33
Meknes-Fes basin, is one of these intraorogenic basins that separates the Rif orogen from the Middle Atlas.
34
Terrigenous sediments, with ages ranging from the Miocene to the Pleistocene, fill this basin, which was isolated
35
during the Miocene. The southern and northern limits correspond to thrusts that were active during the Late
36
Miocene (Piqué et al., 2002; Frizon de Lamotte et al., 2011), and the Alpine convergence is usually assumed to
37
have only slightly affected the basin. This unusual behaviour should be investigated to understand The regional
38
structural analysis provided by SPOT images and digital elevation model (DEM) can be used to complete the
39
existing data set.
40
The Meknes-Fes basin is a wide plain of major economic interest because of intense agriculture and the
41
location of great cultural and touristic sites in the imperial cities of Fes and Meknes. All these human activities
42
require large water resources that come from two aquifers: one that is deep in the Liassic units and a second
43
shallow one in the Plio-Pleistocene deposits. The poor remediation of water rejected into the rivers (Perrin et al.,
44
2014) imposes the use of water in the deep aquifer. The Tabular Middle Atlas, with a higher topography and
45
higher rainfall, mainly supplies the two aquifers. Water flow connections between these two domains remain
46
poorly constrained and must be investigated to improve the management of water resources in this region. The
47
water pathways are controlled by several parameters including the rock porosity, lithology, fracture pattern and
48
structure layering. However the investigation to determine these pathways is complex and requires combined
49
approaches. Thus, we propose to use surface structural mapping based on by SPOT images and DEM
50
interpretation, combined with drainage pattern and hydrological information, to determine the potential water
51
pathways.
52
53
2-
G
EOLOGICAL AND HYDROLOGICAL SETTINGS54
2.1- Geological framework
55
The Middle Atlas and Rif mountains represent two major structural domains in northern Morocco that
56
are separated by the Fes-Meknes basin (Fig. 1). The Middle Atlas shows two different geomorphic areas
57
(Barcos et al., 2014): a northwest domain with tabular relief (the Tabular Middle Atlas or TMA), and a
58
northeast-southwest domain with a mountainous relief linked to the High Atlas. The TMA represents a key area
59
for the water supply of the Saïss plain associated with the Fes-Meknes basin. The TMA is a large karstic
60
reservoir from which water flows out to the plain. However, the water circulation paths are not precisely
61
constrained, and this is one of the aims of this study.
62
The TMA has a roughly flat topography at an elevation of 1100 m on the western side while the eastern
63
side is higher (1400 m) and more incised. NE-SW linear and long valleys and NW-SE short valleys shaped the
64
topography (Fig. 2). The western flat part is sparsely covered by vegetation while the eastern mountainous part
65
is largely covered by vegetation, mainly forests. The southern border of the TMA corresponds to erosion scarp
66
that forms a window on the basement of the TMA. To the north of the TMA, the Saïss basin forms a plain with
67
a total surface area of 2,100 km² and northward regional tilting: 850 m in the south and 525 m in the north, i.e.
68
an approximate regional slope of 1%. To the NE of the plain, the Fes sub-basin has a flat morphology that is
69
70
M
AN
US
CR
IP
T
AC
CE
PT
ED
sides, while there are very few rivers in the middle and southern parts. The main streams trend NSW and
E-71
W (Fig. 2). The Saïss plain and the TMA have the same geological evolution until the Cenozoic. Triassic
72
evaporites unconformably cover the Palaeozoic basement that was deformed during the Hercynian orogeny.
73
During the Liassic opening of the Tethysian Ocean, carbonates (limestones and dolomites) with significant
74
thicknesses were deposited. In the study area, this extension trends NW-SE, which generated NE-SW blocs
75
controlling the deposit centres. Then, a large depositional gap occurred until the Neogene and the evolution of
76
the TMA and Saïss basin diverged (Ennadifi, 1975; Arboleya et al., 2004; Amraoui, 2005; Qarqori et al., 2012).
77
During the Late Miocene, the Fes-Meknes basin in the north became a deep marine trough trending NE-SW and
78
filled with a thick sequence of shales with turbidites (Charroud et al., 2007; Bachiri Taoufiq et al., 2008). Then,
79
a main environmental change occurred during the Plio-Quaternary generating the depositional context, evolving
80
from lacustrine to fluvial with lacustrine limestone, conglomerate and sandstone deposits. This change resulted
81
in a general uplift of the whole study area. Also, the deposit of a significant amount of travertine on the northern
82
edge of the TMA should be noted (Chamayou et al., 1975). Since the late Miocene, the TMA became a horst
83
that was emerged until now. The Liassic carbonates were largely weathered, generating a large karstic plateau
84
with the emergences of springs at the junction with the Saïss basin. During the Pleistocene, the plateau was
85
locally covered by alkaline basalt lava flows coming from the Outgui volcano and flowing to the Saïss plain
86
into the pre-existing valley. A recent GPS study (Chalouan et al., 2014) reveals that the contact between the two
87
domains is affected by a slow divergence associated with normal faults with a dextral slip component, trending
88
NE–SW.
89
The TMA displays two fault sets: one trending NE-SW corresponding to the main faulted zones that are
90
well known in the Rif domain and in the Middle Atlas (Morel, 1989, Aït Brahim and Chotin, 1989; Aït Brahim
91
et al., 2002; Frizon de Lamotte et al., 2009; Vergés and Fernandez, 2012) and a second one oriented NW-SE that
92
has been less described (Amraoui, 2005). This latter trend is locally described in the Middle Atlas, Rif ranges
93
(Aït Brahim et al., 2002) and Alboran basin (Vergés and Fernandez, 2012). The main NE-SW faulted corridors
94
located on the TMA did not affect these recent basaltic flows. The structural framework of the Saïss basin is
95
poorly defined because of the vegetation cover. Morel (1989), Aït Brahim and Chotin (1989), Amraoui (2005),
96
Aït Brahim et al. (2002), and Frizon de Lamotte et al. (2009) described a set of NE-SW features for which the
97
locations and types have been debated: normal faults, strike-slip faults or flexures.
98
2.2- Hydrological context
99
The water supply for human activities in the Saïss plain comes from three locations: a shallow aquifer
100
located in the Plio-Pleistocene sediments, a deep aquifer located within the Liassic dolomites and limestone, and
101
springs located on the boundary between the TMA and the plain. Although rainfall mainly feeds the shallow
102
aquifer, the deep aquifer is filled both by infiltration coming from the surface water and by deep circulations of
103
water coming from the TMA (Amraoui, 2005; Belhassan, 2011). The recharge of aquifer located inside the Saïss
104
basin is largely controlled by precipitation occurring in the TMA (Amraoui, 2005; Belhassan, 2011). The high
105
elevations of the TMA favour rainfall that penetrates inside the Liassic dolomite karst. The rainfall can reach
106
1000 mm/yr close to Ifrane, which is twice as high as in the plain (550 mm at Meknes, for instance). In the Atlas
107
plateau, the surface run-off is restricted because of the presence of fractures and dissolution sinks forming the
108
karst system at depth. The water primarily flows northward and comes out of the base of the TMA through
M
AN
US
CR
IP
T
AC
CE
PT
ED
several springs mainly located between the area of Ribaa and Bittit (Bentayeb and Leclerc 1977). Essahlaoui et
110
al. (2001) and Qarqori et al. (2012) used a geo-electrical tomography survey to explore the structural pattern at
111
the junction between the TMS and the plain, close to the Bittit spring (Fig. 2). These geophysical surveys
112
established a structural framework for the deep aquifer located in the Liassic formation. Qarqori et al. (2012)
113
pointed out northward to north-westward water circulations in the Bittit spring through sub-vertical fractures and
114
horizontal joints. However the fracture pattern driving the water flow has not been described in classical
115
structural work. We propose to carry out a complete structural investigation to better constrain the water
116
circulation filling the aquifers.
117
118
3-METHODOLOGY AND DATA
119
The first step of this study is to create the most comprehensive map possible of the structures
120
affecting the area. Then the map is compared to local hydrogeological data to propose which deep and connected
121
features are potential water drains. We focus more specifically on regional features, which connect the TMA to
122
the Saïss plain. In the studied region, remote data such as satellite images or DEM provide widespread coverage
123
that can be used to integrate the whole aquifer system from the filling area to the aquifer. The proposed
124
methodology is based on a coupling between the analysis of the satellite imagery (SPOT images) and DEM data
125
in order to extract pertinent lineations that may be related to the surface geology and not to human activities. The
126
DEM was processed using the LandSerf software (version 2.3.1) developed by J. Wood. This kind of structural
127
map is classically used in addition to field observations to infer the deformation history of a region. We improve
128
the use of this map by comparing it to pre-existing hydrological work. Different processing techniques for the
129
satellite images that are particularly adapted to extract hydrogeological information are proposed. These maps
130
and the hydrological data were integrated into a GIS (QuantumGIS) and were interpreted by coupling the
131
different images produced.
132
133
3.1- Satellite images
134
Satellite images are powerful data to map geological objects over large areas. However, the vegetation
135
masks the structural pattern in several places. In order to cover the entire Saïss plain region, seven SPOT images
136
(Figs. 3 and 4) were used with a pixel size ranging from 2.5 m to 10 m and with different spectral modes (see the
137
more detailed technical description in Table 1 and locations in Figure 3). We restricted the image processing to
138
classical methods that can be used to extract structures: dynamic stretching, contrast enhancements (Fig. 4) and
139
edge detections. We focused on methods extracting linear objects that can be interpreted as structural features
140
(fractures, faults, schistosity and stratas). The edge extraction was done with Sobel filters composed of four
141
diagonal matrixes of 5x5 pixels corresponding to the N-S, E-W, NE-SW and NE-SW directions, respectively
142
(Fig. 5). These different calculations reveal several lineaments and features that are more visible on the TMA
143
and more discrete on the plain of Saïss. These differences can be attributed to the vegetation, the development of
144
which is largely controlled by human activities in the plain compared to the TMA, to the lithology of the
145
basement (carbonate versus terrigenous sediment, respectively) and to the deformation history, which is different
146
in the two domains. By combining the results provided by SPOT images with DEM interpretations, the
147
differences due to human activities and to vegetation can be filtered out.
M
AN
US
CR
IP
T
AC
CE
PT
ED
3.2- Digital topography149
The relief provides information about geology because it is sensitive to the structure (fault, strata
150
orientation) and to differential erosion induced by the lithological contrast. The digital topography can be
151
processed to extract structural data (Dauteuil, 1995). We used SRTM DEM with a pixel size of 30 m to analyse
152
the pattern of the topography and to extract features that will be compared to those coming from the analysis of
153
the SPOT images (Fig. 3). The plain of Saïss displays a relatively flat morphology, and consequently we used
154
geomorphic indexes to extract the structural and geological features that were subsequently correlated to the
155
features mapped from the SPOT images. To extract the structural features, we used both the usual processing
156
techniques, such as shaded images with different light directions (Fig. 6), and slope calculations (Fig. 7)
157
(Dauteuil, 1995). We analysed the average slopes at different scales by estimating the azimuth and dip of a mean
158
plane supported by points belonging to a moving window. The best-adjusted plane was calculated by a least
159
squares fitting. Two windows were calculated: a small one (2.5 x 2.5 km) for the smaller scale and a large one
160
(7.5 x 7.5 km) for the larger scale. The result of this slope analysis will be compared to the drainage pattern
161
because of the strong a priori correlation between the water flows and slope direction. Finally, the feature
162
network including the channel, isolated peaks and topographic ridges was extracted (Fig. 8) via processing with
163
the LandSerf GIS software (Fisher et al., 2004; Wood, 2013).
164
4-
R
ESULTS165
4.1- Interpretation of the SPOT images
166
The SPOT images show large differences in the radiometric pattern between the TMA, Palaeozoic
167
basement and plain. The Palaeozoic basement shows well-defined ridges trending at N030° with sparse
168
vegetation (shown in red in the pseudo-colour image – Fig. 4). The TMA displays various radiometric types: the
169
dark red colour corresponds to forests; the medium grey colour indicates volcanic flows and the heterogeneous
170
grey-to-red areas delineate a mixture between grass and rock. Conversely to the basement, no main organized
171
features are noticeable on the TMA, except in the NE part where wide and narrow linear valleys trend at N030°.
172
Close to the border with the plain, some narrow and short valleys are oriented approximately N300°. In the Saïss
173
plain, the radiometric pattern is very heterogeneous with several small patches of various colours (light grey,
174
dark grey, white and red) with regular shapes. This pattern is driven by human activities (crop field, roads,
175
farms, etc.). There is no main organization or linear feature, except for a tiny NW-SE-oriented trend associated
176
with farming and small rivers, especially in the north of the plain, around the town of Meknes.
177
The results of the contour detection techniques confirm and highlight the previously described structural
178
characteristics. Figure 5 provides representative zooms of two different Sobel processing operations with the
179
dominant features. The direction of the lineaments in the TMA is relatively homogeneous compared to the
well-180
shaped basement and fined-shaped plain. NNE-SSW features are well extracted on the basement in the south and
181
in the TMA, while they are scarcer in the plain. A NW-SE trend dominates the structural pattern of the plain: the
182
features are thin and close to each other. In addition, some NE-SW linear features are localized in corridors that
183
have the same trend (upper image in Fig. 5). A large number of extracted lineaments are associated with farm
184
fields. The MNT analysis must be used together with this SPOT contour image to identify the anthropogenic
M
AN
US
CR
IP
T
AC
CE
PT
ED
lineaments. The combined analysis of remote images and DEM allow geological lineaments to extract. This
186
NW-SE direction is scarcely reported in field studies while it appears clearly on satellite images.
187
4.2- Topography analysis
188
The topography that is less sensitive to the vegetation may constitute powerful complementary data to
189
extract tectonic features. The shaded images (Fig. 6) and slope calculations at different scales (Figs. 7a and 7b)
190
display different relief patterns in the Palaeozoic basement, TMA and Saïss plain. Regardless of the scale, the
191
Saïss plain has the gentlest slopes with highest values organized into narrow bands trending NW-SE and
WNW-192
ESE, corresponding to permanent or semi-permanent rivers and to local anomalies on the topographic surface.
193
As expected, the rugged relief of the TMA shows the highest values coming from elevated relief relative to the
194
surrounding areas and the tectonics, seen both on the slope and in the shaded images. The slopes are mainly
195
organized into NE-SW bands, except to the NE of El Hajeb where the TMA border displays NW-SE short
196
valleys. The Palaeozoic basement clearly shows NE-SW reliefs with high slopes separated by narrow flat plains.
197
At local scales, the slopes (2.5 x 2.5km window) do not display well-organized azimuth trends: the slopes plunge
198
roughly perpendicular to the relief with a maximum toward the N to NNE. At a more regional scale (7.5 x 7.5
199
km window), the slopes gradually plunge northward in the south to westward in the plain with a maximum
200
trending NW. The Rif area shows slopes plunging NE to ENE. We compare the slope plunge to the river
201
drainage direction in Figure 7: the river streams mainly trend N-S and NW-SE. These trends are slightly
202
different by 10° from the maximum slope plunge, indicating that the regional slope partially drives the river
203
trends and that another process should be inferred as a consequence (Fig. 7).
204
The geomorphic structure network (Fig. 8) confirms the difference in morphology patterns between the
205
TMA, plain and Rif domain. The structure network is denser in the TMA and Palaeozoic basement than in the
206
Saïss plain. In the plain, ridges are almost absent near the TMA while they are well developed in the NW part
207
around the town of Meknes where they separate into channels, i.e. drains. The channels in the plain display a
208
dendritic pattern close to the TMA border and long streams in the middle of the plain. Topographic ridges are
209
absent on the southern border of the plain. This change in drainage pattern corresponds to a change in drainage
210
direction from NNW-SSE to NW-SE. These changes in the drainage pattern characteristics and the limit of the
211
topographic ridges correspond to a NE-SW trending band (Fig. 8) that separates the Saïss plain into two
212
domains: the NW part and SE part. On the border with the TMA, a lot of drains are associated with springs
213
located on the mid-slope of the relief between the two domains. In the TMA, the drainage pattern corresponds to
214
an irregular dendritic pattern with well-nested topographic ridges and channels. The channels and ridges have
215
short and wavy segments. The main and longer channels trend NE-SW.
216
5- Interpretations
217
5.1- Structural pattern
218
The combined interpretation of the SPOT images and topography allows us to produce a structural map
219
to establish the tectonic relationships between the TMA and plain (Fig. 9). The analysis also reveals that the
220
structural pattern of the study area is driven by two perpendicular sets of lineaments: NE-SW and NW-SE.
M
AN
US
CR
IP
T
AC
CE
PT
ED
The NE-SW structures dominate the shape of the TMA: they correspond to well-known features in the
222
Atlas domain and Rif domain (Morel, 1989, Aït Brahim and Chotin, 1989; Aït Brahim et al., 2002; Frizon de
223
Lamotte et al., 2009; Vergés and Fernandez, 2012). They affect the entire area, and some corridors display more
224
fractures generating long valleys with a flat bottom. The displacements along these features cannot be
225
determined from this analysis because of the lack of well-defined markers. However, the geomorphic shape of
226
these features indicates both vertical and horizontal components in agreement with previous studies (Aït Brahim
227
et al., 2002; Arboleya et al., 2004; Bargach et al., 2004; Frizon de Lamotte et al., 2009). This work points out
228
that NE-SW features localized into restricted corridors affected the plain of Saïss (Fig. 9). These latter corridors
229
were previously described as bends by Fassi (1999) and Amaraoui (2005): the Toudal bend, Koudiart Zouarl
230
bend, Souk Jemad El Gour bend and Boufekrane - Haj Kaddour bend. These features drive the orientation and
231
type of drainage network, and correspond to discontinuous slope breaks. This direction was active since the
232
Triassic and controlled the Triassic to middle Jurassic deposits (Piqué et al., 2002; Frizon de Lamotte, 2009) and
233
the Miocene filling of the Saïss basin (Essahlaoui et al., 2000; 2001; Amaraoui, 2005). This structural set is
234
partially imaged at depth with seismic profiles (Zizi, 2002) displaying a fault inside the Cenozoic deposits that is
235
in agreement with stratigraphic correlations from boreholes (Charroud et al., 2007). Electrical surveys
236
(Essalahoui et al., 2000) highlight a NW-SE structural trend that is well-organized at depth (4 km).
237
The NW-SE structural set was found in the whole study area with various patterns. In the TMA, it is
238
diffuse and associated with narrow V-shape valleys. In some places, these features offset NE-SW structures
239
indicating a strike-slip component. This trend is less described than the NE-SW features. Aït Brahim and Chotin
240
(1989) and Vergés and Fernandez (2012) suggest strike-slip fault zones accommodating deformation transfer.
241
The plain of Saïss is affected by tiny and diffuse NW-SE fractures. This deformation is widespread over the
242
plain and corresponds to a set of short segments compared to the NE-SW band, which has longer and localized
243
segments. The fractures of the NW-SE band control some permanent and semi-permanent rivers to the south of
244
the town of Meknes. Close to the TMA, this set is not systematically associated with drainage features. In the
245
depression of Fes, deformation appears to be less intense and less widespread. The associated features
246
correspond to changes in the slope and with small rivers. The structural set was previously poorly described
247
because it corresponds to a pattern of widespread fracturing that can be observed at the outcrop scale (Qarqori et
248
al., 2011). The geophysical surveys did not describe this in depth, probably because it corresponds to diffuse
249
features that are difficult to image with classical geophysical methods. However, an electrical survey (Essalahoui
250
et al., 2002; Essahlaoui and El Ouali, 2003) displays anomalies trending NW-SE at 100 and 1000 m in the
251
western part of the Saïss basin, fitting with this structural trend. Thus, the NW-SE features detected at the
252
surface are present at depth.
253
254
5.2- Deformation timing
255
A deformation timing can be advanced from geological arguments and from the new observations
256
coming from this study. First of all, the two sets of structures did not affect the volcanic flows dated as late
257
Quaternary or the Pleistocene sediments; however, they do affect the Pliocene deposits, revealing that they
258
occurred at the end of the Pliocene. The relative chronology between the two fracture sets can be determined
M
AN
US
CR
IP
T
AC
CE
PT
ED
locally where the NW-SE fractures offset the NE-SW features. At the regional scale, the contact between the
260
TMA and the Saïss basin trends NE-SW, and it is often locally offset by NW-SE faults. Therefore, the NW-SE
261
features were generated after the NE-SW features. These faulted zones have been previously described (Aït
262
Brahim et al., 2002; Piqué et al., 2002; Arboleya et al., 2004) and seem to control, at least partially, the
263
depositional centres and deformation in these areas since the Late Triassic (Jabour et al., 2004; Frizon de
264
Lamotte et al., 2009). They were interpreted as resulting from the reactivation of the Liassic fault systems during
265
the different Mio-Pleistocene events. During the Late Miocene, this fault set played a major role in the
266
generation of horsts and grabens. The larger horst is the TMA, which was isolated from the Saïss basin by a
267
major normal fault (Aït Brahim et al., 2002). The elevated topography of the TMA was acquired at this time
268
because no marine shales were described on this plateau. Inside the basin, the normal NE-SW faults confined
269
several depositional centres with variable thicknesses. The deformation period corresponds to a NW-SE
270
stretching. During the Pliocene, they were reactivated as steep thrusts probably with a strike-slip component
271
(Bargach, et al., 2004; Charroud et al., 2007). This change in fault kinematics is consecutive to a rotation of the
272
regional stresses. This deformation is not still very active because many of the features were sealed by lava flows
273
and travertines during the Middle to Late Pleistocene.
274
The diffuse deformation generated late NW-SE features. This deformation is recent and happened
275
during a short event. It partially controlled the erosion of the TMA by generating short valleys and the new
276
setting of the rivers in the basin, especially around the town of Meknes. The deformation is associated with a
277
NE-SW stretching and is compatible with the NW-SE to N-S trends of compression described by Bargach et al.
278
(2004). The genesis of these feature sets favoured the location of a new drainage pattern, which was formed
279
during a base level fall. This change in drainage reorganization corresponds to the palaeogeographic drying of
280
the Pleistocene lake after a fast withdrawal compatible with the base level fall.
281
5.3- Hydrogeological outcomes
282
This work determined the fracturing pattern of the study area in order to propose which structure set is
283
the most efficient to drain water from the TMA to the plain. We will investigate the possible structural
284
pathways: the two fracture sets described before, and the stratigraphic layering, which corresponds to horizontal
285
or sub-horizontal drains located both in the TMA and in the Fes-Meknes basin (Fig. 1). The most significant
286
difficulty is to extrapolate 2D surface data to the 3D connected deep network. Due to the lack of geophysical
287
surveys at the regional scale, we used indirect observations.
288
The first-order field evidence of water circulation coming from the TMA is the presence of many springs
289
located at the junction between the TMA and the plain (Fig. 10), close to the unconformity between the
290
dolomitic karst and the Palaeozoic basement (Zarhloule, et al. 2001; Amraoui 2005). They are mainly gathered
291
in two places: west of El-Hajeb and west of Ain Bittit (Fig. 10). The springs around Ain Bittit are located in the
292
area where the topographic transition between the TMA and plain is smooth compared to other places. This area
293
is also characterized by recent deposits of travertine that are absent in other places on the northern border of the
294
TMA (Ennadifi, 1975). The superposition of the springs on the fracturing map reveals that they are clearly
295
located in the continuation of the NW-SE features of the TMA, and not in the continuation of the NE-SW
M
AN
US
CR
IP
T
AC
CE
PT
ED
features. This result is in agreement with the interpretation of Qarqori et al. (2012), who proposed that NW-SE
297
fractures are the main water drains.
298
The TMA is mainly composed of Liassic karst affected by NE-SW fault-driven corridors and NW-SE
299
widespread features. The two features affect the Mesozoic units at depth and could be drains for the circulation
300
of water. These drains can favour both rainfall percolations at depth, because their sub-vertical dip, and lateral
301
water connectivity at depth. This work points out that the NW-SE structures drive the lateral connectivity at
302
depth and favour karst development by increasing the carbonate dissolution generating the karstic caves. Two
303
hypotheses are proposed to explain the low connectivity of the NE-SW features: 1) they either juxtapose blocks
304
with contrasted porosity, or 2) they are sealed with clay coming from the Miocene shales. Amraoui (2005) and
305
Belhassan (2011) conducted a detailed analysis of the hydrology of the deep aquifer both in the TMA and the
306
plain. Based on a large piezometer dataset, these authors built a map of the depth of the water table and deduced
307
a northward flow of the water (Fig. 10). They proposed flow lines for which the trends are perfectly compatible
308
with the water circulations along the NW-SE features both in the TMA and the plain of Saïss.
309
Figure 11 illustrates a model of water circulation from the TMA to the Neogene basin of Fes-Meknes
310
taking into account both the previously described hydrological data and the new structural pattern stemming
311
from this work. The precipitation occurring on the elevated relief of the TMA percolate into the Liassic
312
dolomites across a fracture drain. A Triassic clay layer above the unconformity with the basement confines the
313
circulation into the carbonate layers. The northward general dip of the stratigraphic layers of the TMA drives a
314
northward migration of the water confined in the carbonate layers. The northern margin of the TMA is formed
315
by a set of blocks of Mesozoic units limited by faults (Chalouan et al., 2014). These blocks collapse toward the
316
deepest parts of the basin. The vertical throw along the normal faults is low enough to not disconnect the water
317
paths to the basin. In addition to this regional pattern, the drainage is driven by NW-SE fractures that constitute a
318
widespread network both in the TMA and in the basin. The combination of the regional faults trending NE-SW
319
and the NW-SE fracture set generates a complex pattern of blocks that are more or less disconnected depending
320
on the fault throws.
321
322
6- Conclusions
323
This study proposes a model of structural relationships between the Saïss basin and Tabular Middle
324
Atlas. It points out the efficiency of combining an analysis using both SPOT images and DEM to propose a
325
structural map. Two fault sets were extracted: a well-known one trending NE-SW and a new one oriented
NW-326
SE, both affecting the TMA and the basin. The NE-SW structures correspond to faulted corridors in the TMA
327
and tiny flexures in the basin, initiated during a NW-SE extension occurring in the Late Miocene and
328
corresponding to reactivated Liassic faults. The NW-SE structures correspond to a diffuse and ubiquitous
329
deformation that affected the whole study area. This direction of deformation is clearly visible on satellite
330
images after processing on the slope map of the MNT, while it was somewhat identified in previous studies on
331
the region. These fracture sets control the dissolution of carbonates in the TMA forming the karst network and
332
the development of the drainage pattern in the plain. We examined the consequences of this structural pattern in
333
terms of hydrology, especially for the water connectivity between the TMA and the basin. A comparison with
M
AN
US
CR
IP
T
AC
CE
PT
ED
hydrological data reveals that these NW-SE features constitute the main connectivity for the deep-water
335
circulations from the TMA to the basin. At least, we propose that water pathways are connected via diffuse
336
fracture porosity rather than by a localized drainage system. This study highlights the fact that a study combining
337
classical structural methods and hydrological data may significantly constrain the hydrology of an area.
338
339
Acknowledgments:
340
The work is part of the IRD program CORUS II that was funded by the Foreign Office of the French
341
government. The Spot images were acquired using the ISIS program supported by CNES, SPOT Image and
342
IGN. The cooperation program CNRS France/CNR Morocco funded the field trips. We thank the two reviewers
343
and the editor whose comments improved the initial manuscript.
344
345
M
AN
US
CR
IP
T
AC
CE
PT
ED
346
Figure Captions.347
Figure 1: Location of the study area. a) Location map with the topography of northern Morocco, b) 3D view of
348
the study area using Google Earth (image data: Google, DigitalGlobe) with the main morpho-structural
349
units (red lines), c) N-S geological cross-section showing the different units.
350
Figure 2: Simplified geological map of the study area modified from a geological map (Ennadifi, 1975 and
351
Amraoui 2005).
352
Figure 3: Map of the study area with the data used in this study. The red squares identify the SPOT images with
353
the index number in the red tag. The relief map in the background is taken from the SRTM database with a
354
pixel size of 90 m.
355
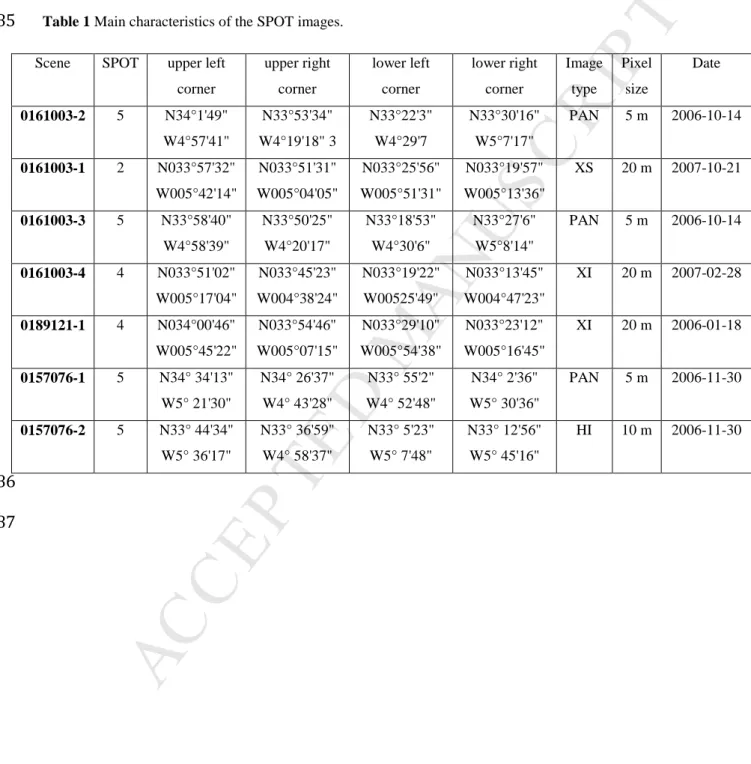
Figure 4: Mosaic of the SPOT images used in this study. Table 1 summarizes the main characteristics.
356
Figure 5: Extraction of the contours based on the convolution techniques carried out using a diagonal matrix
357
(Sobel filters). To better illustrate the processing, we only display two zooms of the two Sobel processing
358
operations. Upper image: zoom of the middle part of the Saïss plain showing a NE-SW lineament
359
highlighted by a N-S diagonal matrix. Middle image: zoom of the NE-SW lineaments of the TMA
360
extracted with a NW-SE diagonal matrix.
361
Figure 6: Shaded images of the topography: a) light coming from the north, b) light coming from the east.
362
Figure 7: Distribution of the slopes at different scales. The adjusted plane was calculated in window of varying
363
sizes (grey grid): a- 2.5 x2.5 km, b-7.5x7.5 km. The red lines indicate the trend and the relative value of the
364
slope. On the left side, we plot: i) the polar diagrams of the azimuth versus the plunge of the slope and ii)
365
the rose diagrams of the slope directions (in red) and river orientations (in blue).
366
Figure 8: Topographic surface network. The ridges in yellow and the channels in blue were extracted from the
367
DEM with the Landserf software using a method developed by Wood (2000) and Schneider and Wood
368
(2004). This processing technique well illustrates the contrasted topography between the plain and the
369
TMA. It can be used to distinguish between several domains in the plain with different ridge and channel
370
networks.
371
Figure 9: Structural map of the detected features on the right with a shaded relief as the background. In the left
372
column, a half rose diagram of the fault orientation. The lower diagram in the left column displays the
373
length distribution of the features.
374
Figure 10: Water pathways and fractures in the study area. The contour of the water table and the theoretical
375
water flows are taken from Amraoui (2005) and Belhassan (2011). The deep water circulates toward the
376
northwest. The flow direction fits with the NW-SE features both in the TMA and in the Saïss basin. The
377
spring locations come from the geological map and from Amraoui (2005) and Belhassan (2011).
M
AN
US
CR
IP
T
AC
CE
PT
ED
Figure 11: Schematic section of the TMA and Saïss plain showing the inferred hydrological relationships
379
between the three aquifers: the karst of the TMA, the superficial free aquifer and the deep confined aquifer
380
of the plain. The water circulation coming from the karst of the TMA is driven both by regional faults
381
trending NE-SW and by a widespread fracture trending NW-SE. The two structural sets generate a complex
382
pattern inside the basin making it difficult to implement the drilling.
383
384
Table 1 Main characteristics of the SPOT images.
385
Scene SPOT upper left corner upper right corner lower left corner lower right corner Image type Pixel size Date 0161003-2 5 N34°1'49" W4°57'41" N33°53'34" W4°19'18" 3 N33°22'3" W4°29'7 N33°30'16" W5°7'17" PAN 5 m 2006-10-14 0161003-1 2 N033°57'32" W005°42'14" N033°51'31" W005°04'05" N033°25'56" W005°51'31" N033°19'57" W005°13'36" XS 20 m 2007-10-21 0161003-3 5 N33°58'40" W4°58'39" N33°50'25" W4°20'17" N33°18'53" W4°30'6" N33°27'6" W5°8'14" PAN 5 m 2006-10-14 0161003-4 4 N033°51'02" W005°17'04" N033°45'23" W004°38'24" N033°19'22" W00525'49" N033°13'45" W004°47'23" XI 20 m 2007-02-28 0189121-1 4 N034°00'46" W005°45'22" N033°54'46" W005°07'15" N033°29'10" W005°54'38" N033°23'12" W005°16'45" XI 20 m 2006-01-18 0157076-1 5 N34° 34'13" W5° 21'30" N34° 26'37" W4° 43'28" N33° 55'2" W4° 52'48" N34° 2'36" W5° 30'36" PAN 5 m 2006-11-30 0157076-2 5 N33° 44'34" W5° 36'17" N33° 36'59" W4° 58'37" N33° 5'23" W5° 7'48" N33° 12'56" W5° 45'16" HI 10 m 2006-11-30
386
387
M
AN
US
CR
IP
T
AC
CE
PT
ED
References:388
389
Aït Brahim, L., Chotin, P., Hinajc, S., Abdelouafia, A., El Adraouia, Nakcha, C., Dhont, D., Charroud, M.,
390
Sossey Alaoui, F., Amrhar, M., Bouaza, A., Tabyaoui, H., Chaouni, A. 2002. Paleostress evolution in the
391
Moroccan African margin from Triassic to Present. Tectonophysics 357, 187–205.
392
393
Amraoui, F., Razack, M., Bouchaou, L., 2004. Comportement d’une source karstique soumise à une sécheresse
394
prolongée : la source Bittit (Maroc). C. R. Geoscience. 336, 1099–1109.
395
396
Amraoui, F. 2005. Contribution à la connaissance des aquifères kartiques : cas du Lias de la plaine de Saïs et du
397
Causse moyen atlasique tabulaire (Maroc), Faculté des Sciences. Université Hassan II Ain Chock,
398
Casablanca, pp. 249.
399
400
Arboleya, M.L., Teixell, A., Charroud, M., Julivert, M., 2004. A structural transect through the High and Middle
401
Atlas of Morocco. Journal of African Earth Sciences. 39, 319–327.
402
403
Bachiri Taoufiq, N., Barhoun, N., Suc, J.-P., 2008. Les environnements continentaux du corridor rifain (Maroc)
404
au Miocène supérieur d’après la palynologie. Geodiversitas. 30, 41-58.
405
406
Barbero, L., Jabaloy, A., Gómez-Ortiz, D., Pérez-Peña, J.V., Rodríguez-Peces, M.J., Tejero, R., Estupiñán, J.,
407
Azdimousa, A., Vázquez, M., Asebriy, L., 2011. Evidence for surface uplift of the Atlas Mountains and the
408
surrounding peripheral plateaux: Combining apatite fission-track results and geomorphic indicators in the
409
Western Moroccan Meseta (coastal Variscan Paleozoic basement). Tectonophysics. 502, 90–104.
410
411
Barcos, L., Jabaloy, A., Azdimousa, A., Asebriy, L., Gómez-Ortiz, D., Rodríguez-Peces, M.J., Tejero, R.,
Pérez-412
Peña, J.V. 2014. Study of relief changes related to active doming in the eastern Moroccan Rif (Morocco)
413
using geomorphological indices, Journal of African Earth Sciences, 100, 493-509,
414
415
Bargach, K., Ruano, P., Chabli, A., Galindo-Zaldivar, J., Chalouan, A., Jabaloy, A., Akil, M., Ahmamou M.,
416
Sanz de Galdeano, C., Benmakhlouf, M., 2004. Recent Tectonic Deformations and Stresses in the Frontal
417
Part of the Rif Cordillera and the Saı ̈ss Basin (Fes and Rabat Regions, Morocco). Pure applied geophysics.
418
161, 521–540.
419
420
Belhassan, K., 2011. Hydro-Geological Context of Groundwater Mikkes and Different Variations of its Springs
421
Flows (Morocco). Research Journal of Earth Sciences. 3, 15-26.
422
423
Bentayeb, A., Leclerc, C., 1977. Le Causse moyen- atlasique, in: Editions du Service Géologique du Maroc
424
(Ed.), Ressources en Eau du Maroc, 37-84.
425
426
Chalouan, A., Gil,A.J., Galindo-Zaldívar, J., Ahmamou M., Ruano, P., de Lacy, M.C., Ruiz-Armenteros,A.M.,
M
AN
US
CR
IP
T
AC
CE
PT
ED
Benmakhlouf, M., Riguzzi, F. 2014. Active faulting in the frontal Rif Cordillera (Fes region, Morocco):
428
Constraints from GPS data, Journal of Geodynamics, 77, 110-122.
429
430
Chamayou, J., Combe, M., Genetier, B., Leclerc, C., 1975. Le bassin de Meknès-Fè , in: Maroc, E.d.S.G.o.d.
431
(Ed.), Ressources en Eau du Maroc. 41-71.
432
433
Charroud, M., Cherai, B., Benabdelhadi, M., Falgere, C., 2007. Impact de la néotectonique Quaternaire sur la
434
dynamique sédimentaire du Saïs (Maroc) : du bassin d’avant fosse Pliocène au plateau continental
435
Quaternaire. Quaternaire. 18, 327-334.
436
437
Dauteuil, O.,1995. Fault pattern from Seabeam processing: the Western part of the Blanco fracture Zone (NE
438
Pacific). Mar. Geophys. Res. 17/1,17-35.
439
440
Ennadifi, M.Y., 1975. Carte Géologique du Maroc au 1/100000, 1975, Service Géologie du Maroc, Rabat.
441
442
Essahlaoui, A., Sahbi, H., El-Yamine, N., 2002. Application de la géophysique (method géoélectrique) à la
443
reconnaissance du plateau de Meknès. Geologica Belgica, 2000, 35-53
444
445
Essahlaoui, A., El Ouali, A., 2003. Détermination de la structure géologique de la partie Sud de la plaine du
446
Saiss (bassin de Meknes-Fes, Maroc) par la méthode géoélectrique. Bulletin of Engineering Geology and
447
the Environment, 62, 155-166
,
448
449
Essahlaoui, A., Sahbi, H., e, B.L., El-Yamine, N., 2001. Reconnaissance de la structure géologique du bassin de
450
Saïss occidental, Maroc, par sondages electriques. Journal of African Earth Sciences. 32 , 777-789.
451
452
Fassi, D., 1999. Les formations superficielles du Sais de Fès et de Méknès. Notes et mémoires du service
453
géologique. 389, pp. 527
454
455
Frizon de Lamotte, D., Leturmy, P., Missenard, Y., Khomsi, S., Ruiz, G., Saddiqi, O., Guillocheau, F., Michard,
456
A., 2009. Mesozoic and Cenozoic vertical movements in the Atlas system (Algeria, Morocco, Tunisia): An
457
overview. Tectonophysics. 475, 9–28.
458
459
Harmouzi, O., 2010. Reconnaissance détaillée de la partie nord-est du Bassin de Saïss (MAROC): interprétation
460
de sondages électriques verticaux par combinaison des méthodes statistique, géostatistique et d'inversion,
461
UFR: Geologie de surface et environnement. university of Moulay Ismail. pp. 323.
462
463
Jabour, N., Kasmi, M., Menzhi, M., Birouk, A., Hni, L., Hahou, Y., Timoulali, Y., Badrane, S., 2004. The
464
February 24 2004 Al Hoceima earthquake. European-Mediterranean Seismic Centre Newsletter. 21, 7-10.
465
466
M
AN
US
CR
IP
T
AC
CE
PT
ED
Perrin, J.L., Raïs, N., Chahinian, N., Moulin, P., Ijjaali, M. 2014. Water quality assessment of highly polluted
467
rivers in a semi-arid Mediterranean zone Oued Fez and Sebou River (Morocco), Journal of Hydrology, 510,
468
26-34,
469
470
Piqué, A., Tricart, P., Guiraud, R., Laville, E., Bouaziz, S., Amrhar, M., Aït Ouali, R., 2002. The Mesozoic–
471
Cenozoic Atlas belt (North Africa): an overview. Geodinamica Acta. 15, 85–208.
472
473
Qarqori, K., Rouai, M., Moreau, F., Saracco, G., Dauteuil, Hermitte, D., Boualoul, M., Le Carlier de Veslud, C.,
474
2012. Geo-electrical tomography investigating and modeling of fractures network around Bittit spring
475
(Middle Atlas, Morocco). International Journal of Geophysics. Pp. 13
476
477
Vergés, J., Manel Fernàndez, M. 2012. Tethys–Atlantic interaction along the Iberia–Africa plate boundary: The
478
Betic–Rif orogenic system Tectonophysics 579, 144–172
479
480
Wood, J. (2013) LandSerf 2.3, http://www.landserf.org
481
482
Zarhloule, Y., Lahrache, A., Ben Abidate, L., Khattach, D., Bour, S., Boukdir, A., Ben Dhia, H., 2001. La
483
prospection geothermique de surface au Maroc: hydrodynamisme, anomalies thermiques et indices de
484
surface. Journal of African Earth Sciences. 32, 851-867.
485
Zizi M. (2002) Triassic-Jurassic extrensional systems and their Neogene reactivation in northern morocco: the
486
rides Prerifaines and Guercif basin. Notes et mémoires du service géologique marocain, 416.