HAL Id: hal-01659863
https://hal.uca.fr/hal-01659863
Submitted on 8 Dec 2017
HAL is a multi-disciplinary open access
archive for the deposit and dissemination of
sci-entific research documents, whether they are
pub-lished or not. The documents may come from
teaching and research institutions in France or
abroad, or from public or private research centers.
L’archive ouverte pluridisciplinaire HAL, est
destinée au dépôt et à la diffusion de documents
scientifiques de niveau recherche, publiés ou non,
émanant des établissements d’enseignement et de
recherche français ou étrangers, des laboratoires
publics ou privés.
individuals with intellectual disability
Rihab Borji, Firas Zghal, Nidhal Zarrouk, Vincent Martin, Sonia Sahli,
Haithem Rebai
To cite this version:
Rihab Borji, Firas Zghal, Nidhal Zarrouk, Vincent Martin, Sonia Sahli, et al.. Neuromuscular fatigue
and recovery profiles in individuals with intellectual disability. Journal of Sport and Health Science,
Shanghai University of Sport and Elsevier, 2017, �10.1016/j.jshs.2017.03.015�. �hal-01659863�
Original article
Neuromuscular fatigue and recovery profiles in individuals with
intellectual disability
Rihab Borji
a,*
, Firas Zghal
a, Nidhal Zarrouk
a, Vincent Martin
b, Sonia Sahli
a, Haithem Rebai
a aEducation, Motor Skills, Sports and Health, Higher Institute of Sport and Physical Education of Sfax, University of Sfax, Sfax 3000, Tunisia bLaboratory of Metabolic Adaptations to Exercise in Physiological and Pathological Conditions, Blaise Pascal University, Clermont-Ferrand 63000, FranceReceived 28 September 2016; revised 1 January 2017; accepted 14 February 2017 Available online
Abstract
Purpose: This study aimed to explore neuromuscular fatigue and recovery profiles in individuals with intellectual disability (ID) after exhausting
submaximal contraction.
Methods: Ten men with ID were compared to 10 men without ID. The evaluation of neuromuscular function consisted in brief (3 s) isometric
maximal voluntary contraction (IMVC) of the knee extension superimposed with electrical nerve stimulation before, immediately after, and during 33 min after an exhausting submaximal isometric task at 15% of the IMVC. Force, voluntary activation level (VAL), potentiated resting twitch (Ptw), and electromyography (EMG) signals were measured during IMVC and then analyzed.
Results: Individuals with ID developed lower baseline IMVC, VAL, Ptw, and RMS/Mmaxratio (root-mean-square value normalized to the maximal peak-to-peak amplitude of the M-wave) than controls (p< 0.05). Nevertheless, the time to task failure was significantly longer in ID vs. controls (p< 0.05). The 2 groups presented similar IMVC decline and recovery kinetics after the fatiguing exercise. However, individuals with ID presented higher VAL and RMS/Mmaxratio declines but lower Ptw decline compared to those without ID. Moreover, individuals with ID demonstrated a persistent central fatigue but faster recovery from peripheral fatigue.
Conclusion: These differences in neuromuscular fatigue profiles and recovery kinetics should be acknowledged when prescribing training
programs for individuals with ID.
© 2017 Production and hosting by Elsevier B.V. on behalf of Shanghai University of Sport. This is an open access article under the CC BY-NC-ND license (http://creativecommons.org/licenses/by-nc-nd/4.0/).
Keywords: Central fatigue; Intellectual disability; Neuromuscular fatigue; Peripheral fatigue; Sustained sub-maximal exercise; Twitch interpolation technique
1. Introduction
Exercise related neuromuscular fatigue is defined as an exercise-related decrease in the maximal voluntary force or power of a muscle or of a muscle group. This decrease is generally associated with an increase in the perceived effort necessary to exert the desired force.1It can be estimated by the maximal force or power2decline or by the inability to sustain a required force level.3In this context, it has been demonstrated that individuals with low maximal force level such as women, the elderly, or children present longer time to task failure during sub-maximal exercises than individuals with high maximal force level.4–6
Neuromuscular fatigue is generally considered to be task-dependent.1
Specifically, exercise intensity and duration
determine the contribution of central and peripheral factors to neuromuscular fatigue.7Therefore, it has been well documented that muscle fatigue induced by sustained lower intensity con-tractions induced central fatigue rather than peripheral fatigue.8,9 Neuromuscular fatigue depends also on the initial voluntary activation level (VAL)10 that describes the neural drive of a muscle during voluntary contractions.11It has been demonstrated that individuals with poor ability to achieve full activation during a maximal voluntary contraction develop less peripheral fatigue10
and longer endurance time during a fatigu-ing protocol.12
It seems to be interesting to explore the neuromuscular fatigue profile of individuals with intellectual disability (ID) who exhibit lower VAL when compared to general population.13 ID is characterized by significant limitations both in intellectual functioning and in adaptive behavior, which covers a range of everyday social and practical skills.14
Generally, a full score at an intellectual quotient (IQ) of around 70 to 75 indicates that
Peer review under responsibility of Shanghai University of Sport. * Corresponding author:
E-mail address:borji-rihab1@hotmail.fr(R. Borji).
http://dx.doi.org/10.1016/j.jshs.2017.03.015
2095-2546/© 2017 Production and hosting by Elsevier B.V. on behalf of Shanghai University of Sport. This is an open access article under the CC BY-NC-ND license (http://creativecommons.org/licenses/by-nc-nd/4.0/).
Journal of Sport and Health Science xx (2017) 1–8
www.jshs.org.cn
Production and hosting by Elsevier
Available online at www.sciencedirect.com
ScienceDirect
the individual presents an ID. Moreover, these individuals present generally poor physical fitness and motor skills com-pared to individuals with typical development.15,16
Importantly, while it is well known that individuals with ID demonstrate lower maximal force17–19
than individuals with typical develop-ment, little is known about their neuromuscular fatigue profile. Zafeiridis et al.,19
reported a lower force decrement and a slower fatigue development in these individuals during maximal repeated knee extensions and flexions compared to controls. These authors found that individuals with ID presented a lower blood lactate accumulation after the fatiguing exercise.19 Because it has been found that the increased accumulation of by-products (lactate, H+) of anaerobic metabolism impairs the excitation-contraction coupling and cross-bridges formation,20 these authors suggested that the lower reliance on glycolytic metabolism for energy production in individuals with ID, as suggested by their lower lactate concentration, may possibly explain their lower muscle fatigue compared to controls.19 Con-versely, we previously reported a greater force and electromy-ography (EMG) activity declines in individuals with ID compared to individuals without ID after maximal repeated knee extensions and flexions.17We suggested that the higher strength decline observed in individuals with ID after this fatiguing exercise could be related to a greater neural activation deficiency probably resulting from the central nervous system anomalies characterizing these individuals.21,22
Nevertheless, direct evidence is still lacking to support this assumption, as no study has measured the VAL after a fatiguing exercise in indi-viduals with ID. Beyond the magnitude of neuromuscular fatigue, the ability to recover from a fatiguing task may have important implications in daily-life activities, as well as during occupational activities in individuals with ID.19
To date, the recovery ability of these individuals after a fatiguing exercise has never been explored.
Therefore, the aim of our study was to investigate the ability to sustain exhausting sub-maximal isometric contraction in individuals with ID compared to those with typical develop-ment and to explore the magnitude, the neuromuscular fatigue origin, and the subsequent recovery in these individuals. We hypothesized that individuals with ID would present a neuro-muscular fatigue profile, as well as a recovery kinetic, that differs from those of individuals with typical development. 2. Methods
2.1. Participants
The sample population consisted of 20 sedentary adults who had similar socioeconomic status and ethnicity. Ten men with ID (age: 23.1± 2.7 years; height: 1.7 ± 0.1 m; body mass: 77.9± 8.3 kg) participated in the study. All participants with ID suffered from a mild ID with an IQ (IQ= 60.0 ± 2.7) deter-mined by the Wechsler adult intelligence scale (WAIS-IV) test23 elaborated by the educational center psychologist. Participants with ID were recruited randomly from the National Union of Aid to Mental Insufficiency where they took part in a physical education session once a week. The sample did not include individuals with Down Syndrome or with multiple disabilities.
The informed written consent for the individuals with ID was provided by their parents or legal guardians. The control group consisted of 10 sedentary men without ID (age: 25.2± 2.7 years; height: 1.7± 0.1 m; body mass: 75.3 ± 9.2 kg), who practiced only leisure physical activities. The participants without ID provided written consent. The study excluded indi-viduals with metabolic diseases, as well as musculoskeletal, cardiac, and respiratory system diseases in order to avoid poten-tial influence of health factors on the outcome of the experiment.
The study was conducted in accordance with the Declaration of Helsinki and was approved by the Clinical Research Ethics Committee of the National Centre of Medicine and Sciences in Sport of Tunisia.
2.2. Study design
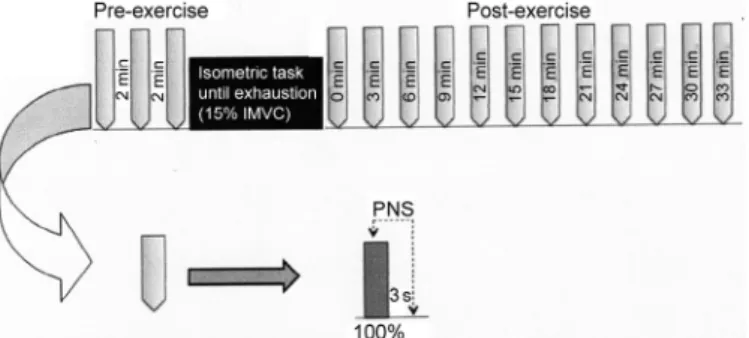
A familiarization session was performed 3 days before the experiment in order to familiarize participants with the experi-mental procedures. The experiment consisted of baseline mea-surements, followed by an exhausting exercise performed at 15% of isometric maximal voluntary contraction (IMVC), and follow-up measurements to describe the recovery profile after the exercise. The baseline measurements consisted of 3 brief (3 s) IMVC of the knee extensors superimposed with electrical stimulations. After the exercise, 12 brief (3 s) IMVC superim-posed with electrical stimulations were repeated every 3 min. The testing session was preceded by a warm-up consisting of several sub-maximal knee extensions (12–15 contractions) at a freely chosen intensity.
To evaluate the central and peripheral factors of the force production, electrical stimulations were delivered to the femoral nerve during the IMVC and 3 s after the contraction cessation. Force and EMG signals were measured during IMVC. To exclude the confounding effect of fatigue induced by repeated muscular contractions, IMVC trials were separated by a 3 min recovery period (Fig. 1).
2.3. Testing procedures and instrumentation 2.3.1. Force measurement
During testing, the participants were seated on an isometric dynamometer (Good Strength, Metitur, Finland) equipped with
Fig. 1. Schematic representation of the experimental protocol. To evaluate exercise-induced fatigue and recovery, 3 and then 12 repeated isometric maximal voluntary contractions (IMVC) superimposed and followed by peripheral nerve electrical stimulation (PNS) were performed before (pre-EX) and after fatiguing exercise (post-EX), respectively.
Please cite this article in press as: Rihab Borji, et al., Neuromuscular fatigue and recovery profiles in individuals with intellectual disability, Journal of Sport and Health Science (2017),
a cuff attached to a strain gauge. This cuff was adjusted ~2 cm above the lateral malleolus using a Velcro strap. The partici-pants stabilized themselves by grasping handles on the side of the chair during contractions. Safety belts were strapped across the chest, thighs, and hips to avoid lateral, vertical, and frontal displacements. All measurements were taken from the partici-pant’s dominant leg, with the hip and knee angles set at 90° from full extension (0°). All participants in our study presented the right leg as the dominant leg (determined by the leg used to kick a ball). Strong verbal encouragements were provided to the participants during the IMVC.
2.3.2. EMG recordings
The EMG signals of the vastus lateralis (VL), vastus media-lis (VM), and rectus femoris (RF) muscles were recorded using bipolar silver chloride surface electrodes (Blue Sensor N-00-S, Ambu, Denmark) during IMVC and stimulations. Following the surface EMG for the noninvasive assessment of muscles (SENIAM) recommendations,24 the recording electrodes were taped lengthwise on the skin over the muscle belly, with an inter-electrode distance of 20 mm and the reference electrode was attached to the patella. The sampling frequency was 2 kHz. Low impedance (Z< 5 kΩ) at the skin-electrode surface was obtained by shaving, abrading the skin with thin sand paper, and cleaning with alcohol. EMG signals were amplified (Octal Bio Amp ML 138; ADInstruments, Bella Vista, Australia) with a bandwidth frequency ranging from 10 Hz to 1 kHz (common mode rejection ratio>96 dB, gain = 1000) and simultaneously digitized together with the force signals using an acquisition card (Powerlab 16SP; ADInstruments) and Labchart 7.0 soft-ware (ADInstruments). The IMVC force was determined as the peak force reached during maximal efforts. The root mean square (RMS) values of the VL, VM, and RF were calculated during the IMVC trials over a 0.5 s period after the force had reached a plateau and before the superimposed stimulation were evoked. This RMS value was then normalized to the maximal peak-to-peak amplitude of the M-wave (RMS/Mmax).
2.3.3. Peripheral nerve stimulation
The femoral nerve was stimulated percutaneously with a single square-wave stimulus of 1 ms duration with maximal voltage of 400 V delivered by a constant current stimulator (Digitimer Limited, Hertfordshire, UK). The cathode (self-adhesive electrode: Ag-AgCl, 10-mm diameter) was positioned firmly in the femoral triangle. The anode, a 10× 5 cm self-adhesive stimulation electrode (Compex Médical SA, Ecublens, Switzerland) was placed midway between the greater trochanter and the iliac crest. Optimal stimulation intensity was determined from M-wave and force measurements before each testing session. The stimulation intensity was increased by 5 mA until there was no further increase in peak twitch force (i.e., the highest value of the knee extension twitch force was reached) and in the concomitant VL, VM, and RF peak-to-peak M-wave amplitude (Mmax). During the subsequent testing
pro-cedures, the intensity was set to 150% of the optimal intensity to overcome the potential confounding effect of axonal hyperpolarization.25
Two electrical nerve stimulations were delivered at the level of the femoral nerve. The first stimulation, delivered during the IMVC, was named the superimposed twitch, and the second stimulation, delivered 3 s after the IMVC, was named the potentiated twitch (Ptw). This delay provided the opportunity to obtain a potentiated mechanical response and so reduce the variability in voluntary activation.26
The amplitude of the poten-tiated twitch was measured to reflect the muscle capacity to produce force during the electrical stimulation. The magnitude of the Ptw decline reflects the magnitude of peripheral fatigue.20 Both the superimposed and the potentiated twitch amplitudes allowed the quantification of VAL as proposed by Merton27as follows:
VAL( ) (% = −superimposed twitch potentiated twitch)
× 1
100
where superimposed twitch is the amplitude of the twitch evoked with electrical nerve stimulation during IMVC and
potentiated twitch is the amplitude of the twitch evoked by a
single stimulation delivered 3 s after the end of the IMVC as proposed by Merton.27
2.3.4. Fatiguing exercise
Participants were asked to sustain a low-intensity isometric contraction (15% of the maximal isometric force recorded during pre-exercise) until exhaustion. During the exercise, each participant was able to visualize force feedback and guidelines on a computer screen. The participants were encouraged to maintain the force at the target level as long as possible. Exhaustion was reached when the participant voluntary stopped the exercise or failed to maintain force at the target level for a duration>5 s. Force and knee extension EMG activities were continuously monitored during the exercise to provide feedback about force level and EMG activities.
2.4. Statistical analysis
As the neuromuscular testing involved several sets, values of each variable measured during the repetitive trials were aver-aged as follows: the 3 values issued from the 3 sets performed before exhausting exercise were averaged to compute the base-line (pre-EX) value; 3 values were averaged for the 3 sets performed in the recovery period 3 to 9 min after exercise (post-EX 3–9); and 4 values were averaged for the 4 sets per-formed from 12 to 21 min and from 24 to 33 min after exercise (post-EX 12–21 and post-EX 24–33, respectively). To accu-rately reflect the fatigue induced by the sustained contraction, the variables measured in the set immediately after the exercise (post-EX) were not averaged with those measured in other sets. Data were analyzed by the Statistica for Windows software (Version 6.0; StatSoft Inc., Tulsa, OK, USA). Data distribution normality was confirmed with the Shapiro-Wilk W-test. Inde-pendent sample t tests were executed in order to analyze group differences for morphologic characteristics (age, height, and body mass), baseline values (IMVC, VAL, Ptw, and RMS/Mmax)
and the time to task failure in the exhausting exercise. All these data (IMVC, VAL, Ptw, and RMS/Mmax) were normalized to the
pre-Ex values). Then the relative values of IMVC, VAL, Ptw, and RMS/Mmax were analyzed using a two-way analysis of
variance (ANOVA) with repeated-measures (Group× Time). For each statistically significant effect of main factor and inter-action, a post hoc analysis was performed using the LSD Fisher test. The decrease rate of IMVC, VAL, and Ptw values after fatigue was evaluated by calculating Delta as: Δ% = 100% × (post-EX−pre-EX)/pre-EX). The level of significance for all statistical analyses was set at p< 0.05.
3. Results
3.1. Baseline values and time to task failure
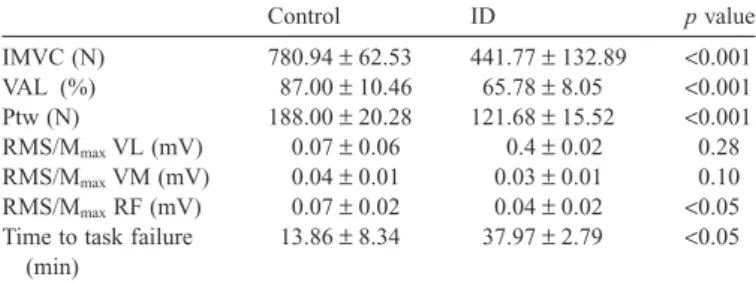
The independent sample t test demonstrated that the ID group showed significantly lower IMVC, VAL, and Ptw com-pared to the control group (p< 0.001). Moreover, the indepen-dent sample t test revealed that the ID group demonstrated significant lower RMS/Mmax for the RF muscle (p< 0.05).
However, no significant differences of RMS/Mmax for VL
(p= 0.28) and VM (p = 0.10) muscles were revealed between groups. The time to task failure during the sustained exhausting isometric exercise was significantly longer in ID than in the control group (p< 0.05) (Table 1).
3.2. Fatigue parameters 3.2.1. IMVC
The two-way ANOVA on relative IMVC data indicated a significant main effect of Time (F(4, 72)= 37.86, p < 0.001) and no significant main effect of Group (F(1, 18)= 1.43,
p= 0.24) or Group × Time interaction (F(4, 72) = 0.50, p= 0.72). The post hoc test showed a significant (p < 0.05)
IMVC decline in both groups at post-EX. Moreover, theses analysis showed that IMVC level increased significantly at post-EX 3–9 compared with post-EX indicating the start of recovery for both groups (p< 0.05). The recovery of IMVC continued at post-EX 12–21. In fact, IMVC values recording at post-EX 12–21 were significantly (p< 0.05) higher than at post-EX 3–9 and post-EX group for both groups. However, both groups failed to recover their baseline values at post-EX 24–33 compared to pre-Ex (p< 0.05). No significant difference
was reported between the 2 groups concerning IMVC values (Fig. 2A).
3.2.2. VAL
The two-way ANOVA revealed significant main effects of Group (F(1, 18)= 36.94, p < 0.001), Time (F(4, 72) = 26.74,
p< 0.001) and Group × Time interaction (F(4, 72) = 9.81, p< 0.001) on relative VAL. Concerning the within-time effect,
the post hoc analysis showed that, in the control group, VAL decreased significantly (p< 0.05) at post-EX and recovered fully to baseline values at post-EX 3–9. Moreover, in the ID
Table 1
Baseline values of IMVC, VAL, Ptw, RMS/Mmaxfor VL, VM, and RF muscles and the time to task failure in both groups.
Control ID p value IMVC (N) 780.94± 62.53 441.77± 132.89 <0.001 VAL (%) 87.00± 10.46 65.78± 8.05 <0.001 Ptw (N) 188.00± 20.28 121.68± 15.52 <0.001 RMS/MmaxVL (mV) 0.07± 0.06 0.4± 0.02 0.28 RMS/MmaxVM (mV) 0.04± 0.01 0.03± 0.01 0.10 RMS/MmaxRF (mV) 0.07± 0.02 0.04± 0.02 <0.05 Time to task failure
(min)
13.86± 8.34 37.97± 2.79 <0.05 Abbreviations: ID= intellectual; IMVC = isometric maximal voluntary con-traction; Ptw= potentiated twitch; RF = rectus femoris; RMS/Mmax= root mean square normalized to the maximal peak-to-peak amplitude of the M-wave; VAL= voluntary activation level; VL = vastus lateralis; VM = vastus medialis.
Fig. 2. Evolution of the (A) IMVC (%max), (B) VAL (%max), and (C) Ptw (%max) before (pre-EX), immediately after the fatiguing isometric task (post-EX), and during the recovery period (post-EX 3–9, post-EX 12–21, post-EX 24–33) in individuals. *p< 0.05, compared with baseline;†p< 0.05, compared with ID group; ‡p< 0.05, compared with post-Ex; §p < 0.05, compared with post-EX 3–9. ID= intellectual disability; IMVC = isometric maximal voluntary contraction; post-Ex= post-exercise; post-Ex 3–9 = 3 sets performed in the recovery period 3 to 9 min after exercise; post-Ex 12–21= 4 sets performed from 12 to 21 min after exercise; post-Ex 24–33= 4 sets performed from 24 to 33 min after exercise; pre-Ex= pre-exercise; Ptw= potentiated twitch; VAL = voluntary activation level.
Please cite this article in press as: Rihab Borji, et al., Neuromuscular fatigue and recovery profiles in individuals with intellectual disability, Journal of Sport and Health Science (2017),
group, the post hoc analysis showed that VAL decreased sig-nificantly at post-EX (p< 0.05). Compared to post-EX, a sig-nificant (p< 0.05) increase of VAL was registered at post EX 12–21. However, at post-EX 24–33 the VAL remained lower (p< 0.05) than at pre-EX for both groups (Fig. 2B). Regarding the between group effects, the post hoc analysis showed that VAL was significantly lower in the ID group compared to the control group at post-EX and throughout the recovery period (p< 0.05;Fig. 2B).
3.2.3. Ptw
The two-way ANOVA analysis of the relative Ptw values revealed significant main effects of Group (F(1, 18)= 7.09,
p< 0.05), Time (F(4, 72) = 34.90, p < 0.001) and Group ×
Time interaction (F(4, 72)= 4.25, p < 0.01). Concerning the within-time effects, the post hoc test showed that the Ptw decreased significantly (p< 0.05) in the control group at post-EX. No recovery of Ptw values was observed in this group through the recovery period. Similarly, in the ID group, the Ptw values decreased significantly (p< 0.05) at post-EX. However, in this group, these values increased significantly (p< 0.05) at post-Ex 24–33 compared to post-EX but did not recover to baseline values (Fig. 2C). Regarding the between group effects, the post hoc analysis showed that the Ptw was significantly higher in the ID group compared to the control group at post-EX and throughout the recovery period (p< 0.05,Fig. 2C).
3.2.4. RMS/Mmax
The two-way ANOVA on the relative RMS/Mmax VL
revealed significant effects of Group (F(1, 18)= 5.02,
p< 0.05), Time (F(4, 72) = 9.29, p < 0.001), and Group × Time
interaction (F(4, 72)= 6.04, p < 0.001). The post hoc results showed a significant (p< 0.001) decrement at post-EX in the ID group but unchanged values in the control group (p= 0.53). At post-EX 3–9, these values started to recover (p< 0.001) but did not reach a full recovery even at post-EX 24–33 (Table 2). Regarding the between-group effects, the post hoc analysis showed that the RMS/MmaxVL values were significantly lower
in the ID group compared to the control group at post-EX (p< 0.001) and at post-EX 3–9 (p < 0.05,Table 2).
On the VM muscle, significant main effects of Group (F(1, 18)= 6.92, p < 0.05) and Time (F(4, 72) = 13.24, p < 0.001) were observed but no significant Group× Time interaction (F(4, 72)= 1.56, p = 0.19) was reported. Regarding the time
effect, the post hoc analysis revealed a significant (p< 0.001) decrement of RMS/MmaxVM at post-EX in the control group.
These values started to recover at post-EX 3–9 (p< 0.01), with a completed recovery at post-EX 24–33 (Table 2). In the ID group, the post hoc analysis revealed also a significant (p< 0.001) decrement at post-EX. At post-EX 3–9, these values started to recover (p< 0.01) but did not reach a full recovery even at post-EX 24–33 (p< 0.05) (Table 2). The post hoc analy-sis showed also that the ID group presented lower values of RMS/MmaxVM compared to the control group at post-EX and
during the recovery period (p< 0.05) (Table 2).
Finally, for the RF muscle, the two-way ANOVA revealed significant main effects of Group (F(1, 18)= 11.36, p < 0.001), Time (F(4, 72)= 11.87, p < 0.001), and Group × Time interac-tion (F(4, 72)= 3.66, p < 0.01). Concerning the time effect, the
post hoc test showed that the RMS/MmaxRF decreased
signifi-cantly at post-EX (p< 0.001) in the control group. These values showed a full recovery (no significant difference with baseline values) at post-EX 3–9 (Table 2). Similarly, in the ID group, the RMS/Mmax RF decreased significantly at post-EX (p< 0.001)
and started to recover at post-EX 3–9 but the full recovery did not occur (Table 2). The post hoc results showed also that the RMS/MmaxRF values were significantly lower in the ID group
than in the control group (pre-EX and post-EX; p< 0.05; post EX 3–9 and post EX 12–21: p< 0.001; post EX 24–33:
p< 0.01) (Table 2). 4. Discussion
The aim of our study was to investigate the ability to sustain exhausting sub-maximal isometric contraction in individuals with ID compared to those with typical development and to explore the magnitude, the neuromuscular fatigue origin, and the subsequent recovery in these individuals. The results of the current study confirmed our hypothesis by showing that indi-viduals with ID were able to sustain the sub-maximal force level for a longer duration compared with controls. The relative IMVC decline at exhaustion and the subsequent IMVC recov-ery profile were similar between groups, but their origin dif-fered. The longer time to task failure in the ID group was associated with reduced peripheral fatigue and higher central fatigue compared to the control group. The central fatigue did not recover in the ID group whereas, in the control group, it recovered within the first 9 min.
Table 2
Evolution of the RMS/Mmaxvalues of the VL, VM, and RF muscles in individuals with ID and control group at Pre-EX, Post-EX, and Post-EX 3–9, Post-EX 12–21, Post-EX 24–33 from the exhausting isometric task.
ID (%max) Control (%max)
Pre-EX Post-EX Post-EX 3–9 Post-EX 12–21 Post-EX 24–33 Pre-EX Post-EX Post-EX 3–9 Post-EX 12–21 Post-EX 24–33
RMS/MmaxVL 96.03± 1.93 55.29± 24.36***,###69.30± 27.35***,# 77.92± 22.86** 80.55± 22.94** 95.19± 1.94 91.80 ± 14.41 88.90± 18.16 93.36± 22.06 93.28± 23.49 RMS/MmaxVM 96.14± 3.21### 68.08± 12.19***,# 81.69± 14.70**,# 83.36± 7.02**,# 87.97± 17.04*,# 97.27± 1.74 82.93 ± 9.95*** 95.57± 16.96** 95.89± 16.96** 101.91± 21.81
RMS/MmaxRF 95.02± 4.36# 68.94± 13.87***,# 77.80± 17.16***,### 74.96± 12.77***,### 76.29± 16.32***,## 97.74± 6.55 82.71 ± 13.21*** 99.51± 12.19 97.63± 16.94 95.29± 16.25
* p< 0.05, **p < 0.01, ***p < 0.001, compared with Pre-Ex group.
#p< 0.05,##p< 0.01,###p< 0.001, compared with control group.
Abbreviations: ID= intellectual disability; Post-Ex = post-exercise; Post-Ex 3–9 = 3 sets performed in the recovery period 3 to 9 min after exercise; Post-Ex 12–21 = 4 sets performed from 12 to 21 min after exercise; Post-Ex 24–33= 4 sets performed from 24 to 33 min after exercise; Pre-Ex = pre-exercise; RF = rectus femoris; RMS/Mmax= root mean square normalized to the maximal peak-to-peak amplitude of the M-wave; VL
Individuals with ID developed lower baseline values of IMVC, VAL, RMS/Mmax RF and Ptw compared to the control
group. Our results are consistent with previous findings,14 which suggest that individuals with ID have a lower ability to generate a maximal force, accounted for by peripheral and central factors. Nevertheless, our results showed that individu-als with ID presented similar IMVC decline to individuindividu-als with typical development after an isometric sub-maximal ex-hausting contraction. This result is in disagreement with those of previous studies. In fact, Zafeiridis et al.19 reported lower force decline compared to controls in these individuals after an intermittent high-intensity exercise. In contrast, Borji et al.17 revealed greater force decline in individuals with ID than controls after maximal repeated knee extensions and flexions. This contradiction could be explained by differences in the fatiguing protocol (exercise intensity and duration). Borji et al.17 explored the neuromuscular fatigue in these individuals after 5 sets of repeated knee extensions and flexions at 80% maximal repetition. Likewise, Zafeiridis et al.19implemented a fatiguing exercise consisting of maximal knee extensions and flexions for both individuals with ID and those with typical develop-ment. Participants in this study19performed 4× 30 s of maximal flexion and extension cycles at angular velocity 120°/s sepa-rated by 60 s of rest. Conversely, in the present study, the fatiguing exercise was a low-intensity isometric contraction sustained until exhaustion and with individualized intensity (15% of each participant IMVC). Moreover, individuals with ID had a better performance, that is, longer time to exhaustion, than controls. These results are consistent with previous studies showing that individuals characterized by low maximal force capacities, such as women, children or the elderly, have a better ability to sustain sub-maximal4,5
or maximal force levels.6,28 Yamada et al.12
also reported greater endurance capacities in individuals characterized by a low VAL, as in the case of the ID group.
The longer exercise duration observed in the ID group could account for the predominance of central fatigue in this group, as evidenced by the pronounced decrease of VAL and normalized EMG activity after the fatiguing exercise in this group com-pared to individuals with typical development. Indeed, it is well documented that sustained lower intensity contractions induced central fatigue rather than peripheral fatigue.7,9,29The greater central fatigue observed in the ID group compared to the control one could be related to abnormalities within their central nervous system. Indeed, in these individuals reduction in number of neurons, dendritic abnormalities, and neurotrans-mitter system dysfunction have been reported,21,22,30 which could impair the descending neural drive.31
In addition, indi-viduals with ID may suffer from other abnormalities within the spinal cord32,33
that may impair motor units recruitment during muscle contraction. Beyond the greater magnitude of central fatigue, the ID group displayed a slow recovery from this central fatigue compared to individuals with typical develop-ment. Using the same exercise protocol, Zghal et al.34
showed that recovery of central fatigue occurs within 10 min in seden-tary or trained adults with typical development. Recently, it has been confirmed that central fatigue recovers more quickly than
the peripheral one after a fatiguing exercise in healthy adults.35 Thus, the ID group displayed a distinct recovery profile of central fatigue. Such slow recovery of central fatigue has already been reported in the elderly36
who developed also a low VAL.37
The ID group was mainly characterized by an attenuated peripheral fatigue with a faster recovery compared to the control group. In this context, Nordlund et al.10
reported that individuals having a low VAL present lower extent of peripheral fatigue after a fatiguing exercise compared to individuals with high VAL. Our results are in line with those of Ratel et al.28 showing that children produce lower force, present a longer time to task failure, develop more central fatigue, and recover from peripheral fatigue faster than adults. Because adults with ID demonstrated a similar VAL with children without ID,13they seem to present similar neuromuscular fatigue profile. More-over, we cannot exclude that the lower peripheral fatigue in the ID group could be attributed to specific muscle properties. Because it has been reviewed that the increased accumulation of by-products (lactate, H+) of anaerobic metabolism impairs the excitation-contraction coupling and cross-bridges formation,20 the lower lactate accumulation observed in indi-viduals with ID could explain the low peripheral fatigue magnitude.19,38
It has been shown that individuals with ID present lower peak and mean power levels and that they accu-mulate less blood lactate during the Wingate test.38
These authors associated these lower performance lactate concentra-tions to a lower extent of fast-twitch muscles fibers because the Wingate test performance depends on the predominance of these muscle fibers.39
Furthermore, Zafeiridis et al.19 found lower blood lactate concentration in these individuals compared to controls after 4× 30 s of maximal flexion and extension cycles at angular velocity 120°/s separated by 60 s of rest. Therefore, it seems to be reasonable to expect that this could be due to the limited extent of type fast-twitch muscle fibers reported in individuals with ID40whereas further studies should be conducted to explore this suggestion.
This study has some limitations. Although the twitch inter-polation is an efficient technique to explore the implication of central and peripheral factors in neuromuscular fatigue, it would be interesting to explore the cortical activation in indi-viduals with ID using the transcranial magnetic stimulation in future investigations. It will be interesting to know whether spinal or spinal accompanied by supraspinal nervous system anomalies are involved in this accentuated and persistent central fatigue reported in individuals with ID compared to controls. In the present study, we only evaluate the magnitude and the origin of neuromuscular fatigue in individuals with ID. It would be very interesting to apply, in a future study, the superimposed and the potentiated twitch at intervals during the fatiguing exercise to assess the contribution of central and peripheral fatigue to force decline as well as the neuromuscular fatigue processing kinetic in these individuals.
5. Conclusion
Our findings showed that individuals with ID developed lower maximal force but sustained the sub-maximal contraction
Please cite this article in press as: Rihab Borji, et al., Neuromuscular fatigue and recovery profiles in individuals with intellectual disability, Journal of Sport and Health Science (2017),
for a longer duration than individuals without ID. Although individuals with ID presented similar maximal voluntary force decrement at exhaustion and similar subsequent recovery kinetic with individuals without ID, the origin of this neuro-muscular fatigue is radically different. In fact, individuals with ID developed mainly central fatigue but a limited peripheral one. Moreover, individuals with ID presented a persistent central fatigue without recovery but a faster recovery from peripheral fatigue than individuals with typical development. The distinct fatigue and recovery pattern of the ID group should be taken into account when designing training programs or occupational activities for individuals suffering from ID. Acknowledgments
The authors would like to thank all participants for their understanding and availability. In addition, great thanks go to all collaborators and volunteers of the National Union of Aid to Mental Insufficiency for their contribution in this study. Authors’ contributions
The corresponding author RB conceived of the study, arranged participants’ recruitment, performed data acquisition, statistical analysis, data interpretation, and drafted the manu-script; FZ contributed to study conception, data acquisition and interpretation, and helped to draft the manuscript; NZ contrib-uted to data interpretation and revising the manuscript; VM contributed to statistical analysis and critically revised the manuscript; SS contributed to statistical analysis and helped to draft the manuscript; HR contributed to study design and coor-dination, data interpretation and critically revising of the manu-script. All authors have read and approved the final version of the manuscript, and agree with the order of presentation of the authors.
Competing interests
The authors declare that they have no competing interests. References
1. Enoka RM, Stuart DG. Neurobiology of muscle fatigue. J Appl Physiol 1992;72:1631–48.
2. Gandevia SC. Spinal and supraspinal factors in human muscle fatigue.
Physiol Rev 2001;81:1725–89.
3. Edwards RH. Human muscle function and fatigue. Ciba Found Symp 1981;82:1–18.
4. Hunter SK, Enoka RM. Sex differences in the fatigability of arm muscles depends on absolute force during isometric contractions. J Appl Physiol 2001;91:2686–94.
5. Hunter SK, Critchlow A, Enoka RM. Muscle endurance is greater for old men compared with strength-matched young men. J Appl Physiol 2005;99:890–7.
6. Hatzikotoulas K, Patikas D, Ratel S, Bassa E, Kotzamanidis C. Central and peripheral fatigability in boys and men during maximal contraction. Med
Sci Sports Exerc 2014;46:1326–33.
7. Taylor JL, Gandevia SC. A comparison of central aspects of fatigue in submaximal and maximal voluntary contractions. J Appl Physiol 2008;104:542–50.
8. Søgaard K, Gandevia SC, Todd G, Petersen NT, Taylor JL. The effect of sustained low-intensity contractions on supraspinal fatigue in human elbow flexor muscles. J Physiol 2006;573:511–23.
9. Eichelberger TD, Bilodeau M. Central fatigue of the first dorsal interosseous muscle during low-force and high-force sustained submaximal contractions. Clin Physiol Funct Imaging 2007;27:298–304.
10. Nordlund MM, Thorstensson A, Cresswell AG. Central and peripheral contributions to fatigue in relation to level of activation during repeated maximal voluntary isometric plantar flexions. J Appl Physiol 2004;96: 218–25.
11. Gandevia SC, Allen GM, McKenzie DK. Central fatigue. Critical issues, quantification and practical implications. Adv Exp Med Biol 1995;384: 281–94.
12. Yamada H, Kaneko K, Masuda T. Effects of voluntary activation on neuromuscular endurance analyzed by surface electromyography. Percept
Mot Skills 2002;95:613–9.
13. Borji R, Zghal F, Zarrouk N, Sahli S, Rebai H. Individuals with intellectual disability have lower voluntary muscle activation level. Res Dev Disabil 2014;35:3574–81.
14. Luckasson R, Schalock RL. Defining and applying a functionality approach to intellectual disability. J Intellect Disabil Res 2013;57:657– 68.
15. Eichstaedt CB, Lavay BW. Physical activity for individuals with mental
retardation: infancy through adulthood. Champaign, IL: Human Kinetics;
1992.
16. Fernhall B. Physical fitness and exercise training of individuals with mental retardation. Med Sci Sports Exerc 1993;25:442–50.
17. Borji R, Sahli S, Zarrouk N, Zghal F, Rebai H. Neuromuscular fatigue during high-intensity intermittent exercise in individuals with intellectual disability. Res Dev Disabil 2013;34:4477–84.
18. Blomqvist S, Olsson J, Wallin L, Wester A, Rehn B. Adolescents with intellectual disability have reduced postural balance and muscle performance in trunk and lower limbs compared to peers without intellectual disability. Res Dev Disabil 2013;34:198–206.
19. Zafeiridis A, Giagazoglou P, Dipla K, Salonikidis K, Karra C, Kellis E. Muscle fatigue during intermittent exercise in individuals with mental retardation. Res Dev Disabil 2010;31:388–96.
20. Fitts RH. Cellular mechanisms of muscle fatigue. Physiol Rev 1994;74:49–94.
21. Gabrielli O, Coppa GV, Manzoni M, Carloni I, Kantar A, Maricotti M, et al. Minor cerebral alterations observed by magnetic resonance imaging in syndromic children with mental retardation. Eur J Radiol 1998;27: 139–44.
22. Yu C, Li J, Liu Y, Qin W, Li Y, Shu N, et al. White matter tract integrity and intelligence in patients with mental retardation and healthy adults.
Neuroimage 2008;40:1533–41.
23. Wechsler D. Wechsler adult intelligence scale–fourth edition. San Antonio, TX: Pearson; 2008.
24. Hermens HJ, Freriks B, Disselhorst-Klug C, Rau G. Development of recommendations for SEMG sensors and sensor placement procedures. J
Electromyogr Kinesiol 2000;10:361–74.
25. Burke D. Effects of activity on axonal excitability: implications for motor control studies. Adv Exp Med Biol 2002;508:33–7.
26. Kufel TJ, Pineda LA, Mador MJ. Comparison of potentiated and unpotentiated twitches as an index of muscle fatigue. Muscle Nerve 2002;25:438–44.
27. Merton PA. Voluntary strength and fatigue. J Physiol 1954;123:553–64.
28. Ratel S, Kluka V, Vicencio SG, Jegu AG, Cardenoux C, Morio C, et al. Insights into the mechanisms of neuromuscular fatigue in boys and men.
Med Sci Sports Exerc 2015;47:2319–28.
29. Martin V, Kerhervé H, Messonnier LA, Banfi JC, Geyssant A, Bonnefoy R, et al. Central and peripheral contributions to neuromuscular fatigue induced by a 24-h treadmill run. J Appl Physiol 2010;108:1224–33.
30. Dierssen M, Ramakers GJA. Dendritic pathology in mental retardation: from molecular genetics to neurobiology. Genes Brain Behav 2006;5: 48–60.
31. Kaufmann WE, Moser HW. Dendritic anomalies in disorders associated with mental retardation. Cereb Cortex 2000;10:981–91.
32. Curtis R, Freitag P, LaGuardia JJ, Thornton S, Vicari S, Markwell S. Spinal cord compromise: an important but underdiagnosed condition in people with mental retardation. Public Health Rep 2004;119:396–400.
33. Pascual-Gallego M, Budke M, Villarejo F. Spinal stenosis at the level of atlas in a boy with Down syndrome. A case report and literature review.
Neurocirugia 2014;2:529–32.
34. Zghal F, Cottin F, Kenoun I, Rebaï H, Moalla W, Dogui M, et al. Improved tolerance of peripheral fatigue by the central nervous system after endurance training. Eur J Appl Physiol 2015;115:1401–15.
35. Gruet M, Temesi J, Rupp T, Levy P, Verges S, Millet GY. Dynamics of corticospinal change during and after high-intensity quadriceps exercise.
Exp Physiol 2014;99:1053–64.
36. Hunter SK, Todd G, Butler JE, Gandevia SC, Taylor JL. Recovery from supraspinal fatigue is slowed in old adults after fatiguing maximal isometric contractions. J Appl Physiol 2008;105:1199–209.
37. Stackhouse SK, Stevens JE, Lee SC, Pearce KM, Snyder-Mackler L, Binder-Macleod SA. Maximum voluntary activation in nonfatigued and fatigued muscle of young and elderly individuals. Phys Ther 2001;81:1102–9.
38. Chia YHM, Lee KS, Teo-Koh SM. High intensity cycling performances of boys with and without intellectual disability. Intellect Dev Disab 2002;27:191–200.
39. Inbar O, Bar-Or O, Skinner JS. The Wingate Anaerobic Test. Champaign, IL: Human Kinetics; 1996.
40. Zanni G, Scotton C, Passarelli C, Fang M, Barresi S, Dallapiccola B, et al. Exome sequencing in a family with intellectual disability, early onset spasticity, and cerebellar atrophy detects a novel mutation in EXOSC3.
Neurogenetics 2013;14:247–50.
Please cite this article in press as: Rihab Borji, et al., Neuromuscular fatigue and recovery profiles in individuals with intellectual disability, Journal of Sport and Health Science (2017),