ELSEVIER
Marine and Petroleum Geology, Vol. 13, No. 5, pp. 755-770, 1996 Copyright © 1996 Elsevier Science Ltd Printed in Great Britain. All rights reserved
PII: S0264-8172(96)00024-4 0264-8172/96 $15.00 + 0.00
Sequence stratigraphy of Upper Jurassic reservoir
sandstones in the northern part of the Danish
Central Trough, North Sea
Peter N. Johannessen, Karen D y b k j a r and Erik S. Rasmussen
Geological Survey of Denmark and Greenland, GEUS, Thoravej 8, DK-2400, Copenhagen NV, Denmark
Received 19 May 1995; accepted in revised form 20 April 1996
The Jurassic succession of the northern part of the Danish Central Trough is subdivided into six depositional sequences based on a multi-disciplinary study, including sedimentology, bio- stratigraphy, seismic interpretation, structural interpretation, log correlation, geochemistry and palynofacies analysis. Three of these sequences include significant sandstone deposits that represent potential reservoirs. The lowermost sequence 1 contains Upper Kimmeridgian back- barrier and shoreface sandstones of the 'basal sandstone unit' and the Heno Formation deposited within a transgressive and a highstand systems tract, respectively. Sequence 2 includes Upper Kimmeridgian middle shoreface sandstones of the Heno Formation deposited within a trans- gressive systems tract. Within sequence 6, Middle-Upper Volgian distal turbidite sandstones have been recognized. These are interpreted as having been deposited within a Iowstand and transgressive systems tract and may constitute a reservoir elsewhere in the basin. The sequence stratigraphic boundaries of this study do not match those proposed by the Exxon group. In this rift setting, sequence development was probably controlled predominately by tectonism; eustasy was of subordinate importance. Copyright © 1996 Elsevier Science Ltd
Keywords: Late Jurassic; sequence stratigraphy; North Sea
The purpose of this paper is to describe the facies and distribution of deeply buried Upper Jurassic reservoir sandstones deposited within a tectonically active rift basin, using the principles of sequence stratigraphy. We also present the sequential development of the sediments within a platform graben setting that experienced vari- able subsidence rates.
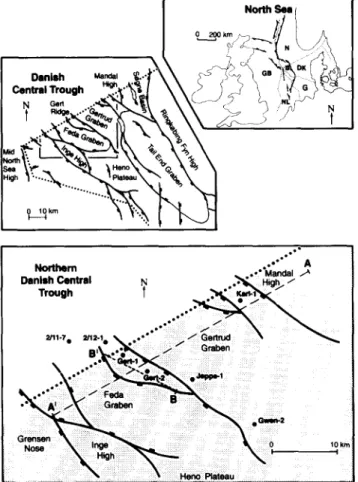
The study is focused on the Feda and Gertrud Grabens in the northern part of the Danish Central Trough, pen- etrated by the Gert-1, Gert-2, Jeppe-1 and Gwen-2 wells (Figure 1). The oil-bearing Gert Field, which is awaiting development, is situated within the study area. The net sand thickness of the Gert-1 well reservoir is 72 m with an average porosity of 16%. The reserves are estimated to be 11 million m 3 oil condensate and 1 billion m 3 gas (Damtoft et al., 1992). The reservoir sandstones of the Gert field and adjacent areas are very deeply buried (base sandstone in the Gert-1 well occurs at 4938 m below M.S.L.) resulting in limited seismic resolution. The sequence stratigraphic interpretations presented here are thus based on the integration of seismic stratigraphy, with sedimentological and palynofacies interpretations based on cores, detailed well log correlations, bio- stratigraphy and geochemistry.
Geological setting Regional geology
The Central Trough is situated within the North Sea, south of the Viking Graben and Moray Firth and runs through the British, Norwegian, Danish, German, and Dutch North Sea sectors (Figure 1). It is a complex, rifted epicontinental basin with a long history of differential subsidence (Roberts et al., 1990). The Danish Central Trough has experienced overall extension and is char- acterized by a number of Jurassic half-grabens (Figure 2) (Damtoft et al., 1992). The fault blocks are tilted towards the NE. As a result of NW-SE strike-slip movements, local areas experienced compression, forming thrusted ridge structures (Damtoft et al., 1992).
The combined effects of graben and half-graben sub- sidence and Middle Jurassic (Bathonian) to Late Jurassic (early Volgian) eustatic sea-level rise (Hallam, 1988; Haq et al., 1988) resulted in a major transgression within the Central Trough. The northern part of the Danish Central Trough experienced marine inundation from the north at a time when the Sogne Basin and Feda Graben underwent major subsidence (Figure 1) (Damtoft et al., 1992). Dur- ing the Kimmeridgian, marine connections to the Arctic,
Upper Jurassic reservoir sandstones: P. N. Johannessen
et al. Central'll'ough H~..~..<~ 1 k k -) 5 ~ ' ~ : Northern Danish Central N Trough l .if" , A Wt'2 0 10kin I IFigure 1 Structural outline of the Danish Central Trough, with location of wells, geosection (A'-A) and seismic section (B'-B)
the Central Atlantic and the Tethys oceans were estab- lished (Ziegler, 1982, 1988, 1990; Gage and Dor6, 1986; Dor6 and Gage, 1987; Hallam, 1988).
3) (Bergan et al., 1989). It is overlain by offshore clay-
stones of the Lola Formation (Figure 4) (Jensen et al.,
1986), which is equivalent to the Norwegian Haugesund Formation and the British Heather Formation (Figure
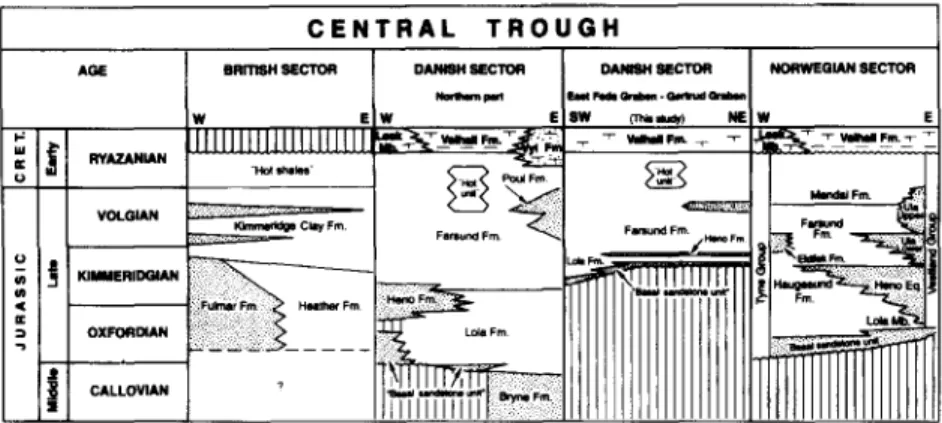
3). The Lola Formation is overlain by regressive and early transgressive lower to middle shoreface sandstones of the Heno Formation (Jensen et al., 1986). The Heno
Formation is roughly equivalent to the Fulmar For- mation in the UK sector and has many similarities with the 'Heno equivalent' and the Ula Formation of the Norwegian Sector (Bergan et al., 1989).
During continued transgression, up to 2 km of offshore claystones of the Farsund Formation were deposited (Vollset and Dor6, 1984). They constitute the remaining part of the Jurassic succession in the Danish Central Trough and correlate with the Kimmeridge Clay For- mation of the UK sector (Figure 3). The Farsund For-
mation is overlain by Upper Ryazanian calcareous, mudstone-dominated sediments of the Cromer Knoll Group, deposited in an open marine, well-oxygenated environment (Jensen et al., 1986; Michelsen et al., 1987).
The transition from the Farsund Formation to the Cromer Knoll Group represents the continuation of the regional transgression (Michelsen et al., 1987).
Previously, the 'basal sandstone unit' has been referred to the latest Callovian-Oxfordian (Bergan et al., 1989),
the Lola Formation to the Late Callovian-Kimmeridgian and the Heno Formation to the Middle Oxfordian-Kim- meridgian (Jensen et al., 1986). S6derstr6m et al. (1991)
referred the 'basal sandstone unit' to the Middle Cal- lovian-Early Kimmeridgian, whereas the Lola and Heno Formations were referred to the Middle-Upper Kim- meridgian. The Farsund Formation has been referred to the Kimmeridgian-Volgian (Vollset and Dor6, 1984) and to the Kimmeridgian-Ryazanian (Heilmann-Clausen,
1987; Poulsen, 1991).
Stratigraphy
The Jurassic to lowermost Lower Cretaceous succession of the investigated area lies unconformably upon Car- boniferous, Permian and Triassic rocks, and is generally conformably overlain by Lower Cretaceous sediments
(Figure 2). The lower part of the Jurassic succession con-
sists of aggrading back-barrier and transgressive upper shoreface sandstones of the 'basal sandstone unit' (Figure
A' ~'lis w 2.0 ,1.0 4.0 5.0 8.0 NE
Feda Graben G~lrud Graben Mandal High Inge High Gerl Ridge Kad Platform
~ Basement ~ Jurass¢ ~ Upper Cretaceous and Danian
[ ] Pre-Jurassic ~ Lower Crot~ceou$ I 10 Km I
Figure 2 Geosection perpendicular to the axis of the northern part of the Danish Central Trough. Modified from Damtoft et al.
(1992). For location of geosection see Figure 1
Structural setting
The study area covers the Feda and Gertrud Grabens. The structural development of these grabens is important for the understanding of the evolution of the Upper Jur- assic sediment package (see S6derstr6m et al., 1991;
Sundsbo and Megson, 1993; Rasmussen, 1995). The Feda and Gertrud Grabens both formed in an overall exten- sional tectonic regime, but their development was not synchronous. Three tectonic phases were recognized by Rasmussen (1995):
1. By the early Late Kimmeridgian, subsidence along N - S trending faults characterized the initial evolution of the Feda Graben (Figure 5a). At this time, most of the
Gertrud Graben area formed a plateau with little or no fault-controlled subsidence. The southern part of the study area represented a saddle-like feature between the Feda Graben towards the north and west and the Heno Plateau and the Tail End Graben towards the south and east.
2. After a period of tectonic quiescence, the second phase in the structural evolution was initiated by activation of NW-SE striking normal faults during the latest Late Kimmeridgian resulting in renewed subsidence of the Feda Graben (Figure 5).
3. The third faulting phase, which occurred during the
Upper Jurassic reservoir sandstones: P. N. Johannessen
et al. C E N T R A L T R O U G H-'-d
...
I
w E W E g n l f ~ N E W " 1 " f 2 Z g l:
~..L~'>>
. . . . ~11 Ir ~ ii, i,t; I ~ - ~ - ~ - ~ s
¢ .~'.,s~=i¢ I I I I I I i I I I i Lo~MI>*'~'~j =v,..
.
II
]% ]111111111
Figure 3 Correlation chart for the Middle J u r a s s i c to Earl Cretaceous of the Central Trough. Modified from J o h n s o n e t a / . (1988), Jensen eta/. (1986), Michelsen and W o n g (1991) and Bergan eta/. (1989)
early Volgian-early Cretaceous, was in many ways a repetition of the second. Fault-controlled subsidence occurred along NW-SE striking faults in an overall extensional regime, not only along the boundary faults of the Feda Graben, but also along faults south of the Mandal High, causing the main subsidence of the Gertrud Graben
(Figure 5).
Clockwise rotation of theFeda Graben fault block resulted in compression and thrusting in the Gert area. Further south, near the Gwen-2 well, uplift also occurred along the Gert Fault, but here as footwall uplift along a normal fault. Due to this complex tectonism, areas along the main fault were uplifted and exposed to erosion while deposition still occurred within the graben areas.
NW 2 / 1 1 - 7 GR OT o ~ _ ~ 5 0 1 9 m. b e l o w M . S . L Gert - 1
/
/
iJ Gert - 2 GR DT SE | Core ,L. 4 9 3 8 m b e l o w M.S.L. ~ H e n o F o r m a t i o n ~ "Basal s a n d s t o n e unit" 4a4Om B a s a J u r a s s i c 4 6 6 8 m b e l o w M . S . L . b.U.S.L I Fecla Graben- [Fed== G m b e n Gertrud Plateau Gertru¢l P I ~ M u IGmben
Karl - 1 GR DT o ~ • ~..~ ~ . 4 4 5 6 m b e l o w M.S.L. 0 50 lOOm
F i g u r e 4 Correlation of F o r m a t i o n s w i t h i n the Upper J u r a s s i c - L o w e r Cretaceous section of the Feda Graben and the Gertrud Plateau/ Graben. For location of wells see Figure I
U p p e r Jurassic reservoir sandstones: P. N. J o h a n n e s s e n et al. A
W
E
Gert-1 J e p l ~ l le~ rt'~ I SB 2 ::::::::::::::::::::::::::::::::::::::::::::::::::::::::::::::::::::::::::::::::::::::::::::::::::::::::::::::::::::::::::::::::::::: SB~~
"~ GIh'q-1 \ "~ I "~"2,, oenma,, Norway.,.,...."/.~.
... "~,~. ... • ~ ~v~ ~ • B SB~ SIB: SB.W
E
Gert-1 Jel0~pe-1 Gert-2 N No~,,ay .... ~.t
• . ~ " " ? ~ ' = . X ".. Denmark "~Qwen-2 I 5 krn I , ~ C E W I ' " ' SB6. 7SB~
Middle Volgian - Upper Ryazanian " - - = - - " Normal fault
Lower Volgian ~ Reverse fault
Uppermost Upper Kimrneridgian - - , , - - Uncertain fault activity
Upper Kimmeridgian , Well
... Norwegian - Danish borderline
Figure 5 Structural evolution of the eastern part of the Feda Graben and the Gertrud Plateau/Graben
Biostratigraphy
The age of the investigated well sections has been deter- mined on the basis of the dinoflagellate cyst content (Fig-
ure 6). Due to deep burial of the investigated intervals,
the palynomorphs are in a very poor state of preservation. Furthermore, only a few age-diagnostic dinoflagellate cyst species occur in the marginal marine sandstone inter- vals. However, close and selective sampling has resulted in a relatively detailed subdivision of the well-sections. The reservoir sandstones of the 'basal sandstone unit'
and the Heno Formation (Sequence 1 and part of Sequence 2, see below), were deposited within the Late Kimmeridgian Mutabilis Chronozone. These results indi- cate that the reservoir sandstones are considerably youn- ger than previously suggested (Jensen et al., 1986; Bergan
et al., 1989; S6derstr6m et al., 1991; Johannessen and
Andsbjerg, 1993).
In general, the Farsund Formation, comprising the interval from the Upper Kimmeridgian to Ryazanian, is fully represented in the studied wells. However, in the
Upper Jurassic reservoir sandstones: P. N. Johannessen et al. i z=m G. villess D. ~.1oeum DINOFt.AGELLATE CYBT Z O N A ~ l l ~ m m m i m ~ E. phare R. thula FIRST LAST APPEARANCE OCClmlIENCE DATUEM DA'IrUM8 (FAD's) (LOO's) "1S. daveyi, R. thula "IE. expirstum E. ex~retum '1E.po(yplecephorum fG. villcea b 1 S. juressca o • 10. balios o d .1 P. pannosum c "10. pstulurn b a '1 S. ?paeminoss '1 E. luridum
P. pannceum S. ?inaffecta '1 S. scarl~rg~ense
S. ~ . , a f o u ~ S. ?peaminosa G.j.j,common d b D. cu~mula i G. dimomhum .z i ; . E. luridum i = ) . S. crylltallinium a _ b
Figure 6 Stratigraphically important first appearances (FAD's) and last occurrences (LOD's) of dinoflagellate cysts, used for dating and correlation
10m
I
SB 1 4975 m_ Core depth GERT - 1 I & IAI'~
It II tJ/kt, ~
I d tl /k It A,,~
/ \ II / t I I I c~ I~1 '£~' Icg i k /, f::: ,L w-- k L % Marine Palyno- morph9 0 100Gert-I well, the upper Middle Volgian-Ryazanian part of the Farsund Formation is missing, probably due to uplift and erosion during tectonic phase 3.
Depesitional environments
Back-barrier deposits
Characteristics. This facies assemblage is typified by
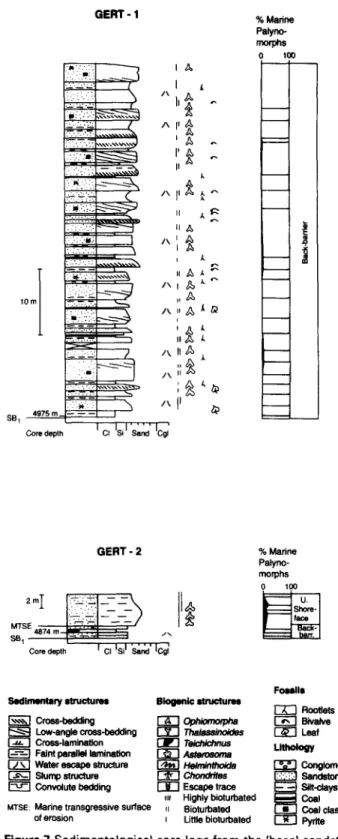
the cored lowermost 56 m of the 'basal sandstone unit' in the Gert-I well. It consists of interbedded fine-grained sandstones and claystones with coal beds, 2-15 cm thick. The fine-grained sandstones are commonly thoroughly bioturbated and/or disturbed by water-escape structures such that primary sedimentary structures are unre- cognizable. Ophiomorpha burrows, rootlets and coal frag- ments are typical features of the cored section (Figure 7).
The kerogen content of the sandstone beds is composed solely of black, oxidized wood particles, whereas that of the claystone beds and laminae is strongly dominated by terrestrially-derived particles, such as brown and black wood, cuticle, spores, and pollen. Reworked Car- boniferous spores and pollen are common. Marine dino- flagellate cysts are scarce (0-3% of total palynomorphs;
Figure
7).
Coarsening-to fining-upward successions, 3-8 m thick, are recognized. The lower, coarsening-upward portion consists mainly of Ophiomorpha burrowed siltstones and fine-grained sandstones showing faint parallel bedding or low-angle cross-stratification, commonly associated with water escape structures. The overlying fining-upward portion consists of cross-bedded or low-angle cross- stratified fine- or medium-grained sandstones, overlain by structureless fine-grained sandstones, siltstones and claystones, locally capped by coal beds, 2-15 cm thick. Such fining-upward successions are often associated with
Ophiomorpha burrows, water escape structures and root-
lets.
GERT - 2
2 m]" r ' . ~ ~ , -- -
Coredepth I el Isil 'S~I'
[C~
% Marine Palyno- morphs 0 10o k u. [ Shore- Fooslls Sedimentary structures Biogenic structures
Rootlets
C~-~d~ng ~ Opt~n~a ~ ~v~ve
Low-angle cross-bedding I T ] ~ s ~ Leaf
Crss~laminatlon ~ Te/ch/chnus L l t h o l ~
Faint parallel lamination ~ Pa~oteaoma
Water escape structure ~ He#n/nthokta ~ C o n g ~ r s t e Slump structure ~ Chono~s Sandstone Convolute bedding ~ Escape trace ~ Silt-daystone
m Highly bioturbated ~ Coal MTSE: Marine transgressive surface ~t Bioturbated ~ Coal clast
of erosion t Little bioturbated I ~ J Pyrite Figure 7 Sedimentological core logs from the 'basal sandstone unit' of the Gert-1 and Gert-2 wells. SBI: composite sequence boundary
Interpretation. A marginal marine setting is indicated
by the association of rootlets and coal beds together with bioturbated sediments with Ophiomorpha. The kerogen indicates a low-salinity, nearshore setting with a high input of terrestrial material. The small number of dino- flagellate cysts, and the dominance of a single genus,
Sentusidinium, indicate a low salinity environment (Noe-
Nygaard et al., 1987, Smelror and Leereveld, 1989). The association of restricted marine and non-marine environ- ments, suggests deposition in a back-barrier setting.
The coarsening-upward units were probably deposited by prograding mouth bars, near the bay head shoreline.
Upper Jurassic reservoir sandstones: P. N. Johannessen
et al. The fining-upward successions were deposited withinchannels by migrating mega-ripples or bars. The over- lying more or less structureless fine-grained sandstones, siltstones and claystones represent the passive fill of the abandoned channel. The thin coal beds, associated with underlying rootlets, represent the final phase of aban- donment. The occurrence of Ophiomorpha within the sandstones of the passive channel fill may indicate some marine influence. The channels are interpreted as dis- tributary channels that dissected previously deposited mouth bars.
Shoreface sandstones and conglomerates
The upper part of the 'basal sandstone unit' consists of transgressive shoreface sandstones that overlie back- barrier sediments and are overlain by offshore claystones of the Lola Formation (Figure 4). The Heno Formation comprises regressive-transgressive shoreface sandstones that overlie the offshore claystones of the Lola Formation and are overlain by the offshore claystones of the Farsund Formation. These two shoreface units are described sep- arately.
Transgressive shoreface sandstones
Characteristics. The lower part of the cored section of the 'basal sandstone unit' in the Gert-2 well consists of very fine-grained back-barrier sediments, abruptly over- lain by 4 m of fine- and medium-grained faintly parallel- laminated, bioturbated sandstones characterized by abundant Ophiomorpha burrows (Figures 4 and 7). The percentage of marine palynomorphs (0-16% of total palynomorphs) is high compared with the back-barrier succession in the Gert-1 and Gert-2 wells (see above).
Low gamma values and high sonic velocities charac- terize the upper part of the 'basal sandstone unit'. They are followed upwards by a stepwise increase in gamma radiation and corresponding decrease in sonic velocity in the Gert-1, Gert-2, Jeppe-1, Gwen-2 and 2/12-1 wells (Figure 4).
Interpretation. The trace fossil assemblage and the palynofacies data together indicate a marine nearshore environment with a high input of terrestrial material. The uppermost clean marine sandstones in the Gert-2 well were probably deposited within the upper shoreface. The sharp boundary between back-barrier sediments and the overlying shoreface sandstones is thus interpreted as a marine transgressive surface of erosion.
The gamma ray and sonic log trends of the Gert-2, Gert-1 and Jeppe-1 wells indicate clean sandstones that fine-upwards in a stepwise manner. They are also inter- preted as a backstepping succession of shoreface sand- stones. Much of the 'basal sandstone unit' in the 2/12-1 well has been interpreted in a similar way (S6derstr6m et al., 1991). In all wells the transgressive sandstones overlie back-barrier sediments.
The backstepping shoreface sandstones are overlain by offshore claystones of the Lola Formation, sandwiched between the 'basal sandstone unit' and the overlying Heno Formation.
Regressive-transgressive shoreface sandstones Characteristics. The Heno Formation is characterized by an upward coarsening, 15-70 m thick, very fine- to medium-grained sandstone succession overlain by an
MTSE SB2
,ore
I
4293 m GWEN - 2 i t ~ l i Core depth I CI Isil Sand ICgl+ + % Marine Palyno- morphs 0 100
Ill
L
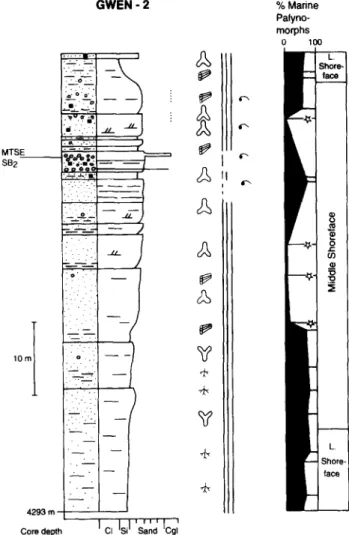
S h o r e - f a c e II it", if) L hore- ~ceFigure 8 Sedimentological core log from the Heno Formation of
the Gwen-2 well. Asterisks indicate samples where the per- centage of marine palynomorphs probably is surpressed due to reworked Lower Jurassic clay clasts (2 mm in diameter) con- taining high amounts of terrestrial palynomorphs. SB2: sequence
boundary no. 2
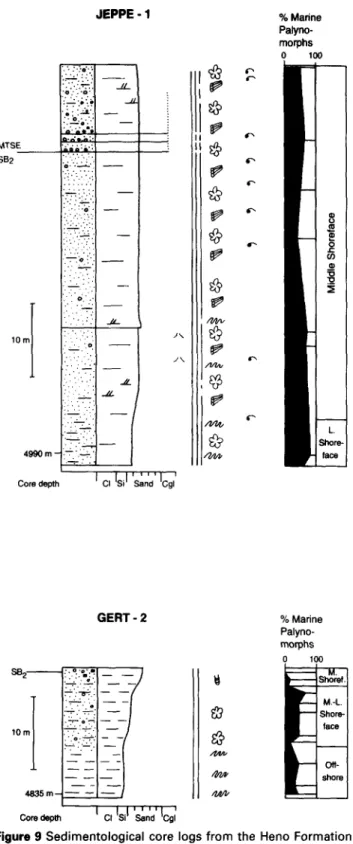
upward fining unit, 15-30 m thick, composed of medium- to very fine-grained sandstone (Figure 4). A con- glomeratic unit is present in Gwen-2 (0.5 m thick) and Jeppe-1 (3 m thick) abruptly overlying the fine- to med- ium-grained sandstones of the upward coarsening suc- cession (Figures 8 and 9).
The sandstones and the conglomeratic unit are typi- cally bioturbated to such a degree that primary sedi- mentary structures are unrecognizable. The trace fossils Helminthoida, Chondrites, Teichichnus, and Thal- assinoides have been identified. Faint parallel bedding and cross-lamination are seen locally. Seven upward coarsening units, 2-15 m thick, characterize the overall 45 m thick, coarsening upward sandstone succession in Gwen-2 (Figure 8). The two uppermost coarsening upward units consist of parallel laminated, medium-grai- ned sandstone beds (15-30 cm thick); these are overlain by the conglomeratic unit (Figure 8).
Quartz clasts, 0.5-3 mm in diameter and often well rounded and spherical, commonly occur scattered within the bioturbated sandstones in the Jeppe-1, Gwen-2 and Gert-2 wells. The conglomerates are typically matrix- supported, but a few clast-supported conglomerate beds, 2-4 cm thick, occur in the Gwen-2 and Jeppe-1 wells. In both cases the clasts are 0.5-2 cm in diameter and the
Upper Jurassic reservoir sandstones: P. N. Johannessen
et al. J E P P E - 1 ". ". : ":'o".; :;~72. _u_• o :, ,o.
:" "-'.;-/ ..~ • _: : .'~:. :..~-:..-.: _ MTSE ~',; ;.:&.: SB2 "'""'" '" ":" • ,~.-..':.. - - .'~ ..;., ".. :. ] ...-. ::. .,.,...- . . m . . . . . . . . . , . . • , , i ., . . . _ _ .... "~" lOre : " i " : : . . . '.o I'. ; : . . : . . . ,.'.'.., // : : . : . ' .#1. ..--~.. Core depth - - ~ J \ J \©
@
% Marine Palyno- morphs o 100 ~r~ 0dr-
.C
0
"0
c'x
ff--
L
face
G E R T - 2 se2 I 10 m I 4835 m - Core depth; ".W'l-
-)
:,~-:--i~. I - - - • , . . . :.'--' i'i - - - - - - I - - J ISi I . . . . ICg I I CI Sand % Marine Palyno- morphs 0 100i
M.
Shoret. M - L Shore- face shore ;Figure 9 S e d i m e n t o l o g i c a l core logs f r o m t h e H e n o F o r m a t i o n of the Jeppe-1 a n d t h e G e r t - 2 w e l l s . SB2: s e q u e n c e b o u n d a r y n o . 2
matrix consists of fine to medium-grained sandstone and contains pyrite, coal fragments and bivalve shells.
The kerogen assemblages are dominated by brown and black wood. The relative abundance of dinoflagellate cysts is high (up to 77% of the total palynomorph assem- blage; Figures 8 and 9). In three samples from the Gwen-
2 well, marine palynomorphs are poorly represented (4- 15% of the total palynomorph assemblage; Figure 8).
Careful examination of these samples, however, shows that they contain small (l mm in diameter) clay clasts with large quantities of reworked Lower Jurassic terrestrial palynomorphs, which 'dilute' the assemblages resulting
in the low relative percentages of Upper Jurassic marine palynomorphs.
Interpretation. The intense bioturbation, the trace fos-
sil assemblage, and the high relative abundance of marine palynomorphs indicate that the sandstones and the con- glomeratic unit were deposited within a well-oxygenated, marine shoreface environment. The abundance of coal clasts, especially in the conglomerates of Gwen-2, sup- ports this interpretation. The kerogen assemblage indi- cates marine conditions with normal salinities and a significant terrestrial influence. The upward-coarsening succession represents the progradation of the lower to middle shoreface, while the fining-upward succession rep- resents subsequent backstepping of the middle to lower shoreface. The conglomeratic unit is interpreted as having been deposited at the turnaround point during maximum regression.
The few preserved cross-laminae indicate the presence of migrating small-scale ripples. The parallel laminated sandstone beds in the Gwen-2 well, underlying the con- glomeratic unit, may have been deposited under upper flow regime conditions during major storms. Sedi- mentation rates were either sufficiently high or the density of burrowing organisms was reduced, resulting in pres- ervation of primary sedimentary structures.
The bioturbated sandstones that dominate the Heno Formation are similary interpreted as the deposits of storm-generated currents that transported sand from the beach out to the middle and lower shoreface. The scat- tered matrix-supported quartz clasts recognized in the Gert-2, Jeppe-1 and Gwen-2 wells were probably deposited on scoured surfaces by storm currents that swept across the sea-bottom; the clasts were subsequently dispersed in the sediment by the burrowing infauna. The seven upward coarsening intervals within the overall pro- gradational shoreface sandstones in the Gwen-2 well may be interpreted as smaller scale prograding shoreface units. The clasts in the conglomerates at the base of the conglomeratic unit in the Gwen-2 and Jeppe-1 wells are, on average, much larger than the outsized clasts within the upward-coarsening shoreface sandstones. The con- glomerates were thus not derived exclusively by rework- ing at the marine transgressive surface of erosion. They were probably originally deposited during maximum regression on a storm dominated shoreface or within fluvial channels. There is no evidence of subaerial exposure such as palaeosols, coal beds, rootlets and des- iccation cracks, suggesting that the conglomerates were reworked during subsequent transgression.
In most wells (e.g. Gert-2, Jeppe-I and Gwen-2) the backstepping upper part of the shoreface sandstones is abruptly overlain by offshore claystones of the Farsund Formation. In contrast, in wells 2/12-1 and 2/I 1-7, far- thest out in the Feda Graben (Figure 4), the shoreface
sandstones gradually fine upwards into the overlying off- shore claystones of the Farsund Formation.
The facies of the Heno Formation are very similar to those described from the Upper Jurassic Ula Formation
(eastern Central Graben, Norway; Taylor and
Gawthorpe, 1993), the Upper Jurassic of the 'Heno Equi- valent' (eastern Central Graben, Norway; Bergan et al.,
1989) and the Upper Jurassic Fulmar Formation (western Central Graben, UK; Johnson et al., 1986; Howell et al.,
1996).
Upper Jurassic reservoir sandstones: P. N. Johannessen
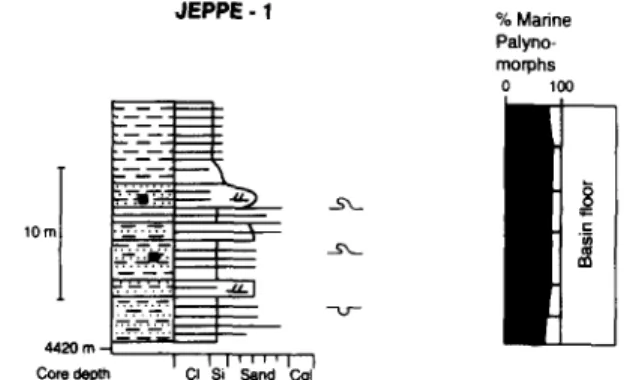
et al. JEPPE-1 % Marine Palyno- morphs o lOO lOre "~' " Z . ".~." .'.~." - - . , u _ ] 4 4 2 0 m - ,Figure 10 Sedimentological core log from the Farsund Formation and the 'hot unit' in the Jeppe-1 well
Offshore claystones
Characteristics. The Lola and Farsund Formation are characterized by claystones with varying content of organic matter, interbedded with thin laminae of dolo- mite, siltstone and fine-grained sandstone (Figure 4) and can be correlated to all the wells in the study area (Figure 4). The claystones contains high amounts of dino- flagellate cysts. The claystones of the Lola Formation contain larger amounts of terrestrially derived material than the Farsund Formation (Jensen et al., 1986; Mich- elsen et al., 1987).
Interpretation. The claystones were deposited in a low- energy offshore marine setting. The claystones of the Lola Formation were probably deposited nearer to the sediment source area than those of the succeeding Far- sund Formation, indicating an overall transgressive trend.
Turbidite sandstones
Characteristics. The uppermost part of the Farsund Formation in the Jeppe-1 well consists of a 45 m thick unit of interlaminated, sandstone-claystone, 12 m of which have been cored (Figures 4 and 10). Two different types of sandstones are recognized: (1) 1-5 cm thick ero- sionally based, normally graded, medium to fine-grained sandstones showing parallel or cross-lamination, and (2) 5-30 cm thick erosionally based, massive, poorly sorted beds of matrix-supported, fine to coarse-grained muddy sandstones with rip-up clasts of claystone, up to 5 cm in diameter. Loading and water escape structures are common in both types of sandstones. Slump sheets in- corporating both facies are common.
The claystone laminae and beds are organic-rich. The upper 6 m of the cored section, form the lower part of the 'hot unit' of Jensen et al. (1986). They consist of parallel-laminated, non-bioturbated claystones and nor- mally graded siltstones, and show very high gamma ray log readings (144 API) (Figure 4). The relative abundance of dinoflagellate cysts is the highest recorded in this study (up to 80% of the total palynomorph assemblage) (Figure
10).
Above the 'hot unit' in the Jeppe- 1 well an approx. 20 m thick interval shows low gamma ray readings increasing upwards, representing an upward fining sandstone suc- cession interbedded with claystones (Figure 11).
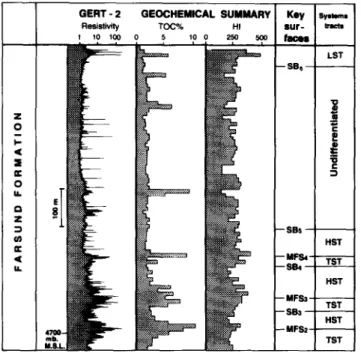
The upper part of the Farsund Formation in the Gert- 2 well is referred to the 'hot unit'. It shows high gamma ray, resistivity, TOC and HI values, testifying to the presence of large amounts of organic matter (Figure 12).
The high gamma ray interval at the same stratigraphical level in the Gwen-2 well is also referred to the 'hot unit'. Interpretation. The high relative abundance of marine palynomorphs and the total lack of bioturbation in the cored section of the Jeppe-1 well, indicate that the sedi- ments were deposited under anoxic bottom conditions.
The thin erosionally based, graded sandstones were deposited from waning turbidity currents; they typically show Bouma B and/or C divisions. The very poor sorting of the thicker sandstone beds suggests deposition from cohesive debris flows (Lowe, 1979).
The organic-rich claystones of the 'hot unit' in Jeppe- 1 were deposited in a low-energy environment in which clay and organic matter settled out of suspension. The normally graded siltstones of the 'hot unit' were deposited from low density turbidity currents. The large amounts of preserved organic matter testify to anoxic bottom con- ditions.
Sequence stratigraphy
The Jurassic section of the study area is very deeply buried and the seismic resolution is limited. Sequence stratigraphic key surfaces, systems tracts and sequences are therefore defined primarily on the basis of sedi- mentological core analysis and petrophysical log patterns. These are then utilised in seismic interpretation.
Sequence !
The lowermost sequence lies unconformably upon Car- boniferous, Permian, and Triassic rocks; the base of the sequence is thus a composite sequence boundary: SB~ (Figures 11 and 13). Sequence 1 consists of a transgressive systems tract followed by a highstand systems tract. Transgressive systems tract
The transgressive systems tract includes the back-barrier deposits and the shoreface sandstones of the 'basal sand- stone unit' with a characteristic backstepping upper part, and the offshore claystones of the Lola Formation (Fig- ures 4 and 11). The high gamma ray readings and high resistivities displayed by the Lola Formation probably reflect a high content of organic matter, as demonstrated for the Farsund Formation (Figure 12). This suggests that the elastic source area had moved progressively further away, allowing organic matter to accumulate on the sea floor from suspension with less dilution from terrestrial siliciclastic sediments. The claystone succession thus rep- resents continued transgression. The most organic-rich interval is interpreted as a condensed section including the maximum flooding surface MFS~ (Figure 11).
The lowermost part of sequence 1 of the Gert-1 well consists of aggrading back-barrier sediments, 60 m thick, overlying the composite sequence boundary, SB~. They are capped by the base of the clean coarse-grained shore- face sandstones marking a landward shift in facies. The boundary between the back-barrier sediments and the overlying shoreface sandstones is interpreted as a marine transgressive surface of erosion (Figures 7 and 11). A seismic marker tied to the clean shoreface sandstones, onlaps the composite sequence boundary, SB], from the deeper to the more shallow part of the Feda Graben, towards the Gertrud Plateau (Figures 11 and 13). This indicates that the marine transgressive surface of erosion
"I {I) Q) Q. "0 (1)
e-
0 0
o
r- Ze-
".M
,,,,j
SYSTEMS TRACTS SEDIMENTARY ENVIRONMENTS NW Gert -2 ~ LST Lowstand Systems Tract ~ Basin floor turbidite sandstone / siltstone i GR DT RES ~ HST Highstand Systems Tract I I Offshore claystone ~o
~
~
~
- o ~ [ I TST Transgressive Systems Tract ~ Offshore sandstone < Gert -1 ~ e== T I~
'
l--i--I~
----~-~--~
I
, ~
--
FS
Flooding
Surface
~
Middle-lower
shore|ace
sst.
O GR DT RES--
o
~
~
o
~
o
~
--- mFS Maximum Flooding Surface ~ Beach-upper shoreface set. ~'~ ~1~ ~ sa Sequence Boundary ~ Back-barrier set. I' ~i M,rs~ Marine Transgressive .... Conglomerate -- Jeppe -1 Surface of Erosion • Sidewall core GR DT RES .... Fault plane in Gert-1 ?,
;
++
+
°+
t0
+,
+
_
,co,e
~/~J Dislance between wells -- ~-- 50 ~-- -SBs ~L' Base Jurassic~'i
=~
~
lo0m
~ 9 H " Hot unit " IJg ~T _~___( ~- + +., ~ .~s, Igl_= <l .+s, ~~I-?-=+ombe,owM.s~
~a~-~
----
~
TST
SB~ J TST 5G02 m below M S L 4319 m below MS.L. FSI -- R-/L: Prim~tivus - Albidum ~P' P:'OIp,: Pallasioioes- Oppressus ~) .~ S.-P+: Scitu4us - Pectinatus E.: Etegans SB1 4 Km I [ S Km ; I 14 Km I E.-A.: E~oxus- Au~issm<~rensis ¢1) PRE-JURASSIC 4938 m below M,S.L. ¢r Late Volgian • rJ) Late Ryazanian ¢b Fc~,r. G~--_-~ I Feda Gv;-b~r,-Gertrud F;--~,au ! Gertrud Plateau / Greben I :::: (1) Figure 11 Sequence stratigraphic correlations of the Upper Jurassic succession of the eastern Feda Graben and the Gertrud Plateau/Graben. For location see Figure 1 ~"Upper Jurassic reservoir sandstones: P. N. Johannessen
et al.GERT - 2 GEOCHEMICAL SUMMARY Key symm=
Resistivity TOG% HI s u r - t r a c t s I 10 100 0 5 10 0 250 500 f ~
,,
,
J
~ ~ LST I - - s e ~ - : =;
J
Z "~ - - SBs - (n HST e- - - MFS4 TST ,4 - - S i ~ - - - MFS3 TST --SB3 - HST *'-- - - MFS2 TSTFigure 12 Geochemical profile of the Upper Jurassic of the Gert-
2 well, modified from Damtoft et a/. (1992). There is a very good
correlation between high resistivity and large content of organic matter (TOC). In the lower part of the Farsund Formation high TOC corresponds to a high hydrogen index (HI), indicating that organic matter is mainly marine derived. SB: sequence boundary. MFS: maximum flooding surface. TST: transgressive systems tract. HST: highstand systems tract. MFS4 corresponds to a seis-
mic marker which can be traced regionally in the Feda Graben
in Gert-1 is older than the 'basal sandstone unit' in Gert- 2 and Jeppe-1.
The 2/12-1 well situated in the same structural position as the Gert-1 well, on the down-thrown side of a normal fault, is characterized by aggrading shoreface-foreshore sandstones, 71 m thick (S6derstrOm et al., 1991), cor- responding to the aggraded back-barrier sediments of the Gert- 1 well. The aggrading sediments were thus deposited while the hanging wall subsided during the Late Kim- meridgian tectonic phase 1, creating new accommodation space at a high rate. At the same time, footwall uplift of the Gertrud Plateau may have resulted in an enlarged
source area and increased sediment input to the Feda Graben. Carboniferous sandstones exposed on the upthrown side of the fault between the Gert-1 and Gert- 2 wells (and cored in Gert-2) may have acted as an additional source for the thick transgressive sandstones of the 'basal sandstone unit' of Gert-1 and 2/12-1, as suggested by the presence of reworked Carboniferous palynomorphs in the sediment pile.
The upper part of the shoreface sandstones in Gert-1 and 2/12-1 backsteps to be overlain by offshore claystones of the Lola Formation (Figures 4 and 11). The trans- gressive systems tract on the Gertrud Plateau (Gert-2 and Jeppe-1) shows the same vertical succession of facies associations as the 'basal sandstone unit' in the Feda Graben (Gert-1 and 2/12-1), but is only 20 m thick; this is probably due to lower subsidence rates resulting in decreased accommodation space (Figure 11). The Gert- 2 and Jeppe-1 wells are characterized by back-barrier sediments, resting on the composite sequence boundary SB1, and overlain by backstepping shoreface sandstones upon a marine transgressive surface of erosion. Offshore claystones of the Lola Formation overlie the shoreface sandstones. The most organic-rich interval is interpreted as a condensed section including a maximum flooding surface which is correlated with the maximum flooding surface in the Feda Graben: MFSI (Figures 11 and 14).
The transgressive systems tract in the southern part of the Gertrud Plateau (Gwen-2) is characterized by a thicker (63 m) succession of offshore claystones and silt- stones of the Lola Formation. The claystones are thick in Gert-1 (87 m) and Gwen-2, but thin between these wells in Gert-2 (11 m) and Jeppe-1 (18 m). This may reflect a transgression towards the Gertrud Plateau from the NW from the Feda Graben and from the SE from the Tail End Graben. The thickness variation of the clay- stones indicates that the southern and northwestern part of the study area experienced larger subsidence rates than the Gertrud Plateau.
Highstand systems tract
A coarsening upward interval above the MFS, is inter- preted as a prograding wedge of a highstand systems tract
Figure 13 Seismic section from the Feda Graben. For location see Figure 1. Modified from Rasmussen (1995)
Upper Jurassic reservoir sandstones: P. N. Johannessen
e t a l .systems tract .~ig~_~.~ \
..
" :;: ~ . . .
~ ~ - . / - /
. _ . ,
~ \
'
= ~ ' ~ ! i : t - / -o~, _ " ' . "o~'-;;
Late Kimmeridgian, Mandal\ ~ Late Kimmeridgian, MFR~ . Manoal\ . x . . "
SB2 High . . . . --" ~ High ~.~" g ,s ..':. • ;.~ ~ s ~ OKtrl*l ~a/~=-~ C,~'~-~ ,,''~, ~ o OZ,,t2.1 ¢.*~-~ . , , - " o ~ ' ~ o ~ " ~ . " ' ~ t e a . . " .
. -..,'; I
°"
_ _ e l , ; ° , < 5 -.=:,
\ IINI IIIIII1,,,,,
l
Late Kimmerldgian, \ ] [ Late Middle Volgian, Mandal \
SB4 " ~ _~'- • Mandal\ . . " 1 I ,owctand systems High ~ ¢
o ~ . . . . ~ - - ~ - ~ - - "' ' ~% ... iiiii
L~,\ o%-~_~_._~,
~_-~
.o..-.
~.o
...
'~"<~i!',!ii'i
,~
llllll
'1
Turbidite sst. ' ~ Active fault I ' ] Offshore clst, "1~.. Probable active ~ Offshore sst.
fault ~ M.-L. Shoreface sst.
Fault not inves- ~ Beach - U. shoreface sst. tigated in this study ~ Back-barrier sst. Submarine high ~ Land, non-deposition
, ~ Clastic supply 0 , 5 km , .- Beach progradation
Danish Central Trough
Figure 14 Late Jurassic p a l a e o g e o g r a p h y of the n o r t h e r n m o s t part of the
on the Gertrud Plateau and the marginal areas of the Feda Graben (Figures 11 and 14). Five upward-coars- ening intervals, each 2-15 m thick, recognized in the prograding shoreface sandstones in Gwen-2, are inter- preted as parasequences within a prograding par- asequence set.
The conglomerates in Gwen-2 and Jeppe-1 on the Ger- trud Plateau are interpreted as marine transgressive lags, representing coarse-grained marine storm beds or coarse- grained fluvial sediments reworked by erosive shoreface processes during transgression. The sequence boundary, SB2, and the marine transgressive surface of erosion are amalgamated and occur at the base of the conglomerate;
this then defines the top of the highstand systems tract (Figures 8 and 9).
The conglomerates in Gwen-2 and Jeppe-1 may, however, also have resulted from submarine or subaerial erosion of the shoreface due to a fall in relative sea level. If such a fall was large, lowstand shoreface sandstones would have been deposited in the Feda Graben and con- stitute a good potential reservoir. These postulated low- stand shoreface sandstones must occur south of the 2/11- 7 and 2/12-1 wells in the Feda Graben, as no shoreface sandstones are recognized in these wells (Figure 4). On the contrary, the shoreface sandstones shale out from the Gertrud Plateau towards the Feda Graben.
Upper Jurassic reservoir sandstones: P. N. Johannessen
et al. Sequence boundary SB2 is placed at the base of themost coarse-grained sandstone in the Gert-2 well (Figure 9). A normal fault probably truncates the upper part of sequence 1 in the Gert-1 well (Figure 11).
Sequence 2
Sequence 2 consists of a transgressive systems tract and a highstand systems tract.
Transgressive systems tract
The fining-upward interval immediately above sequence boundary SB2, consists of storm-dominated, middle shoreface sandstones at the base succeeded by lower shoreface sandstones and capped by offshore claystones. The interval is interpreted as a part of a backstepping wedge, belonging to a transgressive systems tract. The sandy basal part of this systems tract is recognized in the Gert-2, Jeppe-1 and Gwen-2 wells (Figure 11). Their absence in the Gert-1 well is attributed to faulting.
In the three wells, middle to lower shoreface sandstones of the transgressive systems tract are abruptly overlain by offshore claystones of the Farsund Formation (Figures 4 and 11). This abrupt landward shift in facies is inter- preted as a prominent flooding surface, FS2, which is also recognized on seismic sections (Figures 11 and 13). The marked facies change probably largely reflects an abrupt decrease in energy levels due to a major increase in water depth, but may be partly the result of a sudden cessation of supply from nearby sand source areas (Mandal High and Inge High) as a result of complete drowning of these local highs.
The offshore claystones in all four wells are char- acterized by increasing resistivity and gamma ray values and decreasing sonic velocities. This indicates an upward decrease in grain-size and an increase in organic matter (Figure 12). The interval with the highest amount of organic matter is interpreted as a condensed section including a maximum flooding surface, MFS2 (Figures 11 and 14 ). This and subsequent condensed sections (MFS2, MFS3 and MFS,) constitute good oil-prone source rocks (Damtoft et al., 1992).
Highstand systems tract
The uppermost part of sequence 2 is characterized by upward decreasing resistivity and gamma ray values and increasing sonic velocities reflecting a coarsening-upward trend from offshore claystones to silty claystones (Figure 11). This reflects a progradational offshore wedge and is interpreted as a highstand systems tract. The sequence boundary, SB3, forming the top of the highstand systems tract is placed at the most coarse-grained part of the coarsening-upward interval, representing maximum pro- gradation of the offshore wedge. The very fine grain size of the wedge indicates that only the most distal part of a coarser and thicker sandstone wedge, deposited closer to the basin margin, reached the study area.
Transgressive systems tracts
The lowermost part of both sequences is characterized by increasing resistivity and gamma ray readings, accompanied by decreasing sonic velocities. This reflects an upward increase in organic matter indicating depo- sition within backstepping offshore wedges (Figure 12). The successions are interpreted as transgressive systems tracts. The top of the transgressive systems tracts are defined at the most fine-grained level, coinciding with the highest content of organic matter. These horizons represents maximum flooding surfaces, MFS3 and MFS4 of sequences 3 and 4, respectively (Figures 11 and 12). Highstand systems tracts
The uppermost part of both sequences is characterized by upward decreasing resistivity and gamma ray values, increasing sonic velocities and an upward decrease in organic matter, suggesting deposition during pro- gradation (Figures 11 and 12). These claystone and silt- stone wedges are interpreted as highstand systems tracts. The highstand systems tracts are bounded upward by sequence boundaries S B 4 and SB5 at the top of the coars- ening upward succession, representing maximum pro- gradation. Cuttings from the coarsest part of the highstand systems tract in sequence 3 in the Gert-1 and Gert-2 wells contain sand (Figures 11 and 14). The high- stand systems tract of sequence 3 is thickest in the Gert- 1 well (160 m) in the Feda Graben, thinner in the Gert-2 well (80 m) and most thinly developed in the Jeppe-1 and Gwen-2 wells (25 m and 17 m) on the Gertrud Plateau. This is probably the result of higher subsidence rates in the Feda Graben than on the Gertrud Plateau. The low content of silt and sand in this progradational unit, sug- gests that the Mandal High and Inge High were still submerged.
Sequence 5
Undifferentiated systems tracts
The base of sequence 5, SBs, is placed at the top of a prograding offshore claystone-siltstone succession (Fig- ure 1 I). The remaining part of the Lower-middle Middle Volgian of the Farsund Formation displays no clear log trends and sequence 5 has accordingly not been sub- divided into systems tracts. The upper part of this sequence is unconformably overlain by Lower Cre- taceous sediments in the Gert-1 well and overlain by sequence 6 of the Farsund Formation in the Gert-2, Jeppe-1 and Gwen-2 wells.
Sequence 6
Sequence 6 is recognized in the Jeppe-1, Gwen-2 and the Gert-2 wells within the Gertrud Graben and consists of a lowstand and transgressive systems tract (Figure 11). The sequence probably continues into the overlying marly claystones of the Valhall Formation (Figure 3).
Sequences 3 and 4
Sequences 3 and 4 do not include reservoir sandstones. Both sequences are very similar. They consist of a trans- gressive and a highstand systems tract, and are described together.
Lowstand and transgressive systems tract
In the Jeppe-1 well, the base of sequence 6, SB6, is picked at the sharp base of a succession of thin turbidite sand- stones interbedded with organic-rich claystones (Figure 11). The sudden influx of sandstones in the offshore clay-
Upper Jurassic reservoir sandstones: P. N. Johannessen
et al. stones of the Farsund Formation in the upper part of theJeppe-1 well, suggests a fall in relative sea level. The sharp-based succession of the turbiditic sandstones and mudstones are thus associated with the lowstand systems tract; the Mandal High and Inge High were probably emergent at this time (Figure 14 ).
Organic-rich claystones characteristic of the 'hot unit' overlie the turbidite sediments in Jeppe-1, Gert-2 and Gwen-2 (Figure 11). The organic-rich claystones were probably deposited during a period of overall trans- gression, such that organic matter was able to accumulate on the sea floor with progressively less dilution by ter- restrial siliciclastic sediments. The organic-rich claystones are therefore interpreted to have been deposited during early transgression and are referred to the transgressive systems tract. These fine-grained sediments of the 'hot unit' correspond in part to the Norwegian Mandal For- mation (Jensen et al., 1986) (Figure 3).
The Late Jurassic succession in the Gert-2, Jeppe-1, and Gwen-2 wells is condensed but is presumed to be conformably overlain by the more calcareous fine- grained Lower Cretaceous Valhall Formation. Michelsen
et al. (1987) interpreted this transition as the result of an
overall transgression. It seems likely therefore that the transgressive systems tract recognized in the uppermost Farsund Formation continues up into the Lower Cretaceous Valhall Formation.
There has been much discussion of the origin of the organic-rich Upper Volgian-Ryazanian 'hot shales' in the North Sea. Controlling factors proposed in the litera- ture include the development of stratified water columns in restricted basins (Tyson et al., 1979), a dryer climate during the latter part of the Late Jurassic (Wignall and Ruffell, 1990), and sediment starvation during maximum transgression (Price et al., 1993, but see also Posamentier and James, 1993).
We suggest that the 'hot unit' in the present study area may have been deposited in the early part of the transgressive systems tract, following the deposition of sandy basin floor turbidites of the lowstand systems tract. During the early transgression, sea level was still rela- tively low and beginning to rise slowly. Restricted basins with stratified water columns and anoxic sea bottom con- ditions thus persisted during the early part of the trans- gressive systems tract, resulting in the accumulation of organic-rich, non-bioturbated claystones. As proposed by Rawson and Riley (1982), continued sea-level rise may ultimately have resulted in turnover of the water mass with the return of oxic conditions to the deeper graben systems and the onset of deposition of the calcareous Cromer Knoll Group facies.
Discussion
A variety of methods are used to describe the sequence stratigraphic evolution of the study area. The duration and age of the ammonite zones shown in Figure 15 (from Haq et al., 1988) are presented in order to ease com- parisons with the key surfaces of the Exxon chart. Although caution must be exercised when comparing with the eustatic sea level curve of Haq et al., 1988 (see Miall, 1992), correlating sequence stratigraphic key sur- faces has been attempted (Figure 15).
The stratigraphic location of sequence boundaries and
maximum flooding surfaces is shown in Figure 15. In some cases it has been necessary to indicate a time-inter- val ('age uncertainty'), ranging over several ammonite zones, for the sequence boundary or maximum flooding surface, due to poor biostratigraphic resolution. Sequence boundary SB4, and maximum flooding surface MFS: are the most accurately dated surfaces.
Tectonics versus e u s t a s y
Four sequences are recognized within the Mutabilis-Wea- tleyensis chronozones, whereas Haq et al. (1988) only recognized two sequences in the same time range (Figure
15). SB: may be correlated with SB-142 m.y. of Haq et al. (1988), but SB3 and SB4 are not represented on the
eustatic sea level curve.
The present study shows that two tectonic events occurred within the Mutabilis-Weatleyensis chronozones
(Figure 15). The reservoir sandstones of the 'basal sand-
stone unit' within the transgressive systems tract of sequence 1 were deposited during the first tectonic phase characterized by subsidence along N-S trending normal faults. This fault activity ceased before the deposition of the prograding sandstones in the highstand systems tract of sequence 1 and these sediments thus accumulated dur- ing a tectonically quiet period between phase 1 and 2. The progradation of the sandstones may thus be the consequence of a reduced rate of relative sea level rise, due to a low subsidence rate. The next two sequences (3 and 4) were deposited during the second tectonic phase, characterized by NW-SE trending normal faulting (Fig-
ure 15).
The development of sequences may have been con- trolled by footwall uplift, forming new subaerial or sub- marine sediment source areas. Subsidence of the hanging wall would have provided greater accommodation space, resulting in thick prograding shallow marine sandstones sourced by uplifted footwall areas. This is also recognized as an important factor for the distribution of the shoreface reservoir sandstones of the Ula Formation (Stewart, 1993) and the Fulmar Formation (Wakefield et
al., 1993).
SB5 may be correlated with SB-138 m.y. or SB-139 m.y. o f H a q et al. (1988) (Figure 15). It is not possible to subdivide sequence 5 into systems tracts as no well- defined log patterns are recognized. Haq et al. (1988) recognized four sequence boundaries in the same interval (139, 138, 136, and 135 m.y.), including one of the most prominent sequence boundaries (136 m.y.) in the Upper Jurassic (Figure 15). The reason why we only recognize one sequence may be that the whole study area was sub- siding so rapidly during tectonic phase 3, that the eustatic sea-level falls were too small to leave a recognizable sedi- mentological imprint.
SB6 may be correlated with SB-134 m.y. of Haq et al. (1988) (Figure 15). Possible correlatives of SB- 131.5, SB- 129 and SB-128.5 m.y. (of Haq et al. (1988)) within the uppermost Jurassic have not been recognized in the pre- sent study.
In conclusion, the sequence stratigraphic boundaries of this study do not, in all cases, match those presented on the eustatic sea-level curve of Haq et al. (1988). This suggests that either the study area was influenced strongly by tectonism, and/or that the Exxon sea level curve is not eustatic. Underhill (1991) has shown that the Jurassic
Upper Jurassic reservoir sandstones: P. N. Johannessen
et al. E ._= e E 1 2 9 - 1 3 0 - 131 1 3 2 - 1 3 3 - 1 3 4 - 1 3 5 - 1 3 6 - 1 3 7 - 1 3 8 - 1 3 9 - 1 4 0 - 141 - 1 4 2 - Age ¢/) O ,. Z < O n- o m (n < m Z < E C h r o n o z o n e s Albldum S t e n o m p h a l u s Icimii ~' Kochl u~ R u n c t o n l Lamplughi i P r e p i i c o m p h a l u s Primltivus oppril~l Anguiformis KIHtierus ! O k u N n s l s :~ G l a u c o l l t h u s Alblnl Rttonl R o t u n d a Pallasioides Pectinatus H u d l e s t o n l wtmtw~,i, 9¢ltulus E l e g a n s A u t i s s l o d o r e n s i s E u d o x u s M u t a b i l i s East Feda G m b e n . G e ~ u d Grwblm su S W NE S e q u e n c e = ~ r a ~ l g r a p h l c f r a m e w o r k tracts L S T A g e u n c e r t a i n t y SB MFS S e q . s i r e . I C e n t r a l N o r t h S e a MFS b-~te~omphllul K o c h i b~ Pnlpllcom phaluil k = I ~ A n g u l f o r m i s . . . SB e -- ~ p ~ S B e • ~ ~ O k u s e n s i si=
~ Flttoni P e c t i n l l t u s k ~1~ Hudlestonl... s.,- -E5 F s.,
~- . . . MFS4 T " I ~ . ~ s , L l" . . . SB4 H ; ; ~k SB' bt~ p A u t l m l d O d O r e n s i s / i HST I r F rr
/
E u s t a t l c s e a l e v e l (H=q a ,~. 1 m ) High LOw .' ) - - S B -- -- MFS - - - - SB - - - - MFS - - - - $ 8 - - - - MFS -- - - SB - - - - M F S - - - SB - - - - MFS - - - - SB - - -- MFS -- - - SB - - - - M F S - - - - SB - - - - . M F S - - - - SB mF i g u r e 1 5 Time stratigraphic correlation chart of sequence stratigraphic key surfaces, systems tracts and tectonic events for the Feda
Graben-Gertrud Graben area. The eustatic sea-level curve and key surfaces of Haq eta/. (1988) are presented so comparison is possible.
The absolute ages are from Haq et al. ( 1 9 8 8 )
of the Moray Firth, UK, was very much influenced by tectonism. A large amount of data used by Haq et al. (1988) is from the Moray Firth. Underhill (1991) thus concluded that the sea level curve of Haq et al. (1988) cannot represent a eustatic curve for Jurassic times, but must represent a relative sea level curve valid only for the local area of the Moray Firth.
R e g i o n a l correlations
The sequence stratigraphic interpretations presented in this paper can be compared with the subdivision of the Late Jurassic in the central North Sea area presented by Partington et al. (1993). These workers claim that all sequences of the northern and central North Sea are controlled primarily by tectonics and sediment supply and to a lesser degree by eustatic sea level changes. Part- ington et al. (1993) were not able to correlate their sequences with the eustatic sea level curve of Haq et al.
(1988).
According to Partington et al. (1993) the main flooding event, related to the main rift phase in the North Sea, is the 'Eudoxus' flooding occurring in the late part of the Eudoxus chronozone (Figure 15). The 'Eudoxus' flooding surface lies immediately above the shoreface sandstones of the Fulmar Formation, Central Graben, UK (Part- ington et al., 1993). Onshore UK, the main flooding event during the Late Jurassic also occurs during the Eudoxus chronozone (Wignall, 1991).
The main flooding event in our study area is rep- resented by the
MFS2,
overlying thick shoreface sand- stones of the Heno Formation. MFS2 occurs between the Mutabilis and Eudoxus chronozones and is the most accurately dated MFS in this study (Figure 15). Conse- quently it seems as if the main flooding event occurs earlier in the northern part of the Danish Central Trough than in the U.K. Central Graben.The maximum flooding surfaces defined here are difficult to correlate with those of Partington et al. (1993)
(Figure 15). With the exception of the maximum flooding
surface, MFS4, occurring in the Elegans chronozone, we have not recognized any maximum flooding surfaces in the Volgian-Ryazanian succession. Partington et al. (1993) identified eight such surfaces in the same time period. An explanation may be that the study area experi- enced large sedimentation rates during tectonic phase 3, dominated by deposition of offshore claystones. The organic-rich claystones of the 'hot unit' are referred to the Kochi chronozone. Partington et al. (1993) recognize a maximum flooding surface within the same zone, but refer to it as a minor flooding event, compared for instance with the 'Eudoxus' flooding event. We interpret the 'hot unit' as an early transgressive deposit, following the deposition of lowstand turbidite sandstones. During the early transgression, the water column was still strati- fied and organic-rich sediments accumulated on the sea floor under anoxic bottom conditions.