HAL Id: hal-02149407
https://hal-univ-lyon1.archives-ouvertes.fr/hal-02149407
Submitted on 16 May 2020
HAL is a multi-disciplinary open access archive for the deposit and dissemination of sci-entific research documents, whether they are pub-lished or not. The documents may come from teaching and research institutions in France or abroad, or from public or private research centers.
L’archive ouverte pluridisciplinaire HAL, est destinée au dépôt et à la diffusion de documents scientifiques de niveau recherche, publiés ou non, émanant des établissements d’enseignement et de recherche français ou étrangers, des laboratoires publics ou privés.
Mohammad Barakat, Bruno Cheviron, Rafael Angulo-Jaramillo
To cite this version:
Mohammad Barakat, Bruno Cheviron, Rafael Angulo-Jaramillo. Influence of the irrigation technique and strategies on the nitrogen cycle and budget: A review. Agricultural Water Management, Elsevier Masson, 2016, 178, pp.225-238. �10.1016/j.agwat.2016.09.027�. �hal-02149407�
Influence of the irrigation technique and strategies on the nitrogen cycle
and budget: a review
Mohammad Barakata,b, Bruno Chevirona,†, Rafael Angulo-Jaramillob
a
IRSTEA, UMR G-EAU "Gestion de l'Eau, Acteurs et Usages", 361 rue Jean-François Breton, BP 5095, 34196 Montpellier Cedex 5, France
b
Université de Lyon, UMR 5023 Laboratoire d’Ecologie des Hydrosystèmes Naturels et Anthropisés, CNRS, ENTPE, Université Lyon 1, 3 rue Maurice Audin, 69518 Vaulx‐en‐ Velin, France.
Abstract
The objective of this review is to remedy the lack of knowledge about the expected relationship between the irrigation techniques (flood irrigation, sprinkler irrigation, surface and subsurface drip irrigation) and the nitrogen transformations (fixation, mineralization, immobilization and nitrification) or fluxes (denitrification, runoff, volatilization and lixiviation) in agricultural contexts. This study investigates thus the various controls on the nitrogen cycle and budget, either site-specific (soil C/N ratio, pH, salinity, texture and temperature) or corresponding to deliberate strategies in water and nitrogen management. The comprehensive view gained from the gathered literature elements identifies the local variations (in space and time) of soil water content profile as both the strongest control and the control most directly related to the irrigation technique and to the practitioner's decisions. In the overall picture, flood irrigation and sprinkler irrigation are the techniques in which most transformations or fluxes may be enhanced or reduced, also with the risks associated with non-optimal practices. By contrast, subsurface drip irrigation seems the technique with the least unwanted impacts. Besides the academic aspects (bringing together scattered literature elements) an outcome of this review is thus to facilitate decision-making regarding the choice and/or use of irrigation-fertilization techniques and strategies (doses and scheduling) for given agro-pedoclimatic contexts, also for combined agricultural production, economic and site preservation objectives.
1 Introduction
Increased anthropic pressure and growing food demands exerted on cultivated areas have lead to the intensification of agriculture (Galloway et al., 2008; Keys and McConnell, 2005; Konstantinou et al., 2006; Lambin et al., 1991; Vitousek et al., 1997) at the fear of pending runaway Earth contaminations, with the necessity to identify and promote sustainable practices (Alexandratos and Bruinsma, 2012; Tilman et al., 2011). Excessive nutrient and pesticides applications represent one of the most common causes of degradation in surface water and groundwater quality, which makes risk assessment a crucial part of any agricultural management at the plot, catchment and basin scale (Flury, 1993; Long and Sun, 2012; Reichenberger et al., 2007; Rivett et al. 2008). In particular, a comprehensive view of the merits and drawbacks of irrigation and fertilisation strategies requires modelling techniques as well as knowledge of the technological and legal angles (Sutton et al., 2011; van Grinsven et al. 2012). The site-specific optimisation of practices is a wide concern for stakeholders, farmers, agronomists, soil physicists and biogeochemists, in which the first degrees of freedom are the choice of the irrigation technology and technique (FI: flood irrigation, SI: sprinkler irrigation, DI: drip irrigation, SDI: subsurface drip irrigation).
To start from well-established knowledge, soil nitrogen availability has been long known to influence crop and root growth thus to have a direct impact on crop yield, attributing increased death rates for young individuals and leaf yellowing to insufficient nitrogen uptake (Lloyd, 1993; Niste et al., 2013). Conversely, an over-supply of nitrogen into the root zone may also decrease crop yield by stimulating stem growth to the detriment of root growth, grain filling or sugar content, leaving the non-absorbed nitrogen available for lixiviation (Thorburn et al., 2003a; Zahran, 1999). Excessive nitrogen applications are also prone to inhibit the action of the nitrogenase enzyme responsible for the biological fixation of nitrogen (Muthukumarasamy et al., 1999). In complement, any purposive fertigation strategy should also limit, if not suppress, the nitrogen losses towards the atmosphere through denitrification (i.e. the multi-stage conversion of nitrates to nitrogen gas) and ammonia volatilization (Kroeze et al., 2003). The decisions on how, when and where to apply nitrogen should thus arise from a fine understanding of the nitrogen cycle, including the estimation of mineralization rates (Cabrera, 1993; Fierer and Schimel, 2002; Jackson et al., 2008) and that of plant needs at best (Mmolawa and Or, 2000; Soussi et al., 1998; Valé et al., 2007). In all genericity, both crop productivity and the nitrogen budget also depend on the timing of
fertigation (or fertilization) within irrigation events (Ebrahimian et al., 2013), the type of molecules used (Hanson et al., 2006), soil properties (Zotarelli et al., 2007), the location of the fertilizer (Siyal et al., 2012), the splitting of nitrogen doses (Yoseftabar et al., 2012) and the frequency of nitrogen inputs (Gheysari et al., 2009).
In a schematic overview, Fig.1 shows the quantities of interest for the current study, especially the nine forms under which nitrogen appears in the nitrogen cycle (Robertson and Groffman, 2007), sorted here by decreasing oxidation states: nitrate (NO3-, +5), nitrogen
dioxide (NO2, +4), nitrite (NO2-, +3), nitric oxide (NO, +2), nitrous oxide (N2O, +1),
dinitrogen gas (N2, 0), ammonia (NH3, -3), ammonium (NH4+, -3) and organic nitrogen
(R-NH2, -3). The dinitrogen gas represents about 90% of the total nitrogen but the molecule must
be split by lightning (into ammonium) or by symbiotic fixation to become available for plants, and the activity of the nitrogen fixing bacteria depend on the local soil conditions: organic matter, water content and temperature (Zahran, 1999). The organic nitrogen also necessitates the action of soil microorganisms (mineralization into ammonium) prior to its absorption by plant roots (Jackson et al., 2008). In addition to ammonium or direct symbiotic fixation, nitrates are the last source of nitrogen for the plant, through root uptake. Finally, fertilization consists in the input of ammonium or nitrates, while lixiviation designates the loss of nitrates by drainage.
Figure 1 - Schematic overview of the nitrogen cycle and budget, showing the main nitrogen fluxes and transformations in agricultural contexts.
Quite surprisingly, there is still a need for the literature to investigate how several elements of the nitrogen cycle may be influenced by the chosen irrigation and fertilization technique but also strategy (e.g. dates of application, doses applied, formulation of the fertiliser) with an expected impact on the nitrogen budget, thus on the environmental footprint, as well as on several key performance indicators: crop yield, water and nitrogen use efficiency and operating profitability. To our knowledge, these issues have not been explicitly addressed so far, even when discussing the global agricultural or environmental perspectives associated with the nitrogen cycle, as affected by human activities (Bassirirad, 2000; Galloway et al., 2004; Gruber and Galloway, 2008; van Groeningen et al., 2015; Ward, 2012) . The purpose of the current study is to remedy this lack by collecting results, controversies, recommendations and open questions, from existing but dispersed information. This review aims at eventually outlining the influence of the irrigation techniques and associated fertilization strategies on the nitrogen transformations (cycle) and fluxes (budget) through the direct or indirect effects of irrigation techniques on the controlling factors for nitrogen availability for plant roots (soil C/N ratio, pH, salinity, temperature, texture, water content) and nitrogen fate (fertilizer location and scheduling of applications, soil texture, types of molecules used, water content).
NH4+[-3] Ammonium R-NH2 Organic N NO3-[+5] Nitrates NO2-[+3] Nitrites NH3[0] Ammonia NO2-[+3] Nitrites N2 [0] Dinitrogen N2O [+1] Nitrous oxide NO [+2] Nitric oxide A M M O N IF IC A TIO N N IT R IF IC A TIO N (N IT R A TA TIO N ) DENITRIFICATION SY MB IO TIC F IXA TIO N PLANT D EN IT R IF IC A TI O N DENITRIFICATION FERTILIZATION FERTILIZATION RUNOFF, LIXIVIATION
GEOCHEMICAL FIXATION BY LIGTHNING
NITRIFICATION (NITRITATION)
NITROGEN CYCLE & BUDGET
MAIN FLUXES AND TRANSFORMATIONS INVOLVED IN AGRICULTURAL CONTEXTS
This review leans on 177 literature sources to suggest or establish the existence of a correlation between the irrigation techniques and soil nitrogen transformations or fluxes, focusing on these described in Fig.1. Prior to more detailed investigations in the manuscript, several popular clues of this correlation may be sought in that (i) nitrogen losses by lixiviation occur when irrigation reaches its peak in intensity (Kroeze et al., 2003), (ii) even a slight increase in soil water content may drastically enhance denitrification (Davidson, 1992), (iii) the use of new fertigation techniques makes nitrogen application far more efficient (Valé et al., 2007), (iv) irrigation water is the driving force for nitrogen movements, availability and transformation (Sanchez-Martin et al., 2008) and (v) nitrogen mineralization is stronger in regularly irrigated soils than in non-irrigated or irregularly irrigated soils (Valé et al., 2007). These points and other effects of the irrigation techniques and strategies are discussed in this review, first from the angle of nitrogen transformations in Section 2 (fixation, immobilization, mineralization and nitrification) then from that of nitrogen fluxes in Section 3 (denitrification, lixiviation, runoff and volatilization). Section 4 provides elements of discussion around a typical agricultural situation assembled from literature elements then Section 5 offers a brief conclusion on the expected first-order effects of the irrigation technique (and associated fertilization) on the nitrogen cycle and budget.
2 Influence of the irrigation techniques on nitrogen transformations
2.1 Nitrogen fixation
2.1.1 Basics of nitrogen fixation
Nitrogen fixation is the process by which the stable dinitrogen atmospheric gas (N2 in
Fig.1) is converted into "bioaccessible" forms of nitrogen available for biosynthesis. The process can be represented by the following reaction:
2N2(g) + 8H++ 8e− → 2NH3+ H2 (1)
Fixation occurs either in non-biological (fixation by lightning or industrial fixation) or biological (symbiotic fixation) or processes (Galloway et al. 1995, Zahran 1999).
- Geochemical fixation by lightning leads to NOx ions, from the break of the triply bonded N2
- Industrial fixation of gaseous N2 through the Haber-Bosch process for the production of
ammonia under high temperature and pressure conditions writes in simplified form:
N2 + 3H2 → 2NH3 (2)
- Symbiotic fixation necessitates the action of the nitrogenase enzymes. Several species of rhizobium bacteria, living in the nodules of plant roots (ex. Leguminosae family) near the soil-atmosphere interface, perform nitrogen fixation in the course of their metabolism.
2.1.2 Influence of the irrigation technique on nitrogen fixation
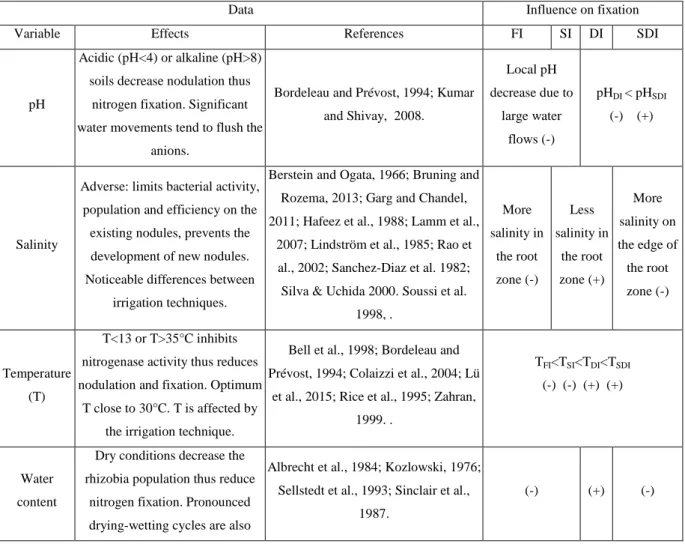
Table 1 lists the soil variables (soil pH, salinity, temperature and water content, by alphabetical order) that control symbiotic nitrogen fixation, with the suggested influence of the irrigation techniques, mainly through their effects on soil water content.
Table 1 – Soil variables that control symbiotic nitrogen fixation, with the expected influence of the irrigation technique (FI: flood irrigation, SI: sprinkler irrigation, DI: drip irrigation, SDI: subsurface drip irrigation). Besides additional comments, this influence is noted (+) for "favorable" and (-) for "unfavorable".
Data Influence on fixation
Variable Effects References FI SI DI SDI
pH
Acidic (pH<4) or alkaline (pH>8) soils decrease nodulation thus
nitrogen fixation. Significant water movements tend to flush the
anions.
Bordeleau and Prévost, 1994; Kumar and Shivay, 2008. Local pH decrease due to large water flows (-) pHDI < pHSDI (-) (+) Salinity
Adverse: limits bacterial activity, population and efficiency on the existing nodules, prevents the development of new nodules. Noticeable differences between
irrigation techniques.
Berstein and Ogata, 1966; Bruning and Rozema, 2013; Garg and Chandel, 2011; Hafeez et al., 1988; Lamm et al.,
2007; Lindström et al., 1985; Rao et al., 2002; Sanchez-Diaz et al. 1982; Silva & Uchida 2000. Soussi et al.
1998, . More salinity in the root zone (-) Less salinity in the root zone (+) More salinity on the edge of the root zone (-) Temperature (T) T<13 or T>35°C inhibits nitrogenase activity thus reduces nodulation and fixation. Optimum
T close to 30°C. T is affected by the irrigation technique.
Bell et al., 1998; Bordeleau and Prévost, 1994; Colaizzi et al., 2004; Lü
et al., 2015; Rice et al., 1995; Zahran, 1999. .
TFI<TSI<TDI<TSDI (-) (-) (+) (+)
Water content
Dry conditions decrease the rhizobia population thus reduce
nitrogen fixation. Pronounced drying-wetting cycles are also
Albrecht et al., 1984; Kozlowski, 1976; Sellstedt et al., 1993; Sinclair et al.,
1987.
unfavorable to fixation.
Differences between irrigation techniques (in this paper, FI: flood irrigation, SI: sprinkler irrigation, DI: drip irrigation, SDI: subsurface drip irrigation) in water amounts and delivery are likely to have temporary thermal effects thus to influence nitrogen fixation. Fixation occurs only in appropriate, medium aeration and water stress conditions (Albrecht et al., 1984), which makes high water contents and the occlusion of soil micropores adverse conditions for nitrogen fixation. By contrast, the pronounced drying/wetting cycles and especially the rather dry conditions typical of SI are said favorable to nitrification, thus to the production of enough nitrates to inhibit nodulation (Kozlowski, 1976). This confirms a more general trend that high nitrates contents (possibly emanating from an independent source, as mineral fertilization) decreases the efficiency of symbiotic fixation (Muthukumarasamy et al., 1999, Thorburn et al., 2003a). The nearly-saturated conditions taking place immediately after the peak water content under SI have also been reported to induce a flash of microbial activity which enhances denitrification (Laher and Avnimelech, 1980) thus also creates unfavorable conditions for fixation. Under SDI, the existence of water stress at low water contents in the upper soil layer may affect the symbiosis between legumes and rhizobia: the fixation of atmospheric nitrogen becomes less efficient, the population of nodules is reduced and so is the nitrogenase activity (Sellstedt et al., 1993; Sinclair et al., 1987). By contrast, the frequent water application in DI maintains soil humidity at a level favorable for nitrogen fixation.
From literature, a significant interplay seems to exist between (i) the irrigation technique, (ii) nitrification and mineralization with effects on soil pH and (iii) fixation as influenced by soil pH (thus indirectly by the cited nitrogen transformations). Soil acidification is caused by the nitrification of excess fertilizers, which lowers soil pH (Han et al., 2015; Malhi et al., 1998). Nitrification and mineralization rates are controlled by microbial activity which in turn is typically related to soil temperature and water content (Colaizzi et al., 2004; Kozlowski, 1976). The various irrigation techniques have specific effects on soil moisture content and temperature fields, thus expectedly on nitrification and mineralization rates, then in turn on soil pH and on nitrogen fixation. For example, the saturated or nearly-saturated conditions found below FI and SI inhibit nitrification thus decrease soil pH and nitrogen fixation (Haynes and Swift, 1987; Parchomchuk et al., 1993). Under DI, the nitrification rate decreases in the vicinity of the emitter but nitrification still occurs outside the saturated
domain. By contrast, water application through SDI enables higher pH values near the soil surface than under DI (Bora and Ray, 2015). Other literature sources (e.g. Kumar and Shivay, 2008) suggest that soils tend to be more acidic under FI or SI due to higher leaching of the bases though this likely depends on soil's parent material and organic content. The reported case is that of basic elements held by soil colloids and organic matter, which leave the exchange sites on the clay particles through crop uptake or leaching, to be replaced by the hydrogen ions. As less water is generally used for DI and SDI, the expected trend is that less basic elements will be replaced, resulting in more fixation.
A consensus exists on the adverse effects of salinity on nitrogen fixation, either from the phenomenological point of view (e.g. Lindström et al., 1985; on Rhizobium behavior) or in studies dedicated to specific crop varieties (e.g. Berstein and Ogata, 1966; for soybean and alfalfa, Garg and Chandel, 2011; for Cajanis Cajan, Hafeez et al., 1988; for Vigna Radiata or Rao et al., 2002; and Soussi et al., 1998; for chickpea). The cases of agricultural (Sanchez-Diaz et al., 1982) and tropical soils (Silva and Uchida, 2000) have been handled. Microirrigation for crop production (Lamm et al., 2007) and some modern challenges of "saline agriculture" (Bruning and Rozema, 2013) have also been recently addressed.
As for salinity, the role of temperature on nitrogen fixation (and on most of nitrogen transformations) is well know from thermodynamics (energy of activation) and has been widely documented, for various species (e.g. Bell et al., 1998; for Lettuce, Colaizzi et al., 2004; for cotton and Lü et al., 2015; for winter wheat) and experimental conditions (e.g. Bordeleau and Prévost, 1994; and Zahran, 1999; for semi-arid contexts or Rice et al., 1995; for low root temperature).
2.2 Nitrogen mineralization
2.2.1 Basics of nitrogen mineralization
The gross N-mineralization is the decomposition of large organic nitrogen molecules (proteins, amino sugars and amino acids present in organic matter, plant residuals or organic manure, noted R-NH2 in Fig.1) into inorganic nitrogen by heterotrophic bacteria using carbon
as their source of energy. Mineralization produces ammonium (NH4+, Ammonification in
NH3+ H2O ↔ NH4++ OH− (3)
NH4+ → NO2− → NO3− (4)
These two forms allow nitrogen uptake by plants roots. Immobilization (also organization or reorganization) is the adverse process, consisting for example in the oxidation of carbonic substrates. The difference between the nitrogen amount that issues from gross N-mineralization and that organized by soil microorganisms is the net N-mineralization depending on the activity or inactivation of the heterotrophic bacteria.
2.2.2 Influence of the irrigation technique on nitrogen mineralization
Table 2 lists the soil variables (soil C/N ratio, pH, salinity, temperature, texture and water content, by alphabetical order) that control nitrogen mineralization or immobilization, with the suggested influence of the irrigation techniques (nitrogen immobilization is the subject of the next subsection), mainly through their effects on soil water content.
Table 2 – Soil variables that control nitrogen mineralization or immobilization, with the expected influence of the irrigation technique (FI: flood irrigation, SI: sprinkler irrigation, DI: drip irrigation, SDI: subsurface drip irrigation). Besides additional comments, this influence is noted (+) for "favorable", (-) for "unfavorable" while (0) indicates "no expected significant effect on the process".
Data Influence on mineralization
Variable Effects References FI SI DI SDI
C/N
C/N<25 favors mineralization but C/N>25 favors immobilization. High
lignin contents allow mineralization for high C/N
ratios.
Aoyama, 1991; Bengtsson et al., 2003; Fox et al., 1990; Haynes, 1986; Janssen 1996, Osemwota et al., 2004; Qian and Schoenau, 2002; Robertson and Groffman, 2007; Sparling
et al., 2015. Expected higher (-) (0) Expected lower (+) pH
Acid soils unfavorable for microorganisms and mineralization. Significant
water movements tend to flush the anions.
Cheng et al., 2013; Fu et al., 1987; Kumar and Shivay, 2008. Local pH decrease due to large water flows (-) pHDI < pHSDI (-) (+) Salinity Excessive surface fertilization causes salinity
issues that reduce mineralization.
Mineralization was found optimum in presence of enough water in soil pores (Cabrera, 1993; Fierer and Schimel, 2002; Valé et al., 2007) either close to field capacity (Myers et al., 1982; Osemwota et al., 2004) or for water contents between 65 and 75% of it (Agehara and Warncke, 2005) when the near-saturation and saturation states were thought to decrease mineralization as they deprive soil microorganisms of the oxygen they need (Borken and Matzner, 2009; Neve and Hofman, 2002; Skopp et al., 1990). By contrast, soil microorganisms show a minimal level of activity for severe water depletion though mineralization has not been reported to completely cease, even near the permanent wilting point (Neve and Hofman, 2002; Sierra, 1997). An expected corollary is that the combined water content and aeration conditions convenient for mineralization are more easily met in rather coarse soils than in clayey soils (e.g. Hassink et al., 1993; Verberne et al., 1990) which outlines the possible effect of soil texture (plausibly a second-order effect though, or only to be considered in conjunction with the influence of the irrigation techniques on water content).
Temperature (T)
Mineralization is inactive for T<5°C, optimal for 25<T<35°C. T is affected by
the irrigation technique.
Bell et al., 1998; Colaizzi et al., 2004; Dalias et al., 2002; , Lü et al., 2015; Stevenson, 1986; Trasar-Cepeda et al., 2007; Wang et al., 2000.
TFI<TSI<TDI<TSDI (-) (-) (+) (+)
Texture
Air circulation in sandy or silty soils is convenient for microorganisms thus for mineralization (unlike clayey
soils).
Hassink et al., 1993; Verberne et al. 1990. (0)
Types of N molecules
Immobilization is higher with ammonia
Azam et al., 1993; Burger and Jackson, 2003; Recous et al., 1990; Vitousek and Andariese,
1986.
(0)
Water content
High values favor mineralization while saturation or too low values are unfavorable.
However, flashes of mineralization occur during
soil desaturation, for near-saturation levels.
Agehara and Warncke, 2005; Bengtsson et al., 2003; Birch, 1958; Borken & Matzner, 2009; Cabrera, 1993; Fierer and Schimel, 2002; Fierer et al., 2003; Franzluebbers, 1999; Khalil, 2008; Kieft et al., 1987; Mikha et al., 2005; Miller et al., 2005, Myers et al., 1982; Neve and Hofman
2002, Osemwota et al., 2004; Ouyang and Li, 2013; Pulleman and Tietema, 1999; Sierra, 1997; Skopp et al. 1990; Thorburn et al., 2003; Valé et al., 2007; Wang et al., 2001; Xiang et al.,
2008.
Precisely, the frequent application of relatively small amounts of water is characteristic of DI and aims at maintaining soil water contents compatible with easy root water uptake. This, in turn, ensures humidity conditions favorable for microbial activity and mineralization (Khalil, 2008; Thorburn et al., 2003b). On the contrary, the less frequent applications of far higher water amounts result in high-magnitude perturbations of soil moisture conditions, in the form of severe drying-wetting cycles, whose extreme water content values are both reported adverse to mineralization (Thorburn et al., 2003a, b). However, “flashes of mineralization” have been observed during the drying-wetting cycles of sprinker irrigation (Birch 1958, Fierer and Schimel, 2002; Fierer et al., 2003; Franzluebbers 1999, Mikha et al., 2005) and related to sharp increases in the number and activity of microorganisms, during short time intervals following the peak in water content. Several hypotheses have been put forward to explain these flashes.
- Very low water contents induce very strong matric potentials for which microbial activity is drastically reduced: soil microorganisms accumulate organic and non-organic solutes in their cells to balance the local matric potential conditions. The next moisture increase (irrigation or precipitation) causes the quick release of most of these trapped solutes into the soil solution, leading to this "flash of mineralization" or "mineralization pulse" (Fierer et al., 2003; Xiang et al., 2008).
- A complementary explanation invokes the perturbation of soil aggregates by the drying-wetting cycles. The mechanical effects of quick and intense moisture increases likely leads to the release of the organic matter trapped in the macro and micro soil aggregates. This increase would also be responsible for the desorption of the organic matter from clayey soil horizons (Bengtsson et al., 2003; Franzluebbers, 1999; Kieft et al., 1987; Miller et al., 2005; Ouyang and Li, 2013).
The C/N ratio, i.e. carbon mass divided by nitrogen mass, directly acts upon the mineralization, immobilization and nitrification of soil nitrogen. Low C/N ratios (C/N<25) favor mineralization through their high mineral nitrogen content while high C/N ratios (C/N>25) enhance nitrogen immobilization by microorganisms. This negative correlation between C/N ratios and mineralization has been widely observed (Bengtsson et al., 2003; Janssen, 1996; Qian and Schoenau, 2002) though plants with high lignin content may exhibit non-negligible mineralization rates even at high C/N ratios (e.g. Aoyama, 1991). However, the degradation of lignin into polyphenols reduces mineralization as these assemble into
complex forms with plant proteins and amino-acids. In such cases, lignin content is often used as a proxy for mineralization besides or instead of the C/N ratio (Fox et al., 1990; Osemwota et al., 2004). In complement, a positive correlation has been outlined between the nitrogen concentration in plants prior to their burying in soils and the mineralization rates subsequently obtained (Haynes, 1986) in absence of any strong concentration in lignin or polyphenols (Fox et al., 1990, Osemwota et al. 2004, Stevenson, 1986). The cited literature suggests that the expected C/N ratio tends to be lower under SDI than under DI, SI and FI because SDI induces lower water contents in the superficial soil horizons where most of microbial activity takes place. This is a consequence possibly drawn (though extrapolated) from differences in C/N ratios observed (Sparling et al., 2015) between irrigated and non-irrigated soils.
Besides the C/N ratio, the nitrogen dose applied is expected to have an effect on soil pH and salinity also (Han et al., 2015), thus on mineralization too. This effect varies with the positioning of the fertilizer: salinity issues appear when using SI and surface fertilizers, possibly reducing the microbial activity. Conversely, the injection of fertilizers in solution with SDI is less prone to reduce the microbial activity (Rietz and Haynes, 2003). Variations in the pH of soil solution also control mineralization, the optimal level being neutral or slightly basic, as acidity is clearly unfavorable to microbial activity thus to mineralization (Cheng et al., 2013; Fu et al., 1987).
Soil temperature also exerts a strong control on microbial activity, thus on mineralization, often said maximal between 25 and 35°C. The doubling of microbial activity for any 10°C-increase above 5°C has been reported (Dalias et al., 2002; Trasar-Cepeda et al., 2007) as well as the existence of the 5°C-threshold under which mineralization cannot take place (Stevenson, 1986). These elements are coherent with the expected increase of activity of the enzymes involved in the degradation of organic matter for temperatures between 30 and 50°C (e.g. Guntinas et al., 2012). As previously said, the irrigation method very likely affects soil physical properties such as the soil temperature (Lü et al., 2015) and a paper mentions field conditions in which the monitored soil temperature was most often higher for DI than for SI which ensures more favorable conditions for mineralization (Wang et al., 2000). Evett et al. (2005) reported smaller soil temperature fluctuations and warmer near-surface temperatures for SDI than for DI, attributing the observed differences to stronger evapotranspiration rates (and the associated cooling effect) under DI than SDI, owing to
higher average water contents. Again, the extrapolation to other irrigation techniques seem possible, resulting in TFI<TSI<TDI<TSDI, in coherence with Bell et al. (1998) and Colaizzi et
al. (2004).
Soil texture is also known to influence mineralization processes: sandy soils and silts a priori favor mineralization because their aerated structure is prone to ensure sufficient oxygen availability for soil microorganisms. By contrast, clayey soils tend to prevent air circulation thus to inactivate mineralization processes. Moreover, the sorption of organic matter on clay particles or sheets reduces its availability for mineralization (Hassink et al., 1993; Verberne et al. 1990).
2.3 Nitrogen immobilization
2.3.1 Basics of nitrogen immobilization
Immobilization is the uptake of mineral nitrogen by microorganisms to synthesize their tissue and develop their own populations. The C/N ratio is often said to decide which one of the immobilization or mineralization prevails over the other (Bengtsson et al., 2003, Robertson and Groffman, 2007) and immobilization will likely be the dominant process in the soils with a high C/N ratio. Besides the irrigation technique, the type and amount of plant residue left on the soil surface or buried in the soil after harvesting is thus expected to decide whether immobilization prevails or not. For example, wheat straw or corn stalks plowed under may stimulate the microbial activity which uses the available nitrogen in soil for decaying plant material. So, immobilization will be the dominant process and will stop once the plant residue has become highly decayed. In contrast, mineralization will directly take place when a legume crop is buried (Dinnes et al., 2002).
2.3.2 Influence of the irrigation technique on nitrogen immobilization
The gross immobilization rate was found between 18 and 119 mg N per soil kilogram and per day in drying-rewetting soils reproducing the conditions of SI (Bengtsson et al., 2003; Pulleman and Tietema, 1999). Other results showed that the immobilization was greater in aerobic conditions (DI or SDI) than under flooded soils (furrow irrigation, Wang et al., 2001).
Finally, immobilization was often found greater when ammonium (NH4+) fertilizers are
applied (Burger and Jackson, 2003; Recous et al., 1990; Vitousek and Andariese, 1986; in Table 2) probably because ammonium is preferred to nitrates (NO3-) for assimilation by the
microorganisms when the two forms are present (Azam et al., 1993).
2.4 Nitrification
2.4.1 Basics of nitrification
Nitrification is the biological oxidation of ammonium (NH4+) in nitrates (NO3-) under
the successive actions of Nitrosomonas bacteria (nitritation stage, NH4+ to NO2-) and bacteria
of the Nitrobacter genus (nitratation stage, NO2- to NO3-, see Fig.1), in the following
sequences: NH4++ O 2 Nitrosomonas → NO2−+ H 2O + H++ e− (5) NO2−+ O 2 Nitrobacter → NO3−+ e− (6)
This makes nitrogen available for plants and microbes, but also prone to lixiviation or denitrification losses (Arp et al., 2002; Klotz, 2011; Sahrawat 1982). Nitrification is either autotrophic or heterotrophic, depending on the bacteria and fungi at play.
- Autotrophic nitrification is performed by bacteria that draw their energy from one of the two stages of the oxidation of ammonium into nitrates (Verstraete and Focht, 1997). Bacteria taking part in the first, nitritation stage are categorized as ammonia-oxidizing bacteria, e.g. Nitrosomonas, Nitrosococcus, Nitrosolobus and Nitrosovibrio. Bacteria involved in the second, nitratation stage belong to the nitrite-oxidizing category, e.g. Nitrobacter and Nitrospira (De Boer and Kowalchuk, 2001, Treusch et al., 2005).
- Heterotrophic nitrification is due to a wide range of fungi and heterotrophic bacteria unable to develop on inorganic grounds, needing organic compounds to synthesize their tissue. Heterotrophic nitrification is generally less than autotrophic nitrification though non-negligible in acid soils (Addiscott et al., 2005).
2.4.2 Influence of the irrigation techniques on nitrification
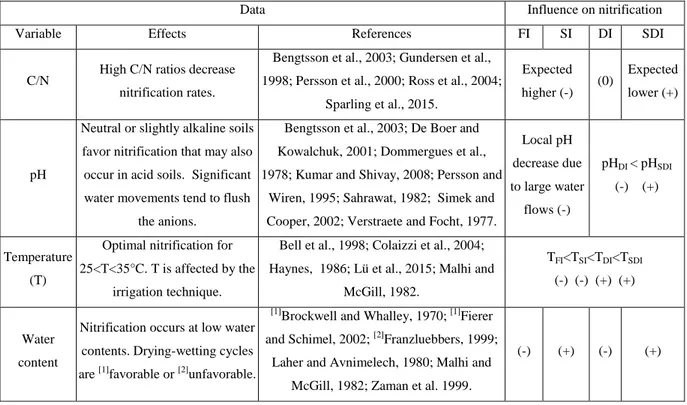
Table 3 lists the soil variables (soil C/N ratio, pH, temperature and water content, by alphabetical order) that control nitrification, with the suggested influence of the irrigation techniques, mainly through their effects on soil water content.
Table 3 – Soil variables that control nitrification, with the expected influence of the irrigation technique (FI: flood irrigation, SI: sprinkler irrigation, DI: drip irrigation, SDI: subsurface drip irrigation). Besides additional comments, this influence is noted (+) for "favorable", (-) for "unfavorable" while 0 indicates "no expected significant effect on the process".
The marked wetting and drying cycles in areas of infrequent precipitation or in SI could lead to enhanced nitrification (Brockwell and Whalley, 1970) as nitrification requires aerobic conditions. Conversely, the lack of oxygen for saturated or near-saturated soils after rainfall or irrigation events potentially takes nitrification down to zero (Laher and Avnimelech, 1980) while significant nitrification rates have been found for very high absolute matric potentials of the order of -33 kPa (Malhi and McGill, 1982). This may seem surprising given that nitrifiers are generally considered to be highly sensitive to water stress. A controversy therefore exists regarding the effect of the repeated drying-wetting cycles on
Data Influence on nitrification
Variable Effects References FI SI DI SDI
C/N High C/N ratios decrease
nitrification rates.
Bengtsson et al., 2003; Gundersen et al., 1998; Persson et al., 2000; Ross et al., 2004;
Sparling et al., 2015. Expected higher (-) (0) Expected lower (+) pH
Neutral or slightly alkaline soils favor nitrification that may also occur in acid soils. Significant water movements tend to flush
the anions.
Bengtsson et al., 2003; De Boer and Kowalchuk, 2001; Dommergues et al., 1978; Kumar and Shivay, 2008; Persson and
Wiren, 1995; Sahrawat, 1982; Simek and Cooper, 2002; Verstraete and Focht, 1977.
Local pH decrease due to large water flows (-) pHDI < pHSDI (-) (+) Temperature (T)
Optimal nitrification for 25<T<35°C. T is affected by the
irrigation technique.
Bell et al., 1998; Colaizzi et al., 2004; Haynes, 1986; Lü et al., 2015; Malhi and
McGill, 1982.
TFI<TSI<TDI<TSDI (-) (-) (+) (+)
Water content
Nitrification occurs at low water contents. Drying-wetting cycles are [1]favorable or [2]unfavorable.
[1]
Brockwell and Whalley, 1970; [1]Fierer and Schimel, 2002; [2]Franzluebbers, 1999;
Laher and Avnimelech, 1980; Malhi and McGill, 1982; Zaman et al. 1999.
nitrification. Such cycles have been reported as unfavorable (Franzluebbers et al., 1994) or favorable (Fierer and Schimel, 2002) in a study with two frequently stressed loam and clay-loam soils, due to a significant increase in the autotrophic nitrifier populations.
A negative correlation has often been stated between the values of the C/N ratio and nitrification rates (Bengtsson et al., 2003; Gundersen et al., 1998; Persson et al., 2000; Ross et al., 2004). For example, this negative relationship resulted in an increase in the nitrification rate from 11.62 to 14.18 mg N per soil kilogram and per day when the C/N ratio decreased from 20 to 10 at temperatures between 18 and 22°C in batch reactors in a study by Feng et al. (2011). The availability of ammonium for nitrification depends first on the intensity of root water and nitrogen uptake, seen as a sink term (Bengtsson et al., 2003; Robertson and Groffman, 2007; Verhagen et al., 1995). In coherence, the burying of crop residuals with high C/N ratios stimulates the microbial activity thus increases the consumption of ammonia, which in turn reduces nitrification (Robertson and Groffman, 2007).
The pH values between 6.5 and 8 have been reported optimal (Persson et al., 2000; Sahrawat, 1982; Sainte-Marie and Paré, 1999) and no autotrophic nitrification is supposed to occur at pH<4.5 because of the exponential decrease of available ammonia (De Boer and Kowalchuk, 2001). However, another study showed the ability of the autotrophic nitrifying bacteria to nitrify at a high rate, with 5.6 g of nitrogen oxidized per liter of soil solution and per day, at a low 3.2 pH, even with a negligible free ammonia concentration of around 10 mg L-1 (Tarre and Green, 2004). Other authors have suggested that the nitrification for similar low pH values depend on the existence of microsites of high pH in acid soils (Rose and Tempest, 1989) or on the presence of biofilms or aggregates, where organisms may be protected against acidity (Boer et al., 1991). As previously mentioned, heterotrophic nitrification may also take place at low pH values (Dommergues et al., 1978; Brierley et al., 2001).
In complement, an increase in soil temperature acts in the expected positive way on nitrification rates (Haynes, 1986) as on the other nitrogen transformations (Bell et al., 1998; Colaizzi et al., 2004; Lü et al., 2015). For example, an incubation experiment involving three soils at -33 kPa and an increase in temperature from 4 to 20°C resulted in an increase of nitrification rates from 0.82 µg N g-1 day-1 to 3.31 µg N g-1 day-1 (Malhi and McGill, 1982).
3 Influence of the irrigation techniques on nitrogen fluxes
3.1 Losses by denitrification
3.1.1 Basics of denitrification
Denitrification designates the reduction of nitrates (NO3-) that leads to gaseous
compounds mainly from the action of anaerobic bacteria, in the following sequence (Ferguson, 1994; Knowles, 1982; Robertson and Groffman, 2007):
𝑁𝑂3− → 𝑁𝑂
2− → NO → 𝑁2𝑂 → 𝑁2 (7)
Most denitrifying bacteria are heterotrophic, e.g. Paracoccus denitrificans, while only a few are autotrophic, e.g. Thiobacillus denitrificans (Rivett et al., 2008).
3.1.2 Influence of the irrigation technique on denitrification
Table 4 lists the soil variables (soil pH, temperature, texture and water content, by alphabetical order) that control denitrification, with the suggested influence of the irrigation techniques, mainly through their effects on soil water content.
Table 4 – Soil variables that control denitrification, with the expected influence of the irrigation technique (FI: flood irrigation, SI: sprinkler irrigation, DI: drip irrigation, SDI: subsurface drip irrigation). Besides additional comments, this influence is noted (+) for "favorable", (-) for "unfavorable" while (0) indicates "no expected significant effect on the process".
Data Influence on
denitrification
Variable Effects References FI SI DI SDI
pH
Optimal range: 7<pH<8. Significant water movements tend
to flush the anions.
Bremner and Shaw, 1958; Kumar and Shivay, 2008; Parkin et al., 1985; Sahrawat and Keeney, 1986; Wijler and Delwiche, 1954.
Local pH decrease due to large water flows (-) (0) Temperature (T)
Positive relationship and optimal denitrification for 25<T<35°C. T is affected by the irrigation technique.
Bell et al., 1998; Bremner and Shaw 1958, Colaizzi et al., 2004; De Klein and Van Logtestijn, 1996; Lü et al., 2015; Stanford et
al., 1975.
TFI<TSI<TDI<TSDI (-) (-) (+) (+)
Texture Fine-textured soils favor anaerobic
Denitrification preferentially occurs in the local anaerobic or global weakly-aerobic conditions associated with average saturation indices of at least 60% (Burford and Bremner, 1975; Ferguson, 1994; Germon and Couton, 1999; Robertson and Groffman 2007). The already mentioned flash of microbial activity for mineralization, that follows the peak in water content during the drying-wetting cycle under SI, was also found prone to increase denitrification (Davidson, 1992; Laher and Avnimelech, 1980; Valé, 2006; Valé et al., 2007). By contrast, the frequent application of limited water doses within DI dictates aerobic conditions, relatively far from soil saturation, that tend to limit denitrification, also when compared to border irrigation (e.g. Sanchez-Martin et al., 2008). One step further, direct observations (Suddick et al., 2011) have recently shown that N2O emissions associated with
fertigation were weaker for SDI than for DI. The most conventional irrigation techniques (SI, border irrigation) create soil regions (micro-sites) with local anaerobic conditions, thus enhancing nitrogen losses by denitrification (Burger et al., 2005; Kennedy et al., 2013; Sanchez-Martin et al., 2008).
Many early works (Bremmer & Shaw, 1958; Parkin et al., 1985, Sahrawat and Keeney, 1986; Wijler and Delwiche, 1954) showed that neutral alkaline conditions (6<pH<8) enhanced denitrification rates, demonstrating very low rates roughly for pH<5 and maximal rates for pH values between 7 and 8. The effects of soil texture on denitrification rates have been explored, to the conclusion that fine soils, that impede water flow, are likely associated with higher denitrification rates than coarse soils (Aulakh et al., 1991; Gilliam et al., 1978,). In other words, for a given soil texture, especially for fine soils, the irrigation techniques associated with saturated conditions are more likely to induce denitrification. In complement, the positive relationship between denitrification and temperature is also well known: the process halts at low positive temperatures and needs temperatures above 20 to 25°C to become really active (Bailey, 1976; De Klein & Van Logtestijn, 1996; Stanford et al. 1975).
Water content
Global or local high and anaerobic conditions favor denitrification. Drying- wetting
cycles favor denitrification.
Burford and Bremner, 1975; Davidson, 1992; Ferguson, 1994; Germon and Couton, 1999; Laher and Avnimelech, 1980; Robertson and
Groffman, 2007; Valé et al., 2007.
3.2 Losses by runoff, volatilization and lixiviation
3.2.1 Nitrogen losses by runoff and volatilization
Nitrogen losses are well-documented terms of the nitrogen cycle and budget, being in direct line with the major environmental issue of surface and groundwater contamination. The reduction of nitrogen losses is a recognized agricultural and economic challenge: to ensure the maximum efficiency of nitrogen applications within sustainable site-preserving practices, techniques and strategies (e.g. Darwish et al., 2003; Li et al., 2004; Schepers et al., 1995; Wang et al. 2001). However, at the level of details suitable for this review, nitrogen losses by runoff and volatilization have less complex and numerous determinants than nitrogen losses by lixiviation. The reader is referred to Carpenter et al. (1998) and references therein for an overview on nonpoint source pollution of surface waters by runoff. Nitrogen volatilization may originate in any ammonium-based fertilizer but urea fertilizers are more prone to volatilization because the hydrolysis of urea increases soil pH, which in turn favors ammonia volatilization as following reactions:
Urea + WaterUrease→ NH4+ (8)
NH4++ OH− pH≫7→ NH
3+ H2O (9)
Soil pH progressively increases a few days after urea application on the soil surface, resulting from the conversion of ammonium to dissolved ammonia, the later available for volatilization. Losses are higher when fertilizers (urea) are placed on the soil surface with no subsequent (or too weak) irrigation or rainfall. The choice of SI immediately after nitrogen application minimizes the losses by volatilization (Viero et al., 2015) and does not induce runoff risks (unlike FI). Urea should be applied for soil temperatures at or below 10°C to ensure low activity of soil microorganisms (Cameron et al., 2013) even if soil water content, not temperature, is the most critical factor said to affect ammonia volatilization (Al-Kanani et al., 1991). Finally there is an interplay between volatilization, runoff and lixiviation: volatilization is minimum when the soil is at or near saturation (i.e. above field capacity) which enhances the conversion of urea to ammonium but also expectedly triggers runoff and drainage, thus lixiviation (Murrell and Snyder, 2006).
3.2.2 Nitrogen losses by lixiviation
Table 5 lists the variables (fertilizer location, scheduling of nitrogen applications, soil texture, types of nitrogen molecules and soil water content, by alphabetical order) that control lixiviation, with the suggested influence of the irrigation techniques.
Table 5 – Soil variables and nitrogen management options that control lixiviation, with the expected influence of the irrigation technique (FI: flood irrigation, SI: sprinkler irrigation, DI: drip irrigation, SDI: subsurface drip irrigation). Besides additional comments, this influence is noted (+) for "favorable", (-) for "unfavorable" while (0) indicates "no expected significant effect on the process".
Data Influence on
lixiviation
Variable Effects References FI SI DI SDI
Fertilizer location
Applications in the root growth domain reduce
lixiviation.
Gardenäs et al., 2005; Haynes, 1985; Siyal et al., 2012; Wiesler
and Itorst, 1994. (+) (-)
Scheduling of N applications within irrigation
events
Fertigation late in the irrigation events reduces lixiviation.
Gärdenäs et al., 2005; Hanson et al., 2006. (+)
Control on the timing (-) Scheduling of N applications within cropping seasons
Dose splitting and/or applications during strong crop growth drastically reduce
lixiviation.
Cote et al., 2003; Dinnes et al., 2002; Gallais and Hirel, 2004; Gärdenäs et al., 2005; Hanson et al. 2006; Hassan et al., 2010; Jokela and Randall, 1989; Li et al., 2005; Mmolawa and Or, 2000; Prunty and Greenland, 1997; Randall and Sawyer, 2008;
Riley et al., 2001; Russelle et al., 1983, Shedeed et al., 2009; Vetsch and Randall, 2004; Yoseftabar et al., 2014.
Control on the scheduling (-)
Texture Coarse soils favor
lixiviation. Asadi et al., 2002; Vlek et al., 1980; Zotarelli et al., 2007. (0)
Types of N molecules
Nitrates more prone to lixiviation than ammonia or urea, especially for high
water contents.
Asadi et al., 2002; Badr and El-Yazied, 2007; Hanson et al.,
2006; Haynes, 1985; Santos et al., 1997. .(+) (-)
Water content Near-saturation and 1D geometries favor lixiviation, 3D infiltration patterns reduce it.
Burguete et al., 2009; Darwish et al., 2003; Mubarak et al.,
Two factors must be taken in consideration to decide the location of the fertilizer. The first factor is the root distribution during the crop growth period (Zeng et al., 2001). Where irrigation is needed, root growth and distribution pattern are generally restricted to the wetted soil volume under the irrigation system (Gardenäs et al., 2005). Thus, the nutrients applied outside this area might not be used by crop roots, being more susceptible to leach below the rooting zone (Haynes, 1986; Siyal et al., 2012; Wiesler and Horst, 1994). The second, complementary factor is to account for the geometrical characteristics of water delivery in the irrigation system, with a trend to increased lixiviation risks for 1D saturated geometries (sprinkler, flood irrigation) in comparison with fertigation in the 2D or 3D flow patterns associated with DI or SDI (Burguete et al., 2009; Darwish et al., 2003; Mailhol et al., 2001; Mubarak et al., 2009).
Recommendations on the timing and duration of fertigation within irrigation events seem to vary between authors, irrigation techniques and site specificities. For example, Gärdenäs et al. (2005), for long-duration micro-irrigations, demonstrated that the largest leaching losses occurred when starting the 2-h fertigation 1 h after the beginning of the irrigation cycle. On the contrary, the smallest leaching losses were obtained when starting the 2-h fertigation 3 h before the irrigation cutoff. As most studies, Hanson et al. (2006) tend to agree with that recommendation while Cote et al. (2003) rather recommend fertigation early in the irrigation cycle.
For most irrigated crops, nitrogen demand and uptake are low at the beginning of the growth stage but drastically increase around the middle of the vegetative growth stage, until at least the first reproductive stage (Gallais and Hirel, 2004; Jokela and Randall, 1989; Russelle et al., 1983). Nitrogen applications should therefore take place during the period of strong crop demand, to ensure maximal efficiency and also to prevent losses by lixiviation (Hassan et al., 2010; Randall and Sawyer, 2008; Riley et al., 2001). A proper timing of fertilization must account for the time lag between nitrogen application and the onset of plant demand: pre-emergence fertilization is associated with increased contamination risks (Dinnes et al., 2002; Prunty and Greenland, 1997; Vetsch and Randall, 2004). However, nitrogen applications just before or at planting may be favorable to avoid nitrogen stresses during early plant growth, when compared to applications a few days later, near the emergence date (Sangoi et al., 2007). Dose splitting (the application of nitrogen at multiple, appropriate times
during the cropping season) has been widely advocated to reduce the lixiviation and denitrification losses as well, saving 25-50% of the nitrogen supply costs (Cote et al., 2003; Gärdenäs et al., 2005; Hanson et al., 2006; Mmolawa and Or, 2000; Shedeed et al., 2009). Dose splitting aims at better meeting plant needs and root demands at the different stages of crop growth (Li et al., 2005, Mailhol et al., 2001, Yoseftabar et al., 2014). For spring crops, nitrogen applications in autumn, before the agricultural season, is prone to avoid nitrification but increases the risk of nitrogen losses by leaching or denitrification. On the contrary, delaying the application to spring is prone to decrease lixiviation and to increase nitrogen use efficiency by 10-15% (Dinnes et al., 2002; Randall and Sawyer, 2008). Moreover, if one decides to supply nitrogen in autumn for spring crops, the NH3 form (anhydrous ammonia)
should be used and buried at 15 cm or more to facilitate the conversion to ammonium (NH4+)
and limit the losses by volatilization.
Soil properties are generally known before the choice of a type of molecule is made, so that soil properties may dictate the type of molecules used in a number of cases. Lixiviation typically occurs in the coarsest soils because of their high water conductivity and low ability to retain the NO3- anions (Asadi et al., 2002; Zotarelli et al., 2007). Conversely, clayey soils
have a low permeability with lesser leaching risks (Vlek et al., 1980). Although plant roots may absorb nitrates NO3-, ammonium NH4+ and urea CO(NH2)2, the behavior of these
nitrogen forms is not equal in the wetted soil, and differences in nitrogen losses may arise from the types of molecules used for fertilization. Nitrates losses have been related to their high mobility and solubility in water (Badr and El-Yazied, 2007) and to the low ability of most soils to retain it, due to the negative charge of soil particles (Asadi et al., 2002). Nitrates are transported mainly by convection, thus expected to leach below the rooting zone if rainfall or irrigation (FI and SI) exceeds the field capacity and potential evapotranspiration of the soil plant system (Santos et al., 1997). Unlike nitrates, ammonium is retained by the negatively charged soil particles, especially when it is injected below the soil surface (SDI), which makes it virtually immobile thus minimizes the lixiviation risk (Hanson et al., 2006). Earlier studies (e.g. Haynes, 1985) found that ammonium applied by DI concentrated in the 10 cm below the dripper, with little lateral movement. By contrast, urea and nitrates had both moved vertically to soil depths of about 70 cm below the emitter and laterally up to 30 cm from the point of application (Badr and El-Yazied, 2007).
Nitrate, ammonium and urea are the main forms of nitrogen fertilizers taken up by plant roots. These molecules have a different behavior in soil and a different effect on the cations vs. anions balance, thus on soil pH. For example, for nitrate-based fertilizers, plants will absorb the nitrates (anions) thus leave the cations in the rhizopsphere, before exuding OH- ions to reestablish the local balance between H+ and OH- ions, which increases soil pH. Conversely, plant roots exude H+ ions if ammonium-based fertilizers or urea are used and absorbed: soil acidification is then induced, which decreases soil pH and creates unfavorable conditions for mineralization: more fertilizer is thus expectedly available for lixiviation (Hinsinger et al., 2003).
4 Implications to agricultural water management
An illustration of typical agricultural cases is proposed in Fig. 2, assembled from various experiments at the IRSTEA "Domain of Lavalette" (43°40’N, 3°50’E, altitude 30m) in Montpellier, France) showing data collected in spring and summer 2014 on several plots equipped with specific, independent irrigation systems. Two Campbell CR10X dataloggers were used to record soil temperatures from Pt100 probes (limited to the 5, 15 and 25 cm depths on all plots, not shown) and water contents (from TDR probes) at a 20-minute time step at several depths. The signals were collected for the 0-10, 10-20, 20-30 and 30-40 cm depths on the non-irrigated plot as well as on the adjacent plot, irrigated by sprinklers. The signals were collected at 0-10, 10-20, 20-30, 30-40, 40-50 and 50-60 cm depths for the other plots. The period of data collection was June 2 to August 11 and Fig.2 shows results obtained between June 13 and June 22. The soil is predominantly loamy and deep, containing on average 18% of clay, 47% silt and 35% sand over the maximal rooting depth of maize. The local hydrodynamic properties are known from experimental campaigns performed on a regular basis: the last campaign took place after the installation of a new subsurface drip irrigation network (buried at 35 cm depth) in the winter 2013/14.
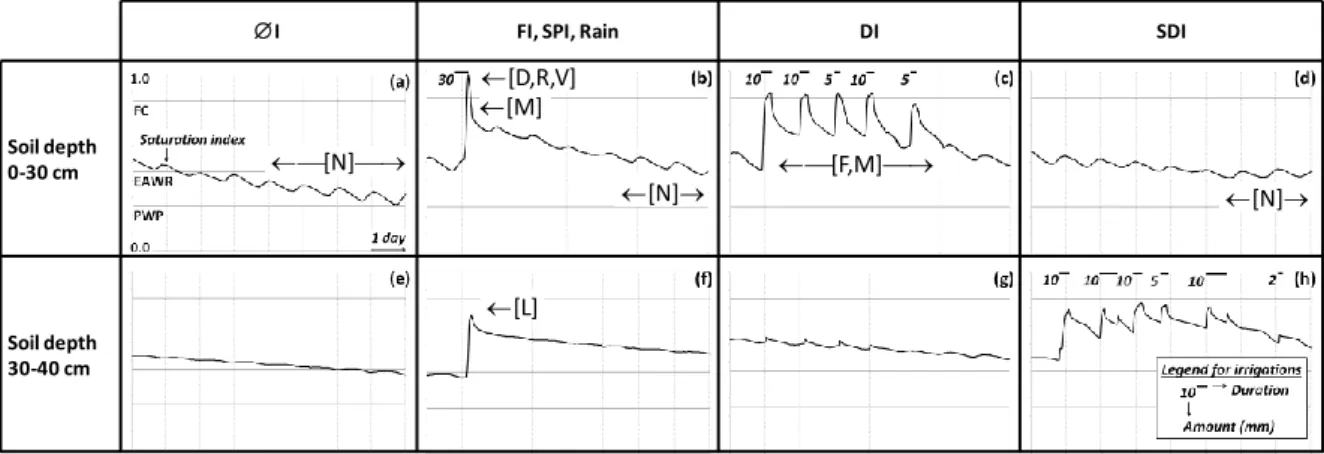
Figure 2a to d shows saturation indices averaged over the first 30 cm of soil, in absence of irrigation (I, Fig. 2a), under sprinkler irrigation (SI, Fig. 2b), drip irrigation (DI, Fig. 2c) and subsurface drip irrigation (SDI, Fig. 2d). Flood irrigation (FI, Fig.2b) was not performed but is presented here for classification purpose, showing more similarities with SI than with any other technique when considering the water content dynamics (even if complete soil submersion results in increased duration of soil saturation or near-saturation in the topsoil
layers). Figure 2e to h describes the effects of the same irrigation techniques (or these of the absence of irrigation) on the saturation indices averages over soil depths between 30 and 40 cm. Although the measurement technique used for data collection (TDR probes) does not offer high-resolution absolute values, their precision is enough to identify the differences between typical soil saturation profiles, associated with the various irrigation techniques.
Leaning on the cited literature elements, Fig. 2 indicates where nitrogen fluxes and transformations are most likely to occur, that is when considering soil water content as their first-order determinant and assuming all other things to be equal (i.e. no noticeable differences in the second-order determinants between the monitored plots). In Fig.2 and in the following, the notations [N], [D], [R], [V], [M], [F] and [L] indicate "favorable" (or maybe risky) conditions for nitrification, denitrification, runoff, volatilization, mineralization, symbiotic fixation and lixiviation, respectively. The purpose and added value of Fig.2 is therefore to provide a comprehensive picture of the expected influence of the irrigation technique on the elements of the nitrogen cycle, thus, in turn, on the nitrogen budget (at least in qualitative terms and with respect to the first-order effects directly linked to the soil water content profiles).
The implications for agricultural water and nitrogen management are several, though depending on the degrees of freedom at the practitioner's disposal in choosing the irrigation technique and/or the crop and/or the irrigation and fertilization strategy. In the typical case of a known soil type (characterized by its C/N ratio, pH, salinity, temperature, texture, i.e. all secondary-order controls for nitrogen transformations listed in Tables 1 to 4) with no choice on the irrigation technique (e.g. sprinkler irrigation: SI), Fig.2b and f indicates which nitrogen transformation and fluxes may likely occur, together with the timing in which they take place. In this example, [D], [R], [V] and [M] depend on the irrigation amount (especially the peak in water content) while [N] rather depends on the time interval between successive irrigations and [L] depends on the irrigation amount first, but also on the series of factors listed in Table 5 (fertilizer location, scheduling of applications, soil texture, type of molecules). More generally, Fig.2 may be used as a reading grid, for guidance or to decipher the effects of irrigation and fertilization strategies, in terms of expected trends, possibly seeking confirmation in local soil water content measurements. However, these main trends may also be altered by particular values of the above mentioned second-order factors, hence
recommending the use of Fig.2 as an entry point and that of Tables 1 to 5 for context-dependent verifications.
Figure 2 - Summary of the expected influence of the irrigation techniques on the nitrogen cycle, as mainly depending on soil water content, represented here by the evolution of the saturation index (y axis) with time (x axis), averaged over different soil depths (0-30 and 30-40 cm). Here, I indicates no irrigation, FI flood irrigation, SI sprinkler irrigation, DI drip irrigation, SDI subsurface drip irrigation. FC is field capacity, EAWR the limit of easily available water reserve and PWP the permanent wilting point. Depending on other contextual elements (see Tables 1 to 5), [N], [D], [R], [V], [M] and [F] indicate favorable conditions for nitrification, denitrification, runoff, volatilization, mineralization and fixation, while [L] indicates lixiviation risks. The plotted data have been collected on several cultivated plots (maize) on the experimental site of Lavalette (IRSTEA Montpellier), for different 10-day periods in spring and summer 2014. Sketches (a) to (h) were chosen to account for "typical situations" and not for detailed comparisons, as briefly discussed in the text, as the tested irrigation strategies were not designed for the present paper.
A complementary representation is proposed in Fig. 3, which exposes the same arguments in a different way. Figure 3 adapts Fig. 1 with the main outcomes of the present review, indicating the preferential associations between irrigation techniques (I, SI, DI, SDI) and nitrogen fluxes or transformations ([N], [D], [V], [M], [F], [L]), i.e. the "active" connections in the chart, once the irrigation technique is known. This allows identifying the merits and drawbacks of (hypothesized) classical strategies associated with the irrigation techniques, for example large irrigation amounts with time intervals of several days for sprinkler irrigation. [M] [F,M] [N] [N] [D,R,V] [L] [N]
I FI, SPI, Rain DI SDI
Soil depth 0-30 cm
Soil depth 30-40 cm
Figure 3 - Schematic overview of the nitrogen cycle and budget, showing the expected favorable influence of the irrigation techniques (I: no irrigation, FI: flood irrigation, SI: sprinkler irrigation, DI: drip irrigation, SDI: subsurface drip irrigation) on the main nitrogen fluxes and transformations, in "typical situations" for agricultural contexts, as shown in Fig.2. [N] accounts for favorable conditions for nitrification, [D] for denitrification, [V] for volatilization, [M] for mineralization and [F] for (symbiotic) fixation.
5 Conclusion
This academic, mostly qualitative review tries to bridge the gap between detailed biochemical studies on nitrogen transformations and fluxes in agricultural soils on the one hand and studies on irrigation techniques and strategies on the other hand. To the authors knowledge, no such overview and comprehensive picture was available to assess the influence of the irrigation techniques on the nitrogen cycle and budget, at least at the chosen intermediate level of complexity that addresses first-order and second-order effects while deliberately discarding the finer details. A wide consensus exists in the literature that the temporal evolution of soil water content profile directly dictates most nitrogen transformations (symbiotic fixation, mineralization, immobilization, nitrification) and fluxes (denitrification, runoff, volatilization and lixiviation) while multiple secondary factors may intervene (soil C/N ratio, pH, salinity, temperature and texture for nitrogen transformations, fertilizer location and scheduling of applications, soil texture and type of molecules for nitrogen fluxes). As irrigation techniques (furrow irrigation, sprinkler irrigation, surface and
NH4+[-3] Ammonium R-NH2 Organic N NO3-[+5] Nitrates NO2-[+3] Nitrites NH3[0] Ammonia NO2-[+3] Nitrites N2 [0] Dinitrogen N2O [+1] Nitrous oxide NO [+2] Nitric oxide [N ] [D] [F ] PLANT FERTILIZATION FERTILIZATION
NITROGEN CYCLE & BUDGET
FAVORABLEINFLUENCE OF THE IRRIGATION TECHNIQUES (I, FI, SI, DI, SDI) ON THE NITROGEN FLUXES AND TRANSFORMATIONS IN THE TYPICALAGRICULTURAL SITUATIONS DISPLAYED IN FIGURE 2. [N] NITRIFICATION, [D] DENITRIFICATION, [V] VOLATILIZATION, [M] MINERALIZATION, [F] FIXATION.
[N] I, SDI I, S D I DI FI, SI FI, SI RUNOFF, LIXIVIATION
subsurface drip irrigation) and strategies may both be characterized by specific patterns of soil water content in space and time, this endows practitioners with several efficient degrees of freedom in deciding agricultural water and nitrogen management practices. Assuming the best decisions are taken when comparisons are possible, this review summarizes typical agricultural situations in simplified, graphical overviews that indicate which irrigation techniques tend to favor which nitrogen transformations and fluxes (at the need of indirect confirmations in the form of local soil water content measurements and the examination of all known secondary factors).
The overview gained on the expected relevant or risky associations between irrigation and fertilization strategies (especially with the benefit of previous in situ experiences) may also be used to decipher more relevant site-specific combined strategies. Fertilization management options especially impact volatilization, runoff and lixiviation fluxes, the latter more complex in their processes but far more plausible for occasionally large irrigation amounts, or the coincidental occurrence of strong rain events soon after fertilization. However, a series of mitigation effects is known from literature and consists in the choice of the right type of molecules (nitrates instead of urea is risky in coarse soils), their application of appropriate doses (meeting plant demands) at relevant locations (where roots will find the fertilizer -depending on the irrigation technique) within a clever scheduling (within-event and/or within-season dose splitting). Finally, furrow irrigation and sprinkler irrigation appear to be the irrigation techniques with the strongest, more numerous and less controlled effects on the nitrogen transformations and fluxes (unless dedicated attention is paid). By contrast, subsurface drip irrigation seems to be the irrigation technique with potentially the least effect on soil's nitrogen cycle, possibly meeting root demands at best, provided roots have grown to a sufficient depth.
Acknowledgements
6 References
Addiscott, T. M., 2005. Nitrate, agriculture and the environment. CAB International, Wallingford, UK, 279 pp.
Agehara, S., Warncke, D.D., 2005. Soil Moisture and Temperature Effects on Nitrogen Release from Organic Nitrogen Sources. Soil Science Society of America Journal 69(6), 1844-1855.
Albrecht, S.L., Bennett, J.M., Boote, K.J., 1984. Relationship of nitrogenase activity to plant water stress in field-grown soybeans. Field Crops Research 8, 61–71.
Alexandratos, N., Bruinsma, J., 2012. World agriculture towards 2030/2050, the 2012 revision. ESA Working Paper No. 12-03, June 2012. Rome: Food and Agriculture Organization of the United Nations (FAO).
Al-Kanani, T., MacKenzie, A. F., Barthakur, N. N., 1991. Soil water and ammonia volatilization relationships with surface-applied nitrogen fertilizer solutions. Soil Science Society of America Journal 55(6), 1761-1766.
Aoyama, M., 1991. Properties of Fine and Water-Soluble Fractions of Several Composts: II. Organic Forms of Nitrogen, Neutral Sugars, and Muramic Acid in Fractions. Soil Science and Plant Nutrition 37, 629–637
Arp, D.J., Sayavedra-Soto, L.A., Hommes, N.G., 2002. Molecular biology and biochemistry of ammonia oxidation by Nitrosomonas europaea. Arch Microbiol 178, 250–255.
Aulakh, M.S., Doran, J.W., Walters, D.T., Power, J.F., 1991. Legume residue and soil water effects on denitrification in soils of different textures. Soil Biology and Biochemistry 23, 1161–1167.
Asadi, M. E., Clemente, R. S., Gupta, A. D., Loof, R., Hansen, G. K., 2002. Impacts of fertigation via sprinkler irrigation on nitrate leaching and corn yield in an acid–sulphate soil in Thailand. Agricultural Water Management 52(3), 197-213.
Azam, F., Simmons, F.W., Mulvaney, R.L., 1993. Immobilization of ammonium and nitrate and their interaction with native N in three Illinois Mollisols. Biol Fertil Soils 15, 50–54. Badr, M. A., El-Yazied, A. A., 2007. Effect of fertigation frequency from subsurface drip irrigation on tomato yield grown on sandy soil. Aust. J. Basic Appl. Sci 1(3), 279-285.
Bailey, L.D., 1976. Effects of temperature and root on denitrification in a soil. Canadian Journal of Soil Science 56, 79–87.
Bassirirad, H., 2000. Kinetics of nutrient uptake by roots: responses to global change, New Phytologist 147(1), 155-169.