Mourad Korichi1,2, Vincent Gerbaud2, Pascal Floquet2, A.-Hassan Meniai3, Saci Nacef4 and Xavier Joulia2
1 LVPRS, Ouargla University, Department of Chemical Engineering, LVPRS, BP 511 Ouargla ALGERIA, [email protected]
2 Laboratoire de Génie Chimique UMR 5503, 5 rue Paulin Talabot, BP 1301, 31106 Toulouse Cedex 01, FRANCE, [email protected]
3 LIPE, Constantine University, Constantine 25000 and 4 LGC, Sétif University, Sétif 19000, ALGERIA
Quantitative Structure – Odor Relationship
Using of Multidimensional Data Analysis and Neural Network Approaches.
I. INTRODUCTION
III. METHODOLOGY
Our input data set contains 121 molecules of balsamic odour splitted in 5 sub-notes of typical odors: anise, balsam, honey, vanilla and sweet (Aldrich Flavors and Fragrances catalog, 2005) (see Table 1).
The dragon software (TALETE, 2005) is used to calculate the molecular descriptors of the input data set molecules.
Figure 1 summarizes the proposed methodology. According to figure 1, two cases are explored (All descriptors are calculated from the 2D molecular representation.):
9Molecular descriptors calculation
o first, 34 simple descriptors (molecular weight, aromatic ratio, number of benzene- like rings, connectivity indices, Kier symmetry index and n-path Kier alpha-modified shape index) are calculated.
o In the second case, 582 molecular descriptors are considered: constitutional descriptors, topological indices, walk and path counts, connectivity and information indices, 2D autocorrelations, edge adjacency indices, burden eigenvalues and topological charge indices.
9Complete Correlation Analysis
select a subset of linearly independent descriptors. Descriptor dependency is evaluated using the Dragon software by setting a predefined value Rmax (In this work, Rmax = 0.97) below which descriptors are considered linearly independent.
9Principal component analysis
It enables us to reduce the molecular descriptors dimensionality by the identification of principal components that can be used in the structure - odor relationship. All eigenvalues > 1 are retained to describe the principal axes.
II. GOAL
we aim to use molecular descriptors as an alternative approach in the prediction of molecule’s odour by the mean of classification and regression techniques.
Odorant compoundsare found in a wide variety of products ranging from foods, perfumes, health care products and medicines. Either combined or alone, flavor and fragrance compounds are used to induce consumers to associate favorable impressions with a given product. In some cases, products have one predominant component which provides the characteristic odor.
In most cases, products containing odors include a complex mixture of fragrant compounds. Some of them are classified within REACH, the European Community document regulating the use of chemicals in terms of environment and toxicity.
Structure – Odour relationships (SOR)are very important for the synthesis of new odorant molecules. This relation is difficult to model due to the subjectivity of the odor quantity and quality (see Table 2). Olfaction phenomenon is not yet completely understood and odor measurements are often inaccurate(Amboniet al., 2000).
Research has been oriented to the use of structural, topological, geometrical, electronic, and physicochemical parameters as descriptors, to generate odor predictive equations.
1.09
Table 1. Input data set of molecular structure
0.95 0.85 to 0.95
58 Sweet
0.75 0.60 to 0.75
15 Vanilla
0.55 0.45 to 0.55
21 Honey
0.35 0.25 to 0.35
18 Balsam
0.15 0 to 0.15
10 Anise
Arbitrary discontinuous Odor codification Arbitrary
continuous Odor codification Number of
compounds Odor
0.95 0.85 to 0.95
58 Sweet
0.75 0.60 to 0.75
15 Vanilla
0.55 0.45 to 0.55
21 Honey
0.35 0.25 to 0.35
18 Balsam
0.15 0 to 0.15
10 Anise
Arbitrary discontinuous Odor codification Arbitrary
continuous Odor codification Number of
compounds Odor
Balsamic
Anise
Honey
Vanilla
Balsamic 9Anise 9Balsam 9Honey 9Vanilla 9Sweet
Selon le référentiel Champs des Odeurs®
Selon la base de données d’Aldrich Inc.
Balsamic
Anise
Honey
Vanilla
Balsamic 9Anise 9Balsam 9Honey 9Vanilla 9Sweet
Selon le référentiel Champs des Odeurs®
Selon la base de données d’Aldrich Inc.
Table 4. The subjectivity of odors Table 3. Discriminant analysis based on
the second PCA study
0.759 58 44 4 5 2 3 Sweet (05)
0.929 14 0 13 0 1 0 Vanilla (04)
0.952 21 1 0 20 0 0 Honey (03)
0.944 18 1 0 0 17 0 Balsam (02)
0.800 10 0 2 0 0 8 Anise (01)
molecules 05 04 03 02 01
Correctly classified Predicted groups
Groups
0.759 58 44 4 5 2 3 Sweet (05)
0.929 14 0 13 0 1 0 Vanilla (04)
0.952 21 1 0 20 0 0 Honey (03)
0.944 18 1 0 0 17 0 Balsam (02)
0.800 10 0 2 0 0 8 Anise (01)
molecules 05 04 03 02 01
Correctly classified Predicted groups
Groups
Table 2. Discriminant analysis based on the first PCA study.
0.603 58
35 4 8 8 3 Sweet (05)
0.857 14
0 12 0 2 0 Vanilla (04)
0.714 21
3 0 15 3 0 Honey (03)
0.778 18
1 1 1 14 1 Balsam (02)
0.800 10
0 2 0 0 8 Anise (01)
molecules 05 04 03 02 01
Correctly classified Predicted groups
Groups
0.603 58
35 4 8 8 3 Sweet (05)
0.857 14
0 12 0 2 0 Vanilla (04)
0.714 21
3 0 15 3 0 Honey (03)
0.778 18
1 1 1 14 1 Balsam (02)
0.800 10
0 2 0 0 8 Anise (01)
molecules 05 04 03 02 01
Correctly classified Predicted groups
Groups
IV. RESULTS AND DISCUSSIONS
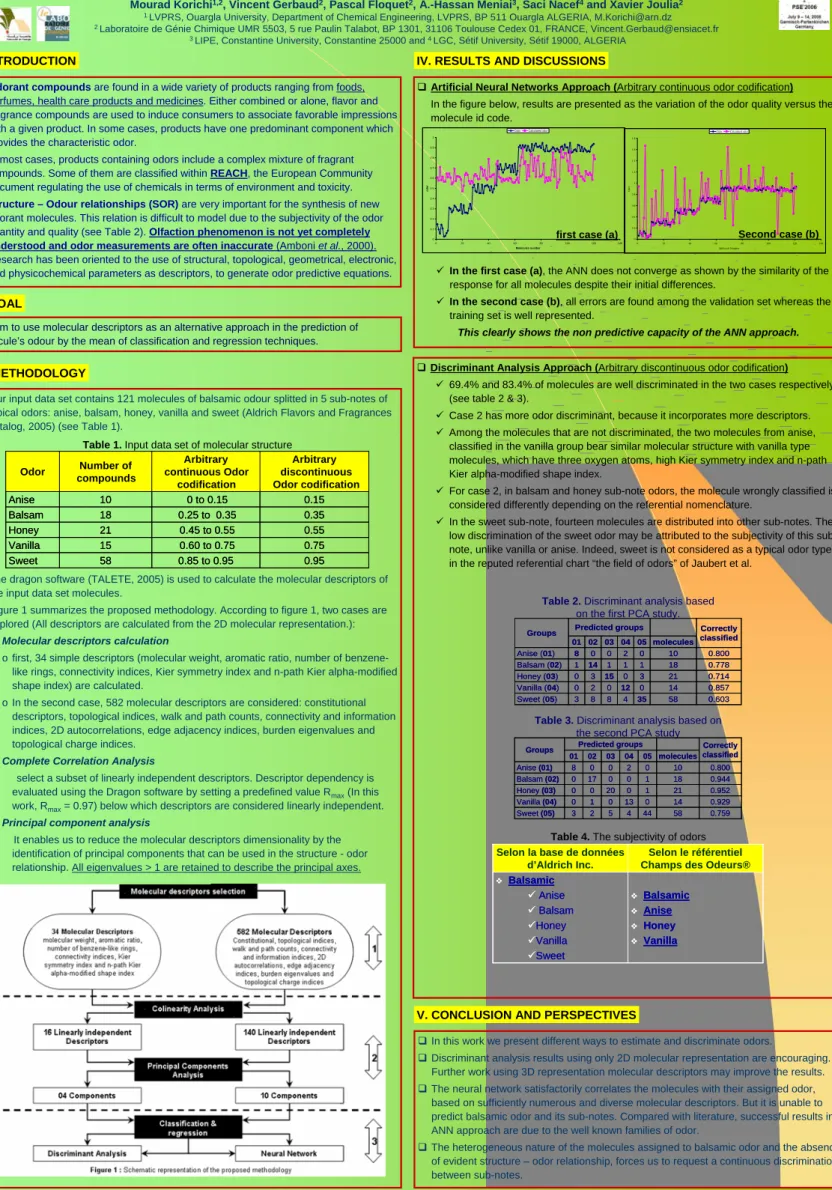
Artificial Neural Networks Approach (Arbitrary continuous odor codification) In the figure below, results are presented as the variation of the odor quality versus the molecule id code.
9In the first case (a), the ANN does not converge as shown by the similarity of the response for all molecules despite their initial differences.
9In the second case (b), all errors are found among the validation set whereas the training set is well represented.
This clearly shows the non predictive capacity of the ANN approach.
Discriminant Analysis Approach (Arbitrary discontinuous odor codification) 9 69.4% and 83.4% of molecules are well discriminated in the two cases respectively
(see table 2 & 3).
9 Case 2 has more odor discriminant, because it incorporates more descriptors.
9 Among the molecules that are not discriminated, the two molecules from anise, classified in the vanilla group bear similar molecular structure with vanilla type molecules, which have three oxygen atoms, high Kier symmetry index and n-path Kier alpha-modified shape index.
9 For case 2, in balsam and honey sub-note odors, the molecule wrongly classified is considered differently depending on the referential nomenclature.
9 In the sweet sub-note, fourteen molecules are distributed into other sub-notes. The low discrimination of the sweet odor may be attributed to the subjectivity of this sub- note, unlike vanilla or anise. Indeed, sweet is not considered as a typical odor type in the reputed referential chart “the field of odors” of Jaubert et al.
0 0.1 0.2 0.3 0.4 0.5 0.6 0.7 0.8 0.9 1
0 20 40 60 80 100 120 140
Molecules number
odor
Odor Calculated odor
0 0.2 0.4 0.6 0.8 1 1.2 1.4 1.6 1.8
0 20 40 60 80 100 120 140
Molecule Number
Odor
Odor Calculated odor
first case (a) Second case (b)
V. CONCLUSION AND PERSPECTIVES
In this work we present different ways to estimate and discriminate odors.
Discriminant analysis results using only 2D molecular representation are encouraging.
Further work using 3D representation molecular descriptors may improve the results.
The neural network satisfactorily correlates the molecules with their assigned odor, based on sufficiently numerous and diverse molecular descriptors. But it is unable to predict balsamic odor and its sub-notes. Compared with literature, successful results in ANN approach are due to the well known families of odor.
The heterogeneous nature of the molecules assigned to balsamic odor and the absence of evident structure – odor relationship, forces us to request a continuous discrimination between sub-notes.