HAL Id: hal-02107191
https://hal.archives-ouvertes.fr/hal-02107191
Submitted on 23 Apr 2019
HAL is a multi-disciplinary open access
archive for the deposit and dissemination of
sci-entific research documents, whether they are
pub-lished or not. The documents may come from
teaching and research institutions in France or
abroad, or from public or private research centers.
L’archive ouverte pluridisciplinaire HAL, est
destinée au dépôt et à la diffusion de documents
scientifiques de niveau recherche, publiés ou non,
émanant des établissements d’enseignement et de
recherche français ou étrangers, des laboratoires
publics ou privés.
How closely do mercury trends in fish and other aquatic
wildlife track those in the atmosphere? – Implications
for evaluating the effectiveness of the Minamata
Convention
Feiyue Wang, Peter Outridge, Xinbin Feng, Bo Meng, Lars-Eric Heimbürger,
Robert Mason
To cite this version:
Feiyue Wang, Peter Outridge, Xinbin Feng, Bo Meng, Lars-Eric Heimbürger, et al.. How closely do
mercury trends in fish and other aquatic wildlife track those in the atmosphere? – Implications for
evaluating the effectiveness of the Minamata Convention. Science of the Total Environment, Elsevier,
2019, 674, pp.58-70. �10.1016/j.scitotenv.2019.04.101�. �hal-02107191�
UNCORRECTED
PROOF
Science of the Total Environment xxx (xxxx) xxx-xxx
Contents lists available at ScienceDirect
Science of the Total Environment
journal homepage: www.elsevier.com
Review
How closely do mercury trends in fish and other aquatic wildlife track those in the
atmosphere?
– Implications for evaluating the effectiveness of the Minamata
Convention
Feiyue Wang
a,⁎, Peter M. Outridge
a, b, Xinbin Feng
c, Bo Meng
c, Lars-Eric Heimbürger-Boavida
d,
Robert P. Mason
eaCenter for Earth Observation Science, Department of Environment and Geography, University of Manitoba, Winnipeg, MB R3T 2N2, Canada bGeological Survey of Canada, Natural Resources Canada, 601 Booth St., Ottawa, ON K1A 0E8, Canada
cState Key Laboratory of Environmental Geochemistry, Institute of Geochemistry, Chinese Academy of Sciences, 46 Guanshui Road, Guiyang 550002, China dAix Marseille Université, CNRS/INSU, Université de Toulon, IRD, Mediterranean Institute of Oceanography (MIO) UM 110, 13288 Marseille, France eDepartment of Marine Sciences, University of Connecticut, 1080 Shennecossett Road, Groton, CT 06340, USA
A R T I C L E I N F O Article history:
Received 17 February 2019 Received in revised form 7 April 2019 Accepted 8 April 2019
Available online xxx Editor: Mae Sexauer Gustin
Keywords: Mercury Aquatic ecosystems Atmospheric emissions Fish Climate change Minamata Convention A B S T R A C T
The Minamata Convention to reduce anthropogenic mercury (Hg) emissions entered into force in 2017, and attention is now on how to best monitor its effectiveness at reducing Hg exposure to humans. To address this, a key question is how closely Hg concentrations in the human food chain, especially in fish and other aquatic wildlife, will track the changes in atmospheric Hg that are expected to occur following anthropogenic emis-sion reductions. We investigated this question by evaluating several regional groups of case studies where Hg concentrations in aquatic biota have been monitored continuously or intermittently for several decades. Our analysis shows that in most cases Hg time-trends in biota did not agree with concurrent Hg trends in atmospheric deposition or concentrations, and the divergence between the two trends has become more ap-parent over the past two decades. An over-arching general explanation for these results is that the impact of changing atmospheric inputs on biotic Hg is masked by two factors: 1) The aquatic environment also con-tains a large inventory of legacy emitted Hg that remains available for bio-uptake leading to a substantial lag in their response time to a change in external inputs; and 2) Biotic Hg trends reflect the dominant effects of changes in multi-causal, local and regional processes (e.g., aquatic or terrestrial biogeochemical processes, feeding ecology, climate) that control the speciation, bioavailability, and bio-uptake of both present-day and legacy emitted Hg. Globally climate change has become the most prevalent contributor to the divergence. A wide range of biotic Hg outcomes can thus be expected as anthropogenic atmospheric Hg emissions decline, depending on how these processes operate on specific regions and specific organisms. Therefore, evaluating the effectiveness of the Minamata Convention will require biomonitoring of multiple species that represent different trophic and ecological niches in multiple regions of the world.
© 2019.
1. Introduction
The entry into force in August 2017 of the Minamata Conven-tion on Mercury was an important step in internaConven-tional efforts to con-trol mercury (Hg) releases into the environment and to protect human health from its harmful effects (www.mercuryconvention.org). Subse-quently, in accordance with Article 22 of the Convention, the Second Conference of the Parties (COP2) in November 2018 turned its atten-tion in part to the quesatten-tion of how best to evaluate the effectiveness of the Convention in meeting its goals (www.mercuryconvention.org/ Meetings/Intersessionalnbsp;work/tabid/6325). Monitoring of biotic Hg concentrations and trends should logically be an important part of
⁎Corresponding author.
Email address: feiyue.wang@umanitoba.ca (F. Wang)
this evaluation, given the central role of aquatic food chains (fish and other aquatic wildlife) in defining human Hg exposure (Basu et al., 2018; Eagles-Smith et al., 2018; Gustin et al., 2016). However, a key question remains as to which extent measurements of Hg in aquatic biota will track the changes in atmospheric Hg that are expected to oc-cur following future anthropogenic emission reductions.
The atmospheric and aquatic chemistry of Hg is one of the most complex of all trace metals. The Hg that is emitted from anthropogenic (and natural) sources to air is almost exclusively inorganic as ele-mental (Hg0) and divalent compounds (HgII) in gaseous and
partic-ulate forms (Obrist et al., 2018). Redox reactions between Hg0and HgII in the atmosphere are primarily photochemically driven (Ariya et al., 2015; Saiz-Lopez et al., 2018), with the bulk of the atmos-pheric Hg deposited onto the Earth's surface (oceans, land, and fresh-waters) being in the form of inorganic HgII. The aquatic environ-ment also receives Hg input, primarily as inorganic HgII, from rivers,
https://doi.org/10.1016/j.scitotenv.2019.04.101 0048-9697/ © 2019.
UNCORRECTED
PROOF
catchment runoff, and submarine groundwater discharge (Fitzgeraldand Lamborg, 2014; Outridge et al., 2018). Once in the aquatic en-vironment, the net transformation of inorganic HgIIthrough methyla-tion to methylmercury (MeHg) is the key step in the Hg cycle lead-ing to wildlife and human exposure. Methylmercury is one of the most bioaccumulative and toxic Hg species and is the only form that is bio-magnified through food chains (Eagles-Smith et al., 2018; Fitzgerald and Lamborg, 2014).
Therefore, the relationship between anthropogenic Hg emissions to the atmosphere and Hg trends in aquatic biota is influenced by many environmental and ecological factors (e.g., temperature, light intensity, pH, redox condition, organic carbon and nutrient concen-trations, and food web structure and dynamics) that control the rates of Hg deposition from the atmosphere, MeHg production (methyla-tion) and degradation (demethyla(methyla-tion) in the aquatic environment, and the uptake of Hg, especially MeHg, by biota (Eagles-Smith et al., 2018; Hsu-Kim et al., 2018). The complexity of these processes, along with the large inventories of legacy anthropogenic and natural Hg stored long-term in terrestrial and aquatic systems, suggests that bi-otic Hg may be only tenuously connected to atmospheric Hg which has a much shorter life-time (0.5 to 2 years) than the decadal or cen-tury-scale life-times of Hg in soils and oceans (Horowitz et al., 2017; Saiz-Lopez et al., 2018). Furthermore, even if atmospheric and bi-otic Hg do follow similar trends, there could be a significant time lag between their response. The response also likely differs in ecosys-tems of different sizes and complexity: changes in biotic Hg in marine ecosystems could lag significantly behind those in smaller, freshwa-ter ecosystems (Sunderland and Mason, 2007; Sunderland and Selin, 2013).
One aspect of the United Nations Environment Programme (UNEP)'s Global Mercury Assessment (AMAP/UNEP, 2019) was a review of relationships between the trends of atmospheric Hg and Hg in fish and other aquatic wildlife, and the reasons for the match or mis-match between those trends. These relationships are important because of their relevance to predicting the efficacy of international regulatory actions, as prescribed in the Minamata Convention, in ul-timately reducing Hg exposure in humans and wildlife. This review examines major case studies on biotic Hg trends in globally distinct regions, and compares them with concurrent atmospheric Hg trends
in the same region, summarized in four regional groups of case stud-ies. The studies are from North America, Europe, China, and the Arc-tic, where Hg concentrations in certain aquatic biota have been mon-itored continuously or intermittently for several decades. No such long-term time-series data for biotic Hg are available for other regions of the world, especially for the Southern Hemisphere. Our findings are then discussed in the context of monitoring the effectiveness of the Minamata Convention.
2. Trends in atmospheric Hg concentration and wet deposition
Before presenting the biotic Hg trend case studies, we first review the general trends in Hg concentrations in air and in wet deposition, with which the aquatic biotic Hg trends will be compared.
2.1. North America and Europe
North America and Europe are considered together here because their overall atmospheric Hg concentrations and deposition fluxes have trended similarly over the past few decades (Zhang et al., 2016). Measured Hg concentrations in the air (as gaseous elemental mercury (GEM), or total gaseous mercury (TGM)) declined by 10–40% be-tween 1990 and 2010 throughout most of North America and Europe (Cole et al., 2014; Slemr et al., 2011; Weiss-Penzias et al., 2016), a pattern that has been matched by trends in Hg concentrations and fluxes in wet deposition (Brigham et al., 2014; Prestbo and Gay, 2009; Weiss-Penzias et al., 2016; Zhang and Jaeglé, 2013), as well as by lake sediment core records (e.g., Drevnick et al., 2016). This general declining trend agrees very well with the declining Hg point-source emissions in North America and Europe over the same period (AMAP, 2010; AMAP/UNEP, 2013), and has been reasonably well reproduced by a recent modelling study with revised global Hg emissions in-ventories (Fig. 1) (Zhang et al., 2016). This model study accounted for the declining emissions from commercial Hg-containing products since 1990, corrected for shifts in the speciation of airborne Hg emis-sions related to air pollution control technology, and reduced the pu-tative importance of atmospheric Hg emissions from artisanal and small-scale gold mining (ASGM).
However, a closer analysis of the observational data in Fig. 1 sug-gests that this systematic declining trend may have become less clear
Fig. 1. Observed and modelled trends for the period of 1990 to 2013 in atmospheric gaseous elemental mercury (Hg0) concentrations (A–C) and divalent HgIIwet deposition fluxes
(D and E) in different regions of the Northern Hemisphere (Zhang et al., 2016). Observations for individual years are shown as squares, with the vertical bars showing ± one standard deviation. The solid line represents a linear regression, whereas the dashed line is the trend line from the GEOS-CHEM simulation. The data are averaged regionally across for North America (A and D), Western Europe (B and E), and high northern latitude regions (C).
UNCORRECTED
PROOF
and uniform, and even reversed, over the most recent decade (i.e.,since ~2008). This is demonstrated by a recent study in North Amer-ica (Weiss-Penzias et al., 2016) that showed gaseous elemental Hg concentrations in the air had stabilized since 2008 with a flat slope over time. While Hg concentrations and fluxes in wet deposition con-tinued to decline in some regions (e.g., Risch and Kenski, 2018), an increasing trend has also been observed throughout North America (Weiss-Penzias et al., 2016). Such a divergency in the recent air Hg trend likely reflects varying local, regional and global influences, and is not reproduced by the model of Zhang et al. (2016) (see Fig. 1). 2.2. China
China is the largest national emitter of anthropogenic Hg to the atmosphere (Fu et al., 2015). In contrast to the global trend, anthro-pogenic Hg emissions in China increased rapidly from 1978 to around 2007 at an average rate of ~5.5% per year, except for the period 1998–2000 when emissions decreased due to the Asian financial cri-sis that led to a reduction in fuel consumption (Wu et al., 2016). Mer-cury emissions in China are reported to have plateaued around 2007 to 2010, and have shown a declining trend in the past few years (Wu et al., 2016). Available but limited data on atmospheric Hg concen-trations over the past decade in China generally agree with this emis-sions trend. Direct measurements of GEM at Guiyang, an urban site in southwest China, showed that annual mean GEM concentrations in-creased at a rate of ~2.5% per year between 2002 and 2010 (Fu and Feng, 2015). GEM concentrations also increased at Mt. Changbai, a remote alpine site in northeastern China, at about the same rate from 2009 to 2013, but appear to have stabilized since (Fu et al., 2015; Fu et al., 2016). Mercury passive sampling and plant biomonitoring on the Tibetan Plateau suggest that atmospheric Hg concentrations were sta-ble during 2006 to 2009 and decreased during 2010 to 2015 (Tong et al., 2016) that agrees with the Hg records in sediment and glacier ice cores from the Tibetan Plateau (Kang et al., 2016).
2.3. The Arctic
Long-term air Hg monitoring data are available at several Arctic sites (above 60°N), such as Alert (Nunavut, Canada), Villum Research Station at Station Nord (Greenland), and Zeppelin Station (Svalbard, Norway). The results show that atmospheric Hg concentrations have been generally declining, but at a markedly slower rate than elsewhere (Cole et al., 2013, 2014). The observed and modelled trends also dis-agreed more than in other regions, with observed GEM concentrations decreasing by ~0.2% per year since 1994, compared to a modelled de-crease of 1.3% per year (Fig. 1). Deposition of atmospheric mercury can occur in the form of oxidized mercury to the Arctic coastal and marine environment during the spring-time atmospheric mercury de-pletion events (Schroeder et al., 1998), and in the form of gaseous el-emental mercury via tundra uptake in the interior Arctic (Obrist et al., 2017). Unfortunately, there are no decade-long observational data of Hg deposition flux available for the Arctic or subarctic regions; exist-ing depositional data are limited to one to two years of measurements only (Sanei et al., 2010).
3. Trends in Hg in aquatic biota and possible causes
3.1. Case study 1: fish and birds in lakes and coastal waters of North America
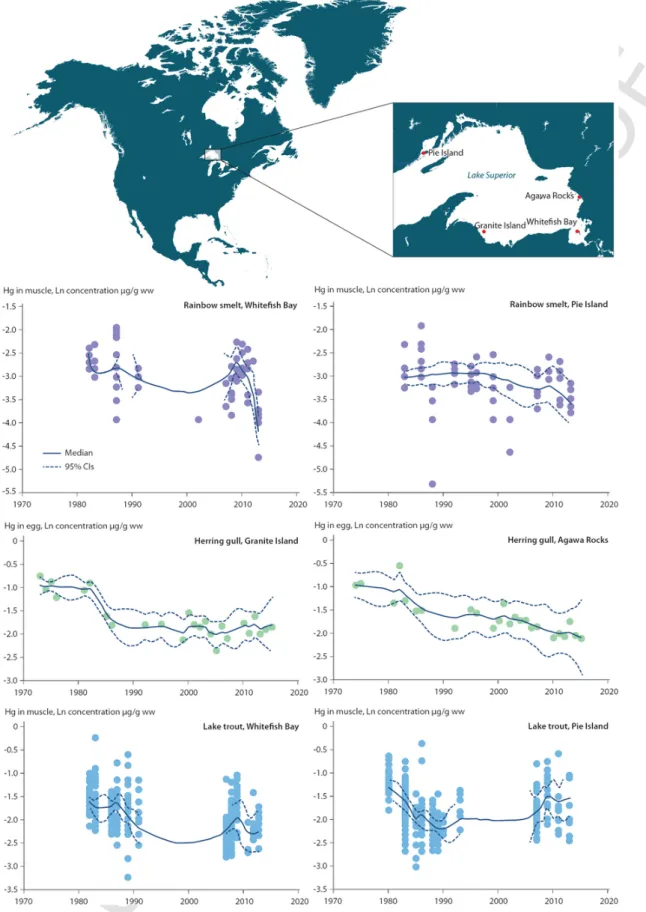
A large number of studies have reported inconsistent, diverging, or mixed temporal trends of Hg in aquatic biota throughout North America. The Great Lakes are an especially interesting study area be-cause of the wide diversity of species monitored within the same gen-eral area, and the length of some of the biotic time trend datasets. Also, there is Hg isotopic evidence from two predatory Great Lakes fish (lake trout Salvelinus namaycush and burbot Lota lota) that estab-lished that the atmosphere, rather than sediments or watershed soils, was the ultimate source of most of the Hg accumulated into fish tis-sues in these large ecosystems (Lepak et al., 2015). This is consis-tent with earlier mass balance studies (Mason and Sullivan, 1997). However, intervening ecological, geochemical or climatic processes may be acting to drive biological time trends along divergent paths. Blukacz-Richards et al. (2017) evaluated the temporal trends since the 1970s of Hg concentrations in eggs of a piscivorous bird (herring gull Larus argentatus), in muscles of two piscivorous fish (lake trout and walleye Sander vitreus) and of a planktivorous fish (rainbow smelt Osmerus mordax) in the Great Lakes. The results presented a mixed temporal pattern (Fig. 2), with declining biotic Hg trends in all species in the first few decades (up to about 1995–2000) that matched the declining atmospheric Hg trend in North America (see Fig. 1). After about 2005, however, trend reversals were detected in most species at some locations. Zhou et al. (2017) also detected a breakpoint at ~2010 in fish Hg trends in the Great Lakes, with a significant decreasing trend before 2010 and no trend or an increasing trend since then.
Similar trend results were reported in fish populations across west-ern Canada and the USA. When examining Hg data on 96,000 fish muscle samples from 206 species in over 4200 lakes, Eagles-Smith et al. (2016) found a significant, rapid decline in length-adjusted tissue Hg concentrations during the 1970s, with no subsequent significant trend up to 2012. In all of these studies, the authors attributed the early decline in biotic Hg to regional and local declines in atmospheric Hg concentrations and deposition related to regional anthropogenic emis-sions controls. They suggested that the subsequent trend reversal or lack of a significant trend, was caused by a variety of factors such as increasing local emissions, food web changes, eutrophication, or cli-mate change.
Contrasting biotic Hg trends have also been reported for other lakes in the same region. When examining temporal fish Hg trends in hundreds of small lakes in Ontario, Canada, Gandhi et al. (2014) found a general decline in length-adjusted fish muscle Hg concentra-tions from the 1970s to 1990s for northern pike (Esox lucius), wall-eye and lake trout, followed by relatively small increases in some lakes starting about 1995–2000. Both the early declining trends and recent increasing trends were more pronounced in northern lakes and in northern pike and walleye compared to lake trout. In contrast, when examining changes in fish muscle Hg from 873 Ontario lakes, Tang et al. (2013) reported no significant decreases over the past several decades in any of the seven species (walleye, northern pike, lake trout, burbot, smallmouth bass Micropterus dolomieu, whitefish Core-gonus clupeaformis and white sucker Catostomus commersonii). In-stead, mean fish Hg concentrations were found to be slightly higher in the period 2005–2010 than in 1974–1981, and were significantly so in northern pike. Such divergent results were also reported in fish Hg in four small lakes within a national park in northern Minnesota
UNCORRECTED
PROOF
Fig. 2. Mercury concentrations (wet weight; natural logarithm-transformed) in muscle of rainbow smelt (planktivorous) and lake trout (piscivorous), and in eggs of herring gull
(pis-civorous) from the Great Lakes region, North America from the 1970s to 2010s (Blukacz-Richards et al., 2017). The solid and dashed lines correspond to the median and the 95% confidence intervals (CIs) of the predicted Hg concentrations.
UNCORRECTED
PROOF
(Brigham et al., 2014) and throughout the State of Massachusetts(Hutcheson et al., 2014) in the USA. Whereas the majority of these lakes showed a decreasing trend in fish Hg between ~2000 and ~2010, a smaller set of lakes showed an increasing or no trend. The diverging trends in fish Hg among lakes from the same region clearly demon-strate the complexity of ecosystem responses to changes in atmos-pheric Hg concentration and deposition, and suggest that other factors besides Hg inputs, likely related to human and climate induced vari-ability, were more important drivers.
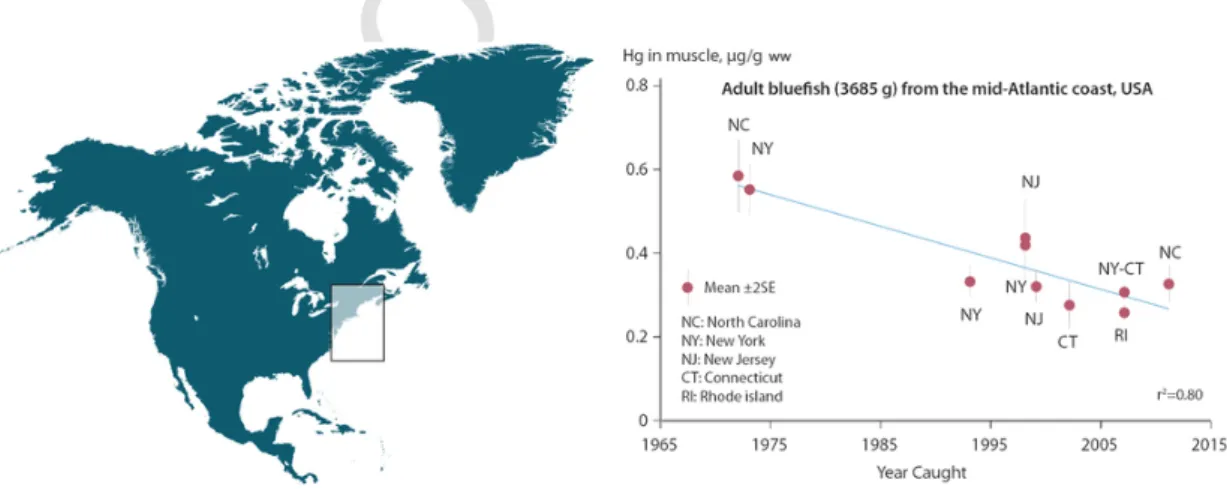
Similarly, a declining trend was found in different populations of the marine species, bluefish (Pomatomus saltatrix), along the north-east coast of the USA. Substantial reductions in muscle Hg, of ~30–40%, were reported when comparing fish caught in the early 1970s with those caught between 1994 and 2011; the New York re-gional data suggested no change in bluefish Hg concentrations after ~1994 (Fig. 3) (Cross et al., 2015).
Most of these studies did not include carbon and nitrogen isotope data, making it impossible to investigate whether changes in feeding behavior (e.g., prey trophic level and feeding location) influenced the Hg trends. The value of including trophic dynamic information in the interpretation of Hg temporal trends was demonstrated by Burgess et al. (2013) in a study of Hg in herring gull eggs on the eastern Canadian seaboard. Between 1972 and 2008, two sites displayed a trend of sig-nificantly declining egg Hg that was consistent with the declining at-mospheric Hg deposition occurring at that time (see Fig. 1). However, when trophic level changes over time were factored into the analysis usingδ15N isotope data, it was found that the Hg declines were due to
feeding behavior shifts.δ15N is a widely-used indictor of the trophic
level of species' prey selection, and was highly correlated with egg Hg in the birds. These results suggest that Hg in the coastal ecosystem in that region may have remained relatively constant over the past few decades despite the reduction in airborne Hg fluxes.
3.2. Case study 2: freshwater fish in Fennoscandia
Braaten et al. (2017) and Åkerblom et al. (2014) assessed the spatial and temporal trends of Hg in various species of freshwater fish (e.g., northern pike, Eurasian perch Perca fluviatilis, brown trout Salmo trutta, Arctic char Salvelinus alpinus, roach Rutilus rutilus) during the past 50 years (1965–2015) based on 54,560 samples from 2775 lakes across Fennoscandia (Sweden, Finland, Norway, and the Kola Peninsula in Russia). Some of the lakes were impacted by his-torical, local industrial emissions of Hg directly to surface water,
whereas others were impacted primarily by atmospheric Hg deposited onto catchment soils as well as water surfaces.
As expected, lakes that were affected by local direct pollution sources had higher mean observed fish Hg concentrations than lakes that were predominantly affected by long-range atmospherically de-posited Hg. When the fish Hg concentrations were normalized to a standard 1-kg pike, the Hg concentrations in“1-kg pike equivalent fish” showed a consistent and significant decreasing trend for the en-tire database (Fig. 4). This declining trend matches very well with the general declining atmospheric Hg trend over northern Europe (see Fig. 1). Of particular interest is the finding that the declining fish Hg trend was much stronger for the entire database than for lakes only impacted by atmospheric Hg deposition. This could suggest that re-duced Hg emissions, especially a reduction in local emission sources, lead to lower Hg in fish. However, Braaten et al. (2017) noted that the temporal trends varied with different standardization methods, and cautioned that a better understanding of possible confounding envi-ronmental processes (such as the impact of temperature and dissolved organic matter) is needed prior to concluding that the two declining trends are causally linked.
Also of note is that some of the lakes in Sweden were treated with lime in the 1970s and early 1980s to mitigate the impact of acidification. Although liming reduced fish Hg concentrations (Meili, 1995), fish Hg concentrations in these limed lakes remained consis-tently higher than in lakes that were not limed decades after the lim-ing (Åkerblom et al., 2014). The temporal trends in both limed and non-limed lakes were, however, similar (Åkerblom et al., 2014). 3.3. Case study 3: fish in reservoirs in North America and Europe versus China
Some of the longest time series of aquatic Hg data exist for man-made reservoirs due to concerns about the effects of impound-ment on Hg methylation rates and thus on fish Hg concentrations. Al-though these reservoirs are not natural habitats for aquatic life, they contain abundant fish and invertebrate communities, and support im-portant recreational fisheries in some areas (e.g., in North America and Europe) and large aquaculture operations in others (e.g., in Asia). Ex-tensive studies in the past decades have revealed very different fish Hg trends in reservoirs in North America and Europe from those in China, neither of which followed the atmospheric Hg trend.
Studies in North America and Europe have shown that following impoundment, the large influx of flooded vegetation and organic mat-ter in submerged soil stimulates microbial methylation of Hg, result
Fig. 3. Mercury concentrations (wet weight) in muscle of piscivorous bluefish (average adult of 3685 g) along the mid-Atlantic coast of the USA from 1972 to 2011 (Cross et al.,
UNCORRECTED
PROOF
Fig. 4. Annual mean mercury concentrations (wet weight) in muscle of five main freshwater fish species (Arctic char, brown trout, perch, pike and roach; normalized to a“standard 1-kg pike equivalent fish”) in 2775 lakes across Fennoscandia from 1965 to 2015 (Braaten et al., 2017). The vertical bars show ± one standard deviation (SD). The green line repre-sents a smoothed linear function, while the grey line reprerepre-sents a linear regression. (For interpretation of the references to color in this figure legend, the reader is referred to the web version of this article.)
ing in a sharp increase in fish Hg due to biomagnification of MeHg (Bodaly et al., 2007; Hall et al., 2005; Lucotte et al., 1999; St. Louis et al., 2004). Mercury methylation rates and fish Hg concentrations typically decrease as the reservoir ages and the organic matter fur-ther decomposes (Bodaly et al., 2007). This was demonstrated in a recent analysis of the temporal trends of Hg in a range of fish species from 883 reservoirs across western North America (Willacker et al., 2016). Temporal patterns (normalized for confounding vari-ables such as species and body length) were clearly related to the time elapsed since reservoir impoundment, with maximum fish Hg concentrations being reached on average three years after the im-poundment (Fig. 5). Fish Hg concentrations thereafter declined rel-atively rapidly for 4-to-12 years, followed by a monotonic slow de-cline over many decades. Because the reservoirs were built at differ-ent dates over the past 150 years, it may be concluded that the fish Hg trends are not directly related to changing atmospheric Hg de-position. Instead, water storage management is shown to be a key factor influencing this temporal pattern. Fish in reservoirs that
ex-perienced maximum drawdown dur
ing summer months (May–July) exhibited significantly higher con-centrations (up to 11-fold) than fish in reservoirs in which drawdown occurred during other times of the year, likely due to oxidation of re-duced sulfide in the sediment while exposed as well as higher micro-bial activities upon inundation, both of which stimulate methylation of Hg.
Indeed, for reservoirs in China, however, fish Hg concentrations may be even less connected with atmospheric inputs (Feng et al., 2018; Hsu-Kim et al., 2018). Extensive studies over the past decade on reservoirs in the Wujiang Basin in southwest China, most of which were actively used for aquaculture, have shown that Hg concentra-tions in the various fish species studied were remarkably low in the reservoirs along the Wujiang River regardless of the age of the reser-voir (Feng et al., 2018). While biodilution and simple (short) food web structures clearly contribute to the generally low fish Hg con-centrations, comparisons of fish Hg concentrations in reservoirs of different age in the same basin reveal three distinct stages of evolu-tion (primary, intermediate, and advanced stages) due to changes in
Fig. 5. Mercury concentrations in muscle of fish (wet weight, size-standardized) from reservoirs across western North America as a function of the reservoir ages (Willacker et al.,
2016). The data show least squares mean ± one standard error (SE); the least squares means account for the effects of ecoregion, waterbody, species, and sampling year. Vertical dashed lines and shaded regions indicate estimated breakpoints (±SE) from segmented linear regression (solid line) on fish Hg concentration when accounting for the effects of ecore-gion, waterbody, species, and sampling year.
UNCORRECTED
PROOF
the source and concentration of organic matter in the submerged soil/sediment as the reservoir ages and cage aquaculture activities increase (Feng et al., 2018). The newly constructed reservoirs in the Wujiang Basin are not active sites of net Hg methylation due to the low or-ganic carbon content in the submersed soils and/or low primary pro-ductivity (Meng et al., 2010; Yao et al., 2011). Consequently, during the primary stage the newly constructed reservoirs are not a net source of MeHg and instead represent a net sink (Zhao et al., 2017; Feng et al., 2018). As these reservoirs become more productive (mesotrophic to eutrophic) with time, the organic matter content in the sediment increases due to continuous increases in autochthonous productivity due to the cage aquaculture activities. This tends to promote in situ Hg methylation, and as such reservoirs at this intermediate stage have transited from a net MeHg sink to a net MeHg source. Over the long-term evolution of the reservoir, primary productivity continues to increase and the reservoir will eventually become eutrophic. Phyto-plankton-derived organic matter, and fish food and feces, become sig-nificant sources of organic matter input to the surface sediments. The increased oxygen consumption during fresh organic matter degrada-tion causes progressively more anoxic condidegrada-tions at the sediment-wa-ter insediment-wa-terface (Meng et al., 2010; Meng et al., 2016) that promotes the microbial Hg methylation processes during this advanced stage of evolution, when both the surface sediment and the hypolimnetic wa-ter were sites of net MeHg production (Feng et al., 2009; Meng et al., 2010; Meng et al., 2016). Thus, in contrast to fish in North Ameri-can reservoirs, and despite the relatively high atmospheric Hg loading across much of China, fish Hg concentrations in Chinese impound-ments reflect within-impoundment processes, especially organic mat-ter loadings to sediments, wamat-ter/soil quality, food web structure, and biodilution, rather than atmospheric inputs (Feng et al., 2018). 3.4. Case study 4: the Arctic
Rigét et al. (2011) summarized all available temporal Hg datasets on Arctic biota up to about 2009, and found that some species in some locations had shown significant increases over recent decades, whereas others with closely adjacent or overlapping distributions ex-hibited decreases or non-significant changes. Most of the increasing biotic Hg trends occurred in marine species in the North American and west Greenlandic sector of the Arctic, whereas most declining trends were observed in east Greenlandic and European Arctic biota. This re-gional dichotomy is clearly seen in the hair of polar bears (Ursus mar-itimus), and has been suggested to be due to increased emissions from Asia entering the western Arctic coincident with decreasing emissions from North America and Europe in the eastern Arctic (Dietz et al., 2006).
A few additional studies have since been published. Rigét et al. (2012) analyzed temporal trends of Hg in livers of ringed seals (Pusa hispida) collected from the early 1980s to 2010 from Greenland. In-creasing concentrations of Hg were found in ringed seals in two out of three Greenlandic seal populations (Central East and Northwest Greenland), rising at a rate of 10.3% per year and 2% per year, re-spectively. In addition to age and trophic position, the study showed that the Atlantic Oscillation Index, a parameter related to climate vari-ability, was positively associated with Hg concentrations in seals al-though the specific mechanism involved was not clear. Similarly, the long-term variability in beluga Hg from the Beaufort Sea region has been shown to be associated, with a lag time, with the Pacific Decadal Oscillation (Loseto et al., 2015).
By analyzing Hg in the teeth of polar bear from Svalbard in the Norwegian Arctic, Aubail et al. (2012) reported a decreasing trend in
Hg concentration over the period 1964–2003 (Fig. 6B). Since no tem-poral changes were found in toothδ15N andδ13C, they concluded that
the decrease of Hg was not due to changes in trophic dynamics; in-stead, it was more likely to be due to a lower environmental Hg expo-sure in the region. McKinney et al. (2017) also reported a significant declining trend in hair Hg of the southern Beaufort Sea polar bear pop-ulation, at an average rate of −13% per year, between 2004 and 2011. This finding differs from the general west-east trend patterns in Arctic biota Hg noted above. However, only male Polar Bears in the south-ern Beaufort Sea area exhibited significant decreases; females from the same area showed no significant trend. Mercury concentrations in the bears' main prey (ringed seal) also showed no change up to 2007 (Gaden et al., 2009), which argues against changes in Hg inputs or the biogeochemical Hg cycle as contributing to the decline. Analyses of body condition and diet led to the conclusion that the bears' Hg trend was due to changing foraging patterns over time and not to alteration in environmental Hg concentrations (McKinney et al., 2017).
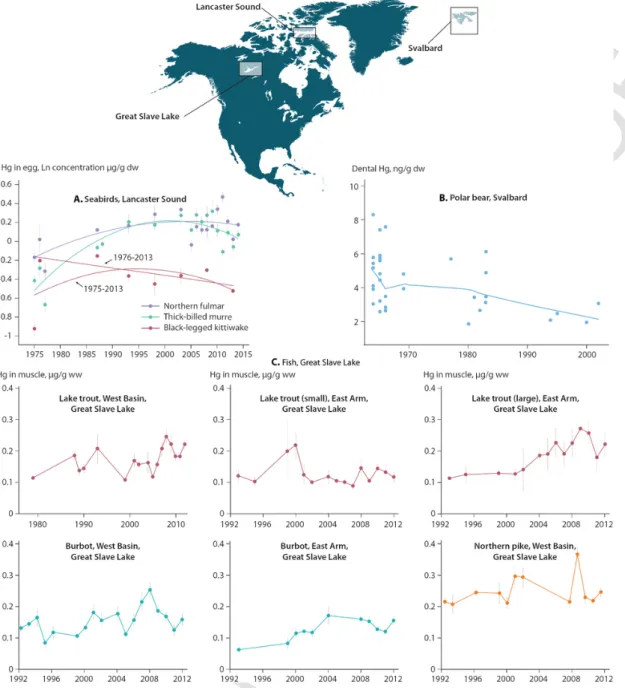
Braune et al. (2014) reported the temporal trend of Hg in thick-billed murre (Uria lomvia) eggs from Coats Island, northern Hudson Bay, and Prince Leopold Island in Lancaster Sound, Nun-vut. Although there was no significant change in Hg concentrations in murre eggs from Coats Island from 1993 to 2013,δ15N values for
the eggs were found to be decreasingly significantly, suggesting a de-cline in trophic position for the bird due to a dietary switch from Arc-tic cod (Boreogadus saida) to capelin (Mallotus villosus). After ad-justing egg Hg concentrations for the decline in trophic position, time trends in Hg concentration at Coats Island changed from non-signifi-cant to signifinon-signifi-cantly increasing. In contrast, at Prince Leopold Island, after adjustment for trophic position the egg Hg time trends changed from non-significant to significantly decreasing over the same period. These results suggest that in addition to trophic change in diet, there may have been other geographic factors at play that influenced Hg concentrations at the base of the marine food web, such as differences in Hg deposition, or in Hg bioavailability related to climate change.
Subsequently, Braune et al. (2016) updated the Hg trends in High Arctic seabird eggs at Prince Leopold Island to 2014 for five species: thick-billed murre, northern fulmar (Fulmarus glacialis), black-legged kittiwake (Rissa tridactyla), black guillemot (Cepphus grylle), and glaucous gull (Larus hyperboreus). The first three species' eggs had been collected from the Island as early as 1975, while the guillemots and gulls were sampled from 1993 to 2013. Egg Hg trends were ad-justed for possible shifts in trophic position of the birds usingδ15N
data. Adjusted Hg concentrations in eggs of murres, fulmars and kitti-wakes increased from 1975 to the 1990s, followed by a plateauing or slight decline from the 1990s to 2014 (Fig. 6A). However, the kitti-wake trend was strongly influenced by the 1975 samples; when these were excluded, kittiwake eggs displayed a significant decreasing trend from 1976 to 2013. Trends in the eggs of murres, fulmars, kittiwakes, and guillemots had negative slopes between 1993 and 2013. The pat-tern in glaucous gull eggs was different: decreasing by 50% from 1993 to 2003 before increasing again.
Braune et al. (2016) concluded that the general increasing trends in egg Hg during the 1970s and 1980s were consistent with atmos-pheric Hg increases over the Arctic during that period. They noted that the migratory habits of the five bird species, which overwinter in different southern regions away from Lancaster Sound, compli-cated interpretation of the reasons for the temporal trends. Environ-mental Hg changes in their wintering areas could have been different to those in the Arctic. Interpretation is also complicated by signifi-cant differences in the findings from glacier archives of atmospheric Hg on the western and eastern edges of the North American Arctic.
UNCORRECTED
PROOF
Fig. 6. Mercury trends in Arctic aquatic biota. A) Annual mean Hg concentrations (dry weight (dw); natural logarithm-transformed) adjusted for trophic position in eggs of thick-billed
murres, northern fulmars, and black-legged kittiwakes from Lancaster Sound, Nunavut, from the 1970s to the 2010s (Braune et al., 2016). Vertical lines show ± one standard error, and the trend lines represent second-order polynomial regressions for each of the species. B) Mercury concentrations (dry weight) in teeth of polar bears from Svalbard, aged from three to 10 years, from the 1960s to the 2000s (Aubail et al., 2012). The line represents the fitted non-linear trend. C) Mercury concentrations (wet weight) in muscle of burbot and lake trout collected from the West basin and east Arm of Great Slave Lake, Northwest Territories, Canada, from the 1980s to 2010s (Evans et al., 2013). Vertical lines show ± one standard error.
Greenland glacial snow/firn (Faïn et al., 2009) showed a monoto-nic decline in atmospheric GEM concentrations during the 1970s and 1980s, following peak concentrations in the 1950s to 1960s. Glacial snow and ice core reconstructions of atmospheric Hg deposition from Mt. Logan (Yukon) showed increases in deposition through the 1990s, which could be an indication of increasing trans-Pacific contamina-tion from Asia (Beal et al., 2015). Overall, these data, especially the declining GEM trend on Greenland through the 1970s and 1980s, are inconsistent with the conclusions of Braune et al. (2016). However, the flat or slightly declining egg Hg data from about 1990 onwards is consistent with the recent modelling of atmospheric GEM in the Arctic (see Fig. 1). Zheng (2015), on the other hand, reported that
20th-century total Hg accumulation in a Greenland ice core was relatively constant until increasing during the 1970s to 2000s, a pattern similar to those in most of the bird species but not in agreement with the (Zhang et al., 2016) modelling. Thus, uncertainty about the actual trends in Arctic atmospheric Hg deposition is a limiting factor in as-sessing agreement between environmental and biological Hg trends in this region.
In Great Slave Lake in the western Canadian Arctic, temporal trends of Hg in lake trout, burbot, and northern pike were monitored irregularly between the late 1980s or early 1990s and 2012 (Fig. 6C) (Evans et al., 2013). Muscle Hg data were adjusted for fish length, but not for trophic shifts over time. Mercury concentrations generally
UNCORRECTED
PROOF
increased over time in lake trout and burbot, but not in northern pike,with considerable interannual variation. These increasing or flat pat-terns are inconsistent with atmospheric GEM concentrations and wet deposition fluxes that were declining at the time (see Fig. 1) and with the Mt. Logan atmospheric deposition record of Beal et al. (2015). Sta-tistical analysis of climate factors suggested that varying annual mean air temperatures, and particularly cold season temperatures, were re-lated to the fish Hg patterns although a precise mechanism linking temperature to fish Hg could not be elucidated (Evans et al., 2013).
4. Causes of the divergence between aquatic biota and atmospheric Hg trends
There are marked differences between century-scale and recent decadal datasets in terms of how well atmospheric and biotic Hg trends track each other. The century-scale biotic Hg trends since about 1850 (from the Arctic; Dietz et al., 2009) generally matched the in-creasing atmospheric Hg deposition trends recorded in remote glacial ice cores and other natural archives (Beal et al., 2015; Kang et al., 2016; Zheng, 2015). Starting in the mid- to late-19th century, and shortly after major anthropogenic uses and global-scale emissions of Hg became more common (Outridge et al., 2018), Hg concentrations in the atmosphere and in aquatic biota increased steadily up to max-ima typically attained at about the 1970s–1980s (Dietz et al., 2009; Rigét et al., 2011). The longer-term biotic datasets from the Arctic thus clearly indicate the effects of anthropogenic contamination of aquatic systems over the century or more since about 1850.
However, as anthropogenic emissions to air began to stabilize after the 1980s, it became increasingly apparent that a divergence between the biotic and atmospheric Hg trends was developing in some areas, and in some co-occurring species. In other areas and species, however, the atmospheric and biotic trends continued synchronously. The diver-gent patterns between the atmospheric and biotic Hg trends have be-come more apparent over the past two decades, as atmospheric and bi-ological monitoring became more widespread and frequent.
Fundamentally, the divergence between the biotic and atmospheric mercury trends may be generally attributed to the large inventories of legacy Hg in soil and ocean reservoirs, and the exceptional sensitiv-ity of Hg biogeochemical cycling to changes in physical (e.g., tem-perature, light, hydrology), geochemical (e.g., pH, redox status, com-plexing ligands), biological (e.g., feeding behavior of an organism) and ecological (e.g., primary productivity, microbial processes, food web structure and dynamics) conditions (Table 1; see also Hsu-Kim et al., 2018). Many of the effects have been recently exacerbated by climate change. Some of the major processes that trigger changes in these conditions, and thus cause the decoupling between biotic and environmental Hg, include changes in the terrestrial environment and landscape, changes in the aquatic ecosystem, and climate change. 4.1. Changes in the terrestrial environment and landscape
Globally the terrestrial environment represents the largest inven-tory of Hg (~950 kt), with ~150 kt stored in surface organic soils (Outridge et al., 2018). Terrestrial biota are much less prone to Hg bioaccumulation as the conversion of inorganic Hg to MeHg is not fa-vored in the terrestrial environment (Fitzgerald and Lamborg, 2014). Also, on a global scale, anthropogenic inputs have altered the Hg inventory in the soils to a lesser degree than in the oceans due to the naturally large mass of Hg that is present in terrestrial systems (Outridge et al., 2018). However, major changes in landscape and
Table 1
Properties of mercury (Hg) and their implications for its biogeochemistry.
(Modified from Wang and Zhang, 2013).
Property Implications
Redox between Hg0and HgII Sensitive to changes in redox and pH
conditions; sensitive to photochemical and microbial processes
High vapor pressure of Hg0 Sensitive to changes in temperature; long-range
atmospheric transport; a global problem needing global solutions
Hg2+ions being one of the
softest Lewis acids
Strong affinity to ligands (e.g., reduced sulfides, halogens); sensitive to changes in organic carbon and redox conditions Methylation is primarily
microbial, with methylmercury being the most bioavailable and toxic
Sensitive to changes in temperature, organic carbon, nutrients, redox and microbial processes; direct source control of methylmercury difficult Methylmercury biomagnifies
in the food chain
Sensitive to changes in temperature, food web structure and dynamics
land-use in the watershed, such as urbanization, agricultural activities, flooding, damming, and deforestation, may affect the net release of soil Hg to downstream aquatic systems (inland and coastal). More im-portantly, they also change the organic carbon flux from watersheds and redox conditions that directly influence Hg methylation processes in adjacent aquatic systems. The importance of such changes is per-haps best demonstrated by reservoir construction in the watershed. As shown in Case Study 3, fish Hg concentrations in reservoirs are pri-marily controlled by the influx and dynamics of terrestrially-derived organic carbon and Hg, and bear almost no relationship with trends in atmospheric Hg concentrations or deposition, even decades after reservoir impoundment.
4.2. Changes in the aquatic ecosystem
As MeHg biomagnifies in the aquatic food web (i.e., MeHg con-centration increases from prey to predator), any changes in ecosys-tem structure, function, and dynamics may result in major changes in Hg concentrations within the ecosystem. Processes such as acidifica-tion/liming (Case Study 2) and eutrophication (see Case Study 3) af-fect MeHg production by altering Hg speciation and bioavailability, as well as Hg food-chain transfer and biotic Hg concentrations by al-tering species composition, biomass and growth rates (e.g., Clayden et al., 2013; Jardine et al., 2013). Aquaculture, overfishing, and inva-sion of non-native species can change not only the nutrient status of an aquatic ecosystem, but also the structure, function, and dynamics of food webs, and thus could result in major changes in biota Hg. 4.3. Climate change
On the global scale, climate change may be the most prevalent contributor to the divergence between biotic and environmental Hg trends. Changes in water temperature alone could affect mercury bioaccumulation in various ways. For instance, temperature increases could lead to changes in bioenergetics of primary consumers and fish that leads to higher ingestion but has less effect on elimination processes, resulting in an increase in biota Hg concentrations. The impact of climate change on biotic Hg is perhaps most profoundly felt in the Arctic, where rapid climate warming has resulted in dra-matic changes in many biogeochemical and ecological processes that drive Hg cycling (Chen et al., 2018; Stern et al., 2012; Wang et al., 2010). For instance, the rapid decline in the aerial coverage and thickness of Arctic sea ice and the replacement of multi-year sea ice by first-year sea ice have been shown to influence Hg distribution
UNCORRECTED
PROOF
and transport across the ocean–sea ice–atmosphere interface, as iceprevents elemental Hg evasion and leads to a buildup of Hg0under the
ice (Dimento et al., 2018; Andersson et al., 2008), and can alter Hg methylation and demethylation rates, promote changes in primary pro-ductivity, and shift food web structures (bottom-up processes) (Beattie et al., 2014; Chaulk et al., 2011; Heimbürger et al., 2015; Wang et al., 2017). Arctic tundra plants have been shown to actively take up GEM from the atmosphere, leading to unexpectedly high Hg accumu-lation in tundra soils (Obrist et al., 2017). A warming climate thus will not only affect the tundra accumulation of atmospheric Hg, but also the amount of Hg that can be delivered from the watershed to the Arctic freshwater and marine ecosystems via snow melt and riverine discharge. The very large mass of mainly natural Hg in northern per-mafrost deposits, which is projected to be steadily released with fur-ther climate warming (Schuster et al., 2018), may profoundly affect biotic Hg concentrations around the Northern Hemisphere especially as large amounts of organic carbon that may stimulate Hg methylation rates will be simultaneously released.
Changes in animal social behavior associated with changing sea-ice regimes can also affect dietary exposure to Hg (top-down processes) (Stern et al., 2012). As shown in Case Study 4, the trophic position of thick-billed murre from Coats Island in northern Hudson Bay has declined, presumably due to feeding increasingly on capelin instead of Arctic cod (Braune et al., 2014). However, the population's egg Hg concentrations did not change significantly between 1993 and 2013; to explain this stable trend, the availability of MeHg in the envi-ronment and efficiency of Hg food web transfer must have increased. It has also been suggested that climate warming may cause a shift in energy flow from benthic to pelagic food webs as aquatic productiv-ity increases in high Arctic lakes. Since zooplankton species such as Daphnia contain higher MeHg than benthic organisms, this shift could increase Hg transfer in the food web (Chetelat and Amyot, 2008). The impact of climate change on biotic Hg has also been observed in lower latitude regions (e.g., Pinkney et al., 2014).
5. Evolution of the relationship between atmospheric and biotic Hg concentrations
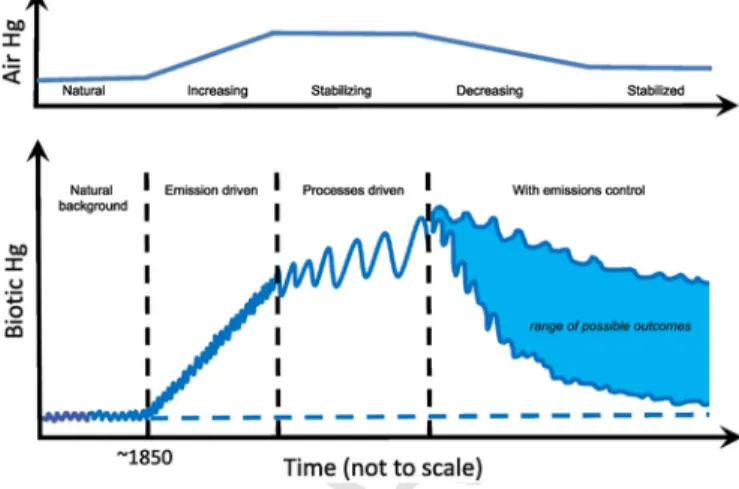
Wang et al. (2010) and Wang and Zhang (2013) proposed that the divergence between biotic and environmental Hg trends is an indica-tion that an aquatic ecosystem has entered a new‘paradigm’ in which the key controls on Hg bioaccumulation have switched from being ‘emissions-driven’ to ‘processes-driven’. This switch occurs because the biotic Hg concentrations in an aquatic ecosystem are influenced not only by Hg influx (natural or anthropogenic) to the system, but also by the internal processes in the ecosystem that control the recy-cling, speciation, bioavailability, methylation and biological uptake of Hg. As the accumulated mass of‘legacy’ Hg in a water body becomes large relative to the loading rate of newly emitted Hg, the internal bio-geochemical processes that control its permanent removal (e.g., bur-ial), re-emission, or uptake into the biota, increasingly become the de-termining steps in bioavailability and bioaccumulation.
The changing relationship over time between atmospheric Hg con-centrations (or deposition) and biotic Hg is shown in Fig. 7. Prior to anthropogenic influences (the exact timeline is subject to debate; Outridge et al., 2018), when Hg emissions were at their natural level, the flux of Hg to the aquatic system was generally low, and so were its biotic concentrations (Phase I– ‘Natural background’). At around the mid-19th century, however, as rapid industrialization resulted in a sharp increase in anthropogenic Hg emissions, aquatic biota Hg con-centrations responded rapidly due to increasing Hg deposition, expo-sure and uptake of Hg from a small but growing environmental Hg
Fig. 7. A schematic representation of evolution in the Hg concentrations in the air (top)
and aquatic biota (bottom), showing changes over time in the principal drivers of Hg bioaccumulation. The figure is updated from Wang et al. (2010). See the text for details. inventory (Phase II– ‘Emissions-driven’). This phase is clearly seen in long-term retrospective studies of Hg concentrations in Arctic biota (Dietz et al., 2009). Once an aquatic ecosystem has accumulated suf-ficient Hg, additional increases in Hg influx become secondary to the amount that has been accumulated in the system after decades to cen-turies of loading (i.e., legacy Hg). Bioaccumulation then draws pre-dominantly on this legacy Hg, which is operated on by the internal biogeochemical processes (Phase III– ‘Internal Processes-driven’). Throughout these three phases, biogeochemical processes (shown as sine-wave‘noise’ in Fig. 7) determine the transport and transforma-tion of Hg from the abiotic part of the ecosystem to biota. But it is in Phase III that these processes emerge to create a variability that is large enough to obscure the effect of the current external Hg inputs, and hence produce the divergence between biotic and atmospheric Hg trends (Wang et al., 2010).
In the period following the Minamata Convention, a new phase, Phase IV, can be envisioned (see Fig. 7) which is based on observa-tions of biotic Hg trends in the recent past, as discussed above, and model predictions of future seawater Hg concentration trends. As an-thropogenic Hg emissions decrease, atmospheric Hg concentrations will decrease and eventually stabilize at a new steady state. However, revolatilization of part of the large quantity of legacy anthropogenic Hg presently contained in the world's oceans and soils, and its recy-cling between oceans, soils and the atmosphere, means that atmos-pheric and seawater Hg concentrations are likely to decrease much more slowly than future changes in Hg emissions (Sunderland and Mason, 2007; Sunderland and Selin, 2013). While biotic Hg concen-trations are also projected to decrease over the long term, the current phase of‘processes-driven’ bioaccumulation dictates that it will take much longer to establish a new steady-state in biotic Hg.
The biotic Hg concentrations at the new steady-state are also likely to remain above the Holocene background levels for an extended pe-riod after atmospheric Hg levels have returned to natural levels, be-cause of the continued presence of legacy Hg in aquatic and terrestrial systems. In the shorter term, in fact, aquatic biotic Hg concentrations in many instances, especially in some of the larger, deeper marine ecosystems, are likely to continue to increase despite recent emission controls (Sunderland and Selin, 2013). Biota in smaller waterbodies, such as lakes and coastal marine systems with restricted water mass turnover, are more likely to respond relatively rapidly to emissions controls because of the smaller mass of legacy Hg contained there rel-ative to the decreased anthropogenic Hg loadings.
UNCORRECTED
PROOF
Examples of this long and‘uneven’ recovery in biotic Hg can befound following the impoundment of a river, or after‘de-acidification’ of a lake. As shown in Case Study 3, fish Hg in reservoirs decreased a few years after the impoundment, but remained above the pre-im-poundment concentrations even after more than a century (see Fig. 5). In the 1970s, lime was applied to many Swedish lakes that were acidified due to atmospheric acid deposition, to help restore the lake ecosystem. Following the liming, fish Hg in those lakes declined by 10–20% by the 1990s (Meili, 1995) and continued to decline to the present day (Åkerblom et al., 2014). Yet, more than 30 years after the liming, fish Hg concentrations in these lakes remained considerably higher (twice as high on average) than those in lakes that were not im-pacted by acidification (and not subject to liming) (Åkerblom et al., 2014).
6. Implications for evaluating the effectiveness of the Minamata Convention
Reports of biotic Hg trends not following the atmospheric Hg trends in recent decades should not be regarded as discouraging news when considering the efficacy of regulations to reduce atmospheric and other releases of Hg. The fact that effective Hg emission control is expected to be followed by long delays, in some cases, before an en-suing reduction is seen in food web Hg concentrations makes it all the more pressing to control and reduce Hg emissions as early as possible (Chen et al., 2018; Wang et al., 2010).
Nonetheless, policy-makers should be prepared for the fact that the reductions in biotic Hg concentrations and human Hg exposure via aquatic food-chains are likely to be uneven and predictable only in the most general way, both in terms of their timing and in the degree of re-duction. Different species within the same region, or the same species in different regions, can be expected to show quite different trajecto-ries of tissue Hg over time, because of the unpredictable consequences of coincidental environmental or ecological process changes. Clearly, based on the recent literature reviewed above, no single species can be expected to reliably reflect the impact of reductions in anthropogenic emissions. Therefore, biomonitoring efforts designed to evaluate the effectiveness of the Minamata Convention in reducing biotic Hg con-centrations should include multiple species occupying different eco-logical and geographical niches. In particular, piscivorous fish and small prey fish (e.g., young of the year perch) that are widely distrib-uted across ecosystems and continents should be monitored, as they could serve as a better proxy of change (Mason et al., 2005; Wiener et al., 2007). Continuation of existing biological Hg monitoring pro-grams should focus on supporting the longest and most statistically powerful datasets, because these will reflect any future changes in concentrations with greater confidence than short-term or high-vari-ance datasets (Bignert et al., 2004). The collection of essential ancil-lary biological and ecological data (such as body length or weight, and trophic position using stable nitrogen isotope ratios), which will help to interpret observed changes in tissue Hg, should also be mandatory.
Acknowledgement
This paper was prepared as a contribution to the United Nations Environment Programme's Global Mercury Assessment, and we thank all of our colleagues who participated in this process, particularly G. Futsaeter and E. Toda (UNEP), S. Wilson (AMAP) and J. Munthe (IVL Swedish Environmental Research Institute). The figures were re-drawn by S. Duckworth.
Funding sources
The work was financially supported by UNEP, and by support from the Canada Research Chairs program (F.W.) and the Geological Survey of Canada (P.M.O.). R.P.M.'s contribution was partially sup-ported by the National Science Foundation's Chemical Oceanography program (Grant 1634048). The authors declare that they have no com-peting interest.
References
Åkerblom, S., Bignert, A., Meili, M., Sonesten, L., Sundbom, M., 2014. Half a century of changing mercury levels in Swedish freshwater fish. Ambio 43 (Suppl. 1), 91–103.
AMAP, 2010. Updating Historical Global Inventories of Anthropogenic Mercury Emissions to Air. Technical Report No. 3. Arctic Monitoring and Assessment Pro-gramme (AMAP), Oslo, Norway.
AMAP/UNEP, 2013. Technical Background Report for the Global Mercury Assess-ment 2013. Arctic Monitoring and AssessAssess-ment Programme (AMAP), Oslo, Nor-way, and United Nations Environment Programme (UNEP), Geneva, Switzerland, 263.
AMAP/UNEP, 2019. Global Mercury Assessment - 2018. Arctic Monitoring and As-sessment Program (AMAP), Oslo, Norway, and United Nations Environment Pro-gramme (UNEP), Geneva, Switzerland, (in press).
Ariya, P.A., Amyot, M., Dastoor, A., Deeds, D., Feinberg, A., Kos, G., et al., 2015. Mercury physicochemical and biogeochemical transformation in the atmosphere and at atmospheric interfaces: a review and future directions. Chem. Rev. 115, 3760–3802.
Aubail, A., Dietz, R., Rigét, F., Sonne, C., Wiig, , Caurant, F., 2012. Temporal trend of mercury in polar bears (Ursus maritimus) from Svalbard using teeth as a biomoni-toring tissue. J. Environ. Monit. 14, 56–63.
Basu, N., Horvat, M., Evers, D.C., Zastenskaya, I., Weihe, P., Tempowski, J., 2018. A state-of-the-science review of mercury biomarkers in human populations world-wide between 2000 and 2018. Environ. Health Perspect. 126, https://doi.org/10. 1289/EHP3904.
Beal, S.A., Osterberg, E.C., Zdanowicz, C.M., Fisher, D.A., 2015. Ice core perspective on mercury pollution during the past 600 years. Environ. Sci. Technol. 49, 7641–7647.
Beattie, S.A., Armstrong, D., Chaulk, A., Comte, J., Gosselin, M., Wang, F., 2014. To-tal and methylated mercury in Arctic multiyear sea ice. Environ. Sci. Technol. 48, 5575–5582.
Bignert, A., Riget, F., Braune, B., Outridge, P., Wilson, S., 2004. Recent temporal trend monitoring of mercury in Arctic biota– how powerful are the exiting datasets. J. Environ. Monit. 6, 351–355.
Blukacz-Richards, E.A., Visha, A., Graham, M.L., McGoldrick, D.L., de Solla, S.R., Moore, D.J., et al., 2017. Mercury levels in herring gulls and fish: 42 years of spa-tio-temporal trends in the Great Lakes. Chemosphere 172, 476–487.
Bodaly, R.A., Jansen, W.A., Majewski, A.R., Fudge, R.J.P., Strange, N.E., Derksen, A.J., et al., 2007. Postimpoundment time course of increased mercury concentra-tions in fish in hydroelectric reservoirs of northern Manitoba, Canada. Arch. Envi-ron. Contam. Toxicol. 53, 379–389.
Braaten, H.F.V., Åkerblom, S., de Wit, H.A., Skotte, G., Rask, M., Vuorenmaa, J., et al., 2017. Spatial and Temporal Trends of Mercury in Freshwater Fish in Fennoscandia (1965–2015). Norwegian Institute for Water Research, Oslo, Nor-way, 70.
Braune, B.M., Gaston, A.J., Hobson, K.A., Gilchrist, H.G., Mallory, M.L., 2014. Changes in food web structure alter trends of mercury uptake at two seabird colonies in the Canadian Arctic. Environ. Sci. Technol. 48, 13246–13252. Braune, B.M., Gaston, A.J., Mallory, M.L., 2016. Temporal trends of mercury in eggs
of five sympatrically breeding seabird species in the Canadian Arctic. Environ. Pollut. 214, 124–131.
Brigham, M.E., Sandheinrich, M.B., Gay, D.A., Maki, R.P., Krabbenhoft, D.P., Wiener, J.G., 2014. Lacustrine responses to decreasing wet mercury deposition rates– results from a case study in Northern Minnesota. Environ. Sci. Technol. 48, 6115–6123.
Burgess, N.M., Bond, A.L., Hebert, C.E., Neugebauer, E., Champoux, L., 2013. Mer-cury trends in herring gull (Larus argentatus) eggs from Atlantic Canada, 1972–2008: temporal change or dietary shift?. Environ. Pollut. 172, 216–222. Chaulk, A., Stern, G.A., Armstrong, D., Barber, D., Wang, F., 2011. Mercury
distribu-tion and transport across the ocean-sea-ice-atmosphere interface in the Arctic Ocean. Environ. Sci. Technol. 45, 1866–1872.
Chen, C.Y., Driscoll, C.T., Eagles-Smith, C.A., Eckley, C.S., Gay, D.A., Hsu-Kim, H., et al., 2018. A critical time for mercury science to inform global policy. Environ. Sci. Technol. 52, 9556–9561.
UNCORRECTED
PROOF
Chetelat, J., Amyot, M., 2008. Elevated methylmercury in high Arctic Daphnia and therole of productivity in controlling their distribution. Glob. Chang. Biol. 14, 1–13. Clayden, M.G., Kidd, K.A., Wyn, B., Kirk, J.L., Muir, D.C.G., O'Driscoll, N.J., 2013.
Mercury biomagnification through food webs is affected by physical and chemical characteristics of lakes. Environ. Sci. Technol. 47, 12047–12063.
Cole, A.S., Steffen, A., Pfaffhuber, K.A., Berg, T., Pilote, M., Poissant, L., et al., 2013. Ten-year trends of atmospheric mercury in the high Arctic compared to Canadian sub-Arctic and mid-latitude sites. Atmos. Chem. Phys. 13, 1535–1545. Cole, A.S., Steffen, A., Eckley, C., Narayan, J., Pilote, M., Tordon, R., et al., 2014. A
survey of mercury in air and precipitation across Canada: patterns and trends. At-mosphere 5, 635–668.
Cross, F.A., Evans, D.W., Barber, R.T., 2015. Decadal declines of mercury in adult bluefish (1972−2011) from the Mid-Atlantic Coast of the U.S.A. Environ. Sci. Technol. 49, 9064–9072.
Dietz, R., Riget, F., Boertmann, D., Sonne, C., Olsen, M.T., Fjeldsa, J., et al., 2006. Time trends of mercury in feathers of West Greenland birds of prey during 1851 -2003. Environ. Sci. Technol. 40, 5911–5916.
Dietz, R., Outridge, P.M., Hobson, K.A., 2009. Anthropogenic contributions to mer-cury levels in present-day Arctic animals - a review. Sci. Total Environ. 407, 6120–6131.
Drevnick, P.E., Cooke, C.A., Barraza, D., Blais, J.M., Coale, K.H., Cumming, B.F., et al., 2016. Spatiotemporal patterns of mercury accumulation in lake sediments of western North America. Sci. Total Environ. 568, 1157–1170.
Eagles-Smith, C.A., Ackerman, J.T., Willacker, J.J., Tate, M.T., Lutz, M.A., Fleck, J.A., et al., 2016. Spatial and temporal patterns of mercury concentrations in fresh-water fish across the Western United States and Canada. Sci. Total Environ. 568, 1171–1184.
Eagles-Smith, C.A., Silbergeld, E.A., Basu, N., Bustamante, P., Diaz-Barriga, F., Hop-kins, W.A., et al., 2018. Modulators of mercury risk to wildlife and humans in the context of rapid global change. Ambio 47, 170–197.
Evans, M., Muir, D., Brua, R.B., Keating, J., Wang, X., 2013. Mercury trends in preda-tory fish in Great Slave Lake: the influence of temperature and other climate dri-vers. Environ. Sci. Technol. 47, 12793–12801.
Faïn, X., Ferrari, C.P., Dommergue, A., Albert, M.R., Battle, M., Severinghaus, J., et al., 2009. Polar firn air reveals large-scale impact of anthropogenic mercury emis-sions during the 1970s. Proc. Natl. Acad. Sci. U. S. A. 106, 16114–16119. Feng, X.B., Jiang, H.M., Qiu, G.L., Yan, H.Y., Li, G.H., Li, Z.G., 2009. Geochemical
processes of mercury in Wujiangdu and Dongfeng reservoirs, Guizhou, China. En-viron. Pollut. 157, 2970–2984.
Feng, X.B., Meng, B., Yan, H.Y., Fu, X.W., Yao, H., Shang, L.H., 2018. Biogeochem-ical Cycling of Mercury in Reservoir Systems in Wujiang River Basin. Science Press and Springer, Southwest China Beijing.
Fitzgerald, W.F., Lamborg, C.H., 2014. Geochemistry of mercury in the environment. In: Treatise on Geochemistry, 2nd ed. Elsevier.
Fu, X.W., Feng, X.B., 2015. Variations of atmospheric total gaseous mercury concen-trations for the sampling campaigns of 2001/2002 and 2009/2010 and implications of changes in regional emissions of atmospheric mercury. Bull. Mineral. Petrol. Geochem. 34, 242–249.
Fu, X.W., Zhang, H., Yu, B., Wang, X., Lin, C.J., Feng, X.B., 2015. Observations of atmospheric mercury in China: a critical review. Atmos. Chem. Phys. 15, 9455–9476.
Fu, X.W., Zhu, W., Zhang, H., Sommar, J., Yu, B., Yang, X., et al., 2016. Depletion of atmospheric gaseous elemental mercury by plant uptake at Mt. Changbai, North-east China. Atmos. Chem. Phys. 16, 12861–12873.
Gaden, A., Ferguson, S.H., Harwood, L., Melling, H., Stern, G.A., 2009. Mercury trends in ringed seals (Phoca hispida) from the western Canadian Arctic since 1973: associations with length of ice-free season. Environ. Sci. Technol. 43, 3646–3651.
Gandhi, N., Tang, R.W.K., Bhavsar, S.P., Arhonditsis, G.B., 2014. Fish mercury levels appear to be increasing lately: a report from 40 years of monitoring in the Province of Ontario, Canada. Environ. Sci. Technol. 48, 5404–5414.
Gustin, M.S., Evers, D.C., Bank, M.S., Hammerschmidt, C.R., Pierce, A., Basu, N., et al., 2016. Importance of integration and implementation of emerging and future mercury research into the Minamata Convention. Environ. Sci. Technol. 50, 2767−2770.
Hall, B.D., St. Louis, V.L., Rolfhus, K.R., Bodaly, R.A., B, K.G., Paterson, M.J., 2005. The impact of reservoir creation on the biogeochemical cycling of methyl and total mercury in boreal upland forests. Ecosystems 8, 248–266.
Heimbürger, L.-E., Sonke, J.E., Cossa, D., Point, D., Lagane, C., Laffont, L., et al., 2015. Shallow methylmercury production in the marginal sea ice zone of the cen-tral Arctic Ocean. Sci. Rep. 5, https://doi.org/10.1038/srep10318.
Horowitz, H.M., Jacob, D.J., Zhang, Y., Dibble, T.S., Slemr, F., Amos, H.M., et al., 2017. A new mechanism for atmospheric mercury redox chemistry: implications for the global mercury budget. Atmos. Chem. Phys. 17, 6353–6371.
Hsu-Kim, H., Eckley, C.S., Achá, D., Feng, X., Gilmour, C.C., Jonsson, S., et al., 2018. Challenges and opportunities for managing aquatic mercury pollution in al-tered landscapes. Ambio 47, 141–169.
Hutcheson, M.S., Smith, C.M., Rose, J., Batdorf, C., Pancorbo, O., West, C.R., et al., 2014. Temporal and spatial trends in freshwater fish tissue mercury concentrations associated with mercury emissions reductions. Environ. Sci. Technol. 48, 2193–2202.
Jardine, T.D., Kidd, K.A., O'Driscoll, N., 2013. Food web analysis reveals effects of pH on mercury bioaccumulation at multiple trophic levels in streams. Aquat. Toxi-col. 132–133, 46–52.
Kang, S., Huang, J., Wang, F., Zhang, Q., Zhang, Y., Li, C., et al., 2016. Atmospheric mercury depositional chronology reconstructed from lake sediment and ice cores in the Himalayas and Tibetan Plateau. Environ. Sci. Technol. 50, 2859–2869. Lepak, R.F., Yin, R., Krabbenhoft, D.P., Ogorek, J.M., DeWild, J.F., Holsen, T.M., et
al., 2015. Use of stable isotope signatures to determine mercury sources in the Great Lakes. Environ. Sci. Technol. Lett. 2, 335–341.
Loseto, L.L., Stern, G.A., Macdonald, R.W., 2015. Distant drivers or local signals: where do mercury trends in western Arctic belugas originate?. Sci. Total Environ. 509, 226-223.
Lucotte, M., Schetagne, R., Therien, N., Langlois, C., Tremblay, A., 1999. Mercury in the Biogeochemical Cycle: Natural Environments and Hydroelectric Reservoirs of Northern Québec (Canada). Springer, Berlin.
Mason, R.P., Sullivan, K.A., 1997. Mercury in Lake Michigan. Environ. Sci. Technol. 31, 942–947.
Mason, R.P., Abbott, M.L., Bodaly, R.A., Bullock Jr., O.R., Driscoll, C.T., Evers, D., et al., 2005. Monitoring the response to changing mercury deposition. Environ. Sci. Technol. 39, 14A–22A.
McKinney, M.A., Atwood, T.C., Pedro, S., Peacock, E., 2017. Ecological change dri-ves a decline in mercury concentrations in Southern Beaufort Sea polar bears. Env-iron. Sci. Technol. 51, 7814–7822.
Meili, M., 1995. Liming effects on mercury concentrations in fish. In: Henrikson, L., Brodin, Y.W. (Eds.), Liming of Acidified Surface Waters—A Swedish Synthesis. Springer, Berlin, pp. 383–398.
Meng, B., Feng, X.B., Chen, C.X., Qiu, G.L., Sommar, J., Guo, Y.N., et al., 2010. In-fluence of eutrophication on the distribution of total mercury and methylmercury in hydroelectric reservoirs. J. Environ. Qual. 39, 1624–1635.
Meng, B., Feng, X.B., Qiu, G.L., Li, Z.G., Yao, H., Shang, L.H., et al., 2016. The im-pacts of organic matter on the distribution and methylation of mercury in a hydro-electric reservoir in Wujiang River, Southwest China. Environ. Toxicol. Chem. 35, 191–199.
Obrist, D., Agnan, Y., Jiskra, M., Olson, C.L., Colegrove, D.P., Hueber, J., et al., 2017. Tundra uptake of atmospheric elemental mercury drives Arctic mercury pollution. Nature 547, 201–204.
Obrist, D., Kirk, J.L., Zhang, L., Sunderland, E.M., Jiskra, M., Selin, N.E., 2018. A re-view of global environmental mercury processes in response to human and natural perturbations: changes of emissions, climate, and land use. Ambio 47, 116–140. Outridge, P., Mason, R., Wang, F., Guerrero, S., Heimburger-Boavida, L.-E., 2018.
Updated global and oceanic mercury budgets for the United Nations Global Mer-cury Assessment 2018. Environ. Sci. Technol. 52, 11466–11477.
Pinkney, A.E., Driscoll, C.T., Evers, D.C., Hooper, M.J., Horan, J., Jones, J.W., et al., 2014. Interactive effects of climate change with nutrients, mercury, and ereshwater acidification on key taxa in the North Atlantic Landscape Conservation Coopera-tive Region. Integr. Environ. Assess. Manag. 11, 355–369.
Prestbo, E.M., Gay, D.A., 2009. Wet deposition of mercury in the US and Canada, 1996-2005: results and analysis of the NADP mercury deposition network (MDN). Atmos. Environ. 43, 4223–4233.
Rigét, F., Braune, B., Bignert, A., Wilson, S., Aars, J., Born, E., et al., 2011. Temporal trends of Hg in Arctic biota, an update. Sci. Total Environ. 409, 3520–3526. Rigét, F., Dietz, R., Hobson, K.A., 2012. Temporal trends of mercury in Greenland
ringed seal populations in a warming climate. J. Environ. Monit. 14, 3249–3256. Risch, M., Kenski, D., 2018. Spatial patterns and temporal changes in
atmos-pheric-mercury deposition for the Midwestern USA, 2001–2016. Atmosphere 9, 29. https://doi.org/10.3390/atmos9010029.
Saiz-Lopez, A., Sitkiewicz, S., Roca-Sanjuan, D., Oliva-Enrich, J., Davalos, J., No-tario, R., et al., 2018. Photoreduction of gaseous oxidized mercury changes global atmospheric mercury speciation, transport and deposition. Nat. Commun. 9, 4796https://doi.org/10.1038/s41467-018-07075-3.
Sanei, H., Outridge, P.M., Goodarzi, F., Wang, F., Armstrong, D., Warren, K., et al., 2010. Wet deposition mercury fluxes in the Canadian sub-Arctic and southern Al-berta, measured using an automated precipitation collector adapted to cold regions. Atmos. Environ. 44, 1672–1681.
Schroeder, W.H., Anlauf, K.G., Barrie, L.A., Lu, J.Y., Steffen, A., Schneeberger, D.R., et al., 1998. Arctic springtime depletion of mercury. Nature 394, 331–332. Schuster, P.F., Schaefer, K.M., Aiken, G.R., Antweier, R.C., Dewild, J.F., Gryziec,
J.D., et al., 2018. Permafrost stores a globally significant amount of mercury. Geo-phys. Res. Lett. 45, https://doi.org/10.1002/2017GL075571.
Slemr, F., Brunke, E.G., Ebinghaus, R., Kuss, J., 2011. Worldwide trend of atmos-pheric mercury since 1995. Atmos. Chem. Phys. 11, 4779–4787.