Publisher’s version / Version de l'éditeur:
Vous avez des questions? Nous pouvons vous aider. Pour communiquer directement avec un auteur, consultez la
première page de la revue dans laquelle son article a été publié afin de trouver ses coordonnées. Si vous n’arrivez pas à les repérer, communiquez avec nous à [email protected].
Questions? Contact the NRC Publications Archive team at
[email protected]. If you wish to email the authors directly, please see the first page of the publication for their contact information.
https://publications-cnrc.canada.ca/fra/droits
L’accès à ce site Web et l’utilisation de son contenu sont assujettis aux conditions présentées dans le site LISEZ CES CONDITIONS ATTENTIVEMENT AVANT D’UTILISER CE SITE WEB.
Eleventh International Conference on Thermal Performance of the Exterior Envelopes of Whole Buildings XI: 05 December 2010, Clearwater, (FL), USA [Proceedings], pp. 1-19, 2010-12-05
READ THESE TERMS AND CONDITIONS CAREFULLY BEFORE USING THIS WEBSITE. https://nrc-publications.canada.ca/eng/copyright
NRC Publications Archive Record / Notice des Archives des publications du CNRC :
https://nrc-publications.canada.ca/eng/view/object/?id=9791797c-8d82-4681-9dfd-c4bc13420ee2 https://publications-cnrc.canada.ca/fra/voir/objet/?id=9791797c-8d82-4681-9dfd-c4bc13420ee2
NRC Publications Archive
Archives des publications du CNRC
This publication could be one of several versions: author’s original, accepted manuscript or the publisher’s version. / La version de cette publication peut être l’une des suivantes : la version prépublication de l’auteur, la version acceptée du manuscrit ou la version de l’éditeur.
Access and use of this website and the material on it are subject to the Terms and Conditions set forth at
3D thermal model for predicting the thermal resistance of spray polyurethane foam wall assemblies
HU
http://www.nrc-cnrc.gc.ca/ircU
3 D t he rm a l m ode l for pre dic t ing t he t he rm a l re sist a nc e of spra y polyure t ha ne foa m w a ll a sse m blie s
N R C C - 5 3 5 8 2
S a b e r , H . H . ; M a r e f , W . ; E l m a h d y , A . H . ; S w i n t o n , M . C . ; G l a z e r , R .
D e c e m b e r 2 0 1 0
A version of this document is published in / Une version de ce document se trouve dans:
Eleventh International Conference on Thermal Performance of the Exterior Envelopes of Whole Buildings XI, Clearwater, (FL), USA, December 5-9, 2010, pp. 1-19
The material in this document is covered by the provisions of the Copyright Act, by Canadian laws, policies, regulations and international agreements. Such provisions serve to identify the information source and, in specific instances, to prohibit reproduction of materials without written permission. For more information visit http://laws.justice.gc.ca/en/showtdm/cs/C-42
Les renseignements dans ce document sont protégés par la Loi sur le droit d'auteur, par les lois, les politiques et les règlements du Canada et des accords internationaux. Ces dispositions permettent d'identifier la source de l'information et, dans certains cas, d'interdire la copie de documents sans permission écrite. Pour obtenir de plus amples renseignements : http://lois.justice.gc.ca/fr/showtdm/cs/C-42
3D Thermal Model for Predicting
the Thermal Resistances of Spray
Polyurethane Foam Wall Assemblies
Hamed H. Saber,
Wahid Maref, Hakim Elmahdy, Michael C.
Swinton and Rock Glazer
National Research Council Canada, Institute for Research in Construction, Bldg. M-24, 1200 Montreal Road, Ottawa, Ontario, Canada K1A 0R6
http://irc.nrc-cnrc.gc.ca/irccontents.html
ABSTRACT
A Wall Energy Rating (WER) system has been proposed to account for simultaneous thermal conduction and air leakage heat losses through a full-scale wall system. Determining the overall WER requires that two standard tests be performed on a full-scale wall specimen: a thermal resistance test and an air leakage test. A 3D model representation of the wall specimen is developed to combine the results of these tests to obtain an accurate prediction of the wall thermal resistance (apparent R-value) under the influence of air leakage. Two types of wall configurations were simulated. The first one was a standard 2” by 6” wood stud frame construction, made of spruce, spaced at 16” (406 mm) o/c in 2.4 m x 2.4 m full-scale wall specimens. The second type of wall configuration was similar to the first one except that it included through-wall penetrations (a window opening, a pipe, an electric box and a duct), according to the Canadian Construction Material Centre (CCMC) Air Barrier Guide 07272 (1996). The cavities of the two types of wall configurations were filled with different types of insulations (i.e. Open Cell Spray Polyurethane foams). Results showed that the present model predicted the R-values of all walls to within +5%. After gaining confidence in the model predictions, it was used to determine the apparent R-values for these walls at different air leakage rates.
INTRODUCTION
Using Polyurethane Spray Foam (SPF) as insulation in buildings provides durable and efficient thermal barriers. The industry is promoting the SPF as an effective air barrier system in addition to its thermal insulation characteristics. In an effort to address these issues, a consortium of SPF manufacturers and contractors, jointly with the National Research Council of Canada’s Institute for
Research in Construction (NRC-IRC) conducted an extensive research project, called Wall Energy Rating (WER), to assess the thermal and air leakage characteristics of SPF walls. A few years ago, North American SPF industry joined forces to develop a replacement of the commonly used chlorofluorocarbon blowing agent. The introduction of the second generation of blowing agents, namely hydro-chlorofluorocarbon (HCFC) was seen as a positive step in the processing of SPF. A research was conducted jointly between the SPF industry and NRC-IRC on other blowing agents and their performance was assessed and reported (Bomberg and Kumaran, 1989, and Kumaran and Bomberg, 1990). In recent years, the focus of building code and regulatory officials, professionals and researchers has shifted towards the performance of the entire wall system. The current emphasis is on the contribution of SPF and other types of insulations to the control of heat, moisture and air through wall systems.
In the WER project, a number of walls with different types of insulations were built and tested. Material characterizations were also conducted to measure the thermal properties of a number of SPF. The material characterization of the light density open cell SPF (6.8 to 12 kg/m3) and medium density closed cell SPF (34.9 to 46.3 kg/m3) was performed according to ASTM C 518 standard (2004). The test specimen was prepared according to the procedure outlined in ULC standard (ULC S705.1-01, 2005). Additionally, the thermal resistances (R-values) of these walls were measured using the NRC-IRC’ Guarded Hot Box (GHB) at two temperature differences across the walls (40 K and 55 K) and no air leakage. In order to investigate the effect of the air leakage on the R-values, however, air leakage tests were conducted for these walls at a wide range of pressure differences across the walls. The test procedure to determine the R-value for different walls is a well-established procedure developed at NRC-IRC and formed the basis for the ASTM GHB test standard and practice (ASTM C 1199, 1998 and ASTM E 1423, 1998). The air leakage test method used is in accordance with ASTM E 283 (ASTM 1997). All wall samples were conditioned according to the procedure detailed in the CCMC Air Barrier Guide 07272 (1996).
The ultimate objective of the WER project is to develop a WER procedure that can be used as a simple tool for building designers and construction professionals. Both the accuracy and applicability of the developed WER procedure was enhanced by choosing a wide the range of different variables that can affect the wall thermal performance. As a result, some walls were constructed with penetration and other without penetration. Additionally, some walls were intentionally not sealed to represent leaky walls in order to cover a wide range of air leakage rate at different pressure difference across the walls. A brief outline of the WER project objectives and a limited set of results of two walls were presented in an earlier paper (Elmahdy et al., 2009-a). In a second paper (Maref et al., 2009), the test results of six walls were presented, where two of these walls were intentionally constructed with some deficiencies to represent leaky walls for the purpose of development the WER procedure. These two walls (WER-1 and WER-5) were insulated with glass fibre. The air barrier featured poly that was lapped at a joint and penetrations were not sealed. Note that these two walls do not meet all the air barrier requirements of Canadian National Building Code (NBC) 2005. The other four walls were insulated with medium
density closed cell SPF (34.9 to 46.3 kg/m3). The purpose of this study was not to compare the performance of the insulation products but the performance of airtight system versus leaky system regardless of the type of insulations. In a third paper (Elmahdy et al., 2009-b), more details about the testing program for another six walls was presented, in addition to a brief description of the analytical approach used to determine the Wall Energy Rating (WER) of insulated wall assemblies. Four of the six walls were insulated using open cell SPF with light densities (6.8 to 12 kg/m3) and the remaining two walls were WER-1 and WER-5 (reference walls). Those two walls do not meet all air barrier requirements of NBC 2005.
The objective of the work reported in this paper is to conduct 3D numerical simulations for walls with and without penetration to determine the R-values with and without air leakage. These simulations are conducted using the 3D hygrothermal model, called hygIRC-C, that was recently developed at NRC-IRC. The 3D model was extensively benchmarked in a number of clients and strategic projects. This model solves simultaneously the highly nonlinear Heat, Air and Moisture (HAM) equations. In this work, no moisture transport is considered. The predictions of the R-values using this model for different types of walls are compared with the measured R-values in the GHB at zero air leakage. After gaining confidence in predicting the R-values at no air leakage, a parametric study is conducted to predict the apparent R-values at different leakage rates that were measured for each wall. The work in this project is progressing and the plan is to test and conduct 3D simulations for additional walls so as to develop and refine the WER procedure, which will be used as a simple tool for building designers and construction professionals. The WER procedure could also be used to comply with current or future energy code requirements.
NEED FOR 3D HEAT AND AIR TRANSPORT MODEL
The heat flow through a wall assembly involves a multi-dimensional heat exchange within the wall. The multi-dimensional effect on the heat transfer becomes significant in a wall subjected to a large temperature difference (e.g. 40 - 55 K). This is due to the effect of thermal bridges that are created by the wood frame. In the case of a wall with penetration, however, the wood frame around the penetration adds more thermal bridges. Air leakage through the wall assembly is expected when pressure difference exists across the wall. The rate of airflow through a wall due to air leakage depends on the wall tightness, the air permeability of the different wall components, and the pressure difference across the wall. This airflow adds another heat transfer mechanism, which is basically due to convection.
The air leakage paths through the wall assembly are quite complicated. In the air leakage test for a wall specimen, the wall perimeter was sealed (Elmahdy et al., 2009-a, and 2009-b, Maref et al., 2009). Air enters the wall assembly at low temperature (e.g. -20oC or -35oC) through a 3 mm gap between the two Oriented Strand Board (OSB) sheathing boards. This 3 mm gap is required according to the CCMC Air Barrier Guide 07272 (1996). After the air finds its way through the wall, it exits mainly through the electrical outlet box. Because of the different shapes and locations of the 3 mm gap between the two OSB boards and the electrical outlet box, the air can move through the wall in all directions (3D
movement).
While air is moving through the wall, it carries an amount of heat that depends not only on the amount of leakage rate but also on the temperature difference across the wall. The air paths/movements within the wall assembly could be through the thermal insulation, construction tolerances and cracks. The construction tolerances results in air gaps between all solid-solid interfaces of the different wall components (e.g. studs - OSBs interface, etc.). Note that the amount of heat carried by the air depends on its local velocity. For example, a high local air velocity would result in a large effect in the local temperature distribution within the wall. In order to accurately predict both the temperature and heat flux distributions, and hence determine the wall thermal resistance, an accurate prediction for the velocity field in the wall is needed. However, to capture the multi-dimensional effects on the heat transfer and airflow through different wall assemblies (with and without penetration) there is a need to develop a 3D thermal model.
GOVERNING EQUATIONS
Recently, a hygrothermal model (2D and 3D) that uses COMSOL Multiphysics as a solver was developed at NRC-IRC. This model solves simultaneously the highly nonlinear 2D and 3D Heat, Air and Moisture (HAM) equations. These equations were discertized using the Finite Element Method (FEM). Using the FEM is important to capture complicated wall geometries with less discertizing error. Currently, this model which was benchmarked against hygIRC-2D and experimental data, is being used in a number of client and strategic projects to assess the hygrothermal performance of different wall systems subjected to different north American climates. The results of this effort will be the subject of future publications. As stated earlier, the governing equations needed to assess only the thermal performance (no moisture transport) of different wall systems are presented.
The mass balance and momentum equations for airflow through porous medium are given as (Bird et al., 1960):
P g
k v v t f f f f f f f : law s Darcy' , : balance Mass , (1)where P is the air pressure, g is vector of acceleration due to gravity, vf
is velocity vector of the air,
f
is air density, is material porosity, k is air permeability, and f f is air dynamic viscosity. In the
airspace (e.g. the 3 mm air gap between the OSB layers, electrical outlet box, see Figure 3), the mass balance equation and momentum equation (compressible Navier-Stokes equation) are respectively given as (Bird et al., 1960):
, 3 2 ) ( and , g I v v v P v v t v v t f f f T f f f f f f f f f f f (2)The energy equations for fluid phase and solid phase in porous media is obtained from the local volume averaging in terms of fluid and solid temperatures. An averaging volume should be sized small enough in order to not filter the global flow structure but it should be large enough so as to guarantee containing both fluid and solid phases everywhere in the structure at all times. Such volume is called a Representative Elementary Volume (REV). In many practical applications, the temperature difference between the solid and fluid phases inside an REV is much smaller than the global scale temperature variation (Vafai and Tien, 1981, Pakdee and Rattanadecho, 2006). This condition is met if the REV is much smaller compared to global length scale (Sozer and Shyy, 2008). Under this condition, the temperatures of the fluid and solid phases could be assumed equal to the local thermodynamic equilibrium temperature, T. Based on this assumption, the fluid mass balance equation (Eq. 1) and the energy equation for the fluid phase and the energy equation of the solid phase can be combined to one energy equation as:
) / ( and , ) 1 ( with k source/sin o f f s eff s f eff eff f f f eff o Cp Cp Cp q T T v Cp t T Cp , (3)where Cp and f Cp are the specific heat of the fluid and solid, respectively, and s f and s are the thermal conductivity of the fluid, and solid, respectively.
The parameters o,eff,andCpeff in Eq. (3) are the matrix density, apparent thermal conductivity
and apparent specific heat, respectively, for a porous material. These parameters are measurable and obtained from the material characterization. In the case of airspace, however, the energy equation is also given by Eq. (3) where 1. In this case, eff f and oCpeff fCpf. Since the objective of
this work is to determine the apparent R-value of different wall specimens, which should be determined at steady-state condition (i.e. Cpeff has no effect on R-value), only the thermal conductivities of
different materials were measured according to ASTM C 518 standard (2004), and listed in Elmahdy et al. (2009-b).
In Eq. (3), the term q source/sin k represents the heat source/sink (e.g. due to condensation/evaporation),
which is neglected since no moisture transport was considered in this work. Also, the first term on the right side accounts for heat transport by conduction, while the second term on the left side accounts for heat transport by convection. To predict the wall thermal resistance (R-value), Eq. (1) (porous media), Eq. (2) (airspace) and Eq. (3) are solved simultaneously in the steady state condition. In order to test the present model, a number of benchmarking were carried out by comparing its predictions against: (a) the hygIRC-2D model that was previously developed and benchmarked at NRC-IRC, and (b) experimental data as shown next.
BENCHMARK PRESENT MODEL
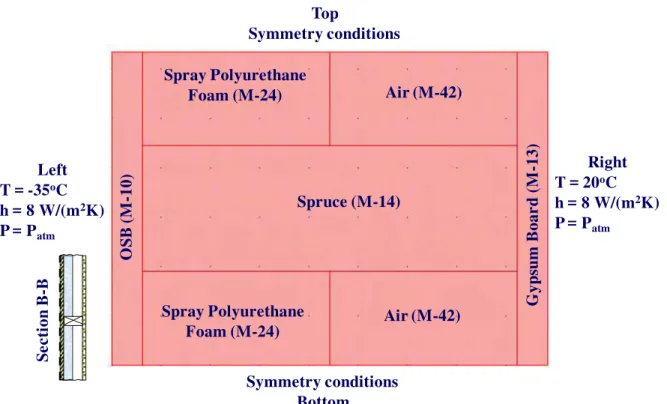
Since the present model has 2D and 3D capabilities, its 2D capability was activated to compare its predictions against the hygIRC-2D model, previously developed at NRC-IRC (Maref et al., 2002-a and 2002-b). Figure 1 shows a test case for a horizontal cut through a wall specimen and the different material layers. Note that symbol “M-xx” in this figure specifies the material ID number in the NRC-IRC database of the material properties. Also, this figure shows the boundary conditions that have been used in this test case. Figure 2 shows the temperature contours in this horizontal cut obtained using hygIRC-2D and the present 2D model. As shown in this figure, both models predict the same temperature distribution. Furthermore, as shown in Table 1, the calculated heat fluxes (on the top, bottom, left and right sides) and the R-value using hygIRC-2D and present 2D model are identical. Other test cases using the 2D capability of the present model were carried out, and the obtained results were compared against hygIRC-2D. The results showed that the predictions of both models are in good agreement. Another step for benchmarking the present 3D model was taken by comparing its predictions for the R-values against the measured ones in the Guarded Hot Box (GHB) for six wall specimens that are described next.
Table 1. Comparison of the calculated heat fluxes and R-value using hygIRC-2D and present 2D model for the test case shown in Figure 1
Parameter hygIRC-2D
Present 2D model
Average heat flux at Left side (W/m2) 20.08 20.09 Average heat flux at right side (W/m2) 20.08 20.09 Average heat flux at top side (W/m2) 0.00 0.00 Average heat flux at bottom side (W/m2) 0.00 0.00
R-value (m2K/W) 2.49 2.49
Description of Wall Specimens
Six wall specimens were constructed according to common practices in the Canadian construction industry. All walls were built according to the CCMC Air Barrier Guide 07272 (1996). Figure 3 through Figure 6 show a wall specimen with penetration illustrating the construction details. The six walls were built using the conventional 2” by 6” wood stud frame construction. The thermal insulation fills the entire stud cavity. Two reference walls were lapped poly, no sealing of penetrations and the insulation not contributing to the air barrier (WER-1 and WER-5) and the other four walls (WER-AA, WER-BB, WER-CC and WER-DD) were insulated with two light densities, open cell SPF insulations (6.8-12 kg/m3). Three walls were opaque (WER-1, WER-AA, and WER-CC) and the other three included penetrations (WER-5, WER-BB and WE-DD) to simulate a window (see Figure 6 for the details of the window). Thermal test and air leakage test were conducted for these walls and the results
of these tests are available in Elmahdy et al. (2009-b).
WER-1 and WER-5 were built to field installation practices to illustrate the Wall Energy Rating with poor airtightness, including the following detailing choices:
o Part 9 of the National Building Code of Canada (NBC) 2005 requires one of two options be followed for air barrier continuity between 2 sheets of poly for the air barrier: 1. Sealing the joint
2. Lapping the joint by not less than 100 mm and clamping between framing members and rigid panels
We chose the second option, with the understanding that it is likely less effective in controlling air leakage.
o NBC 2005 also requires sealing of windows, piping, ducting and electrical boxes to maintain the integrity of the air barrier.
We purposely did none of these.
So WER-1 and WER-5 do not meet all of the air barrier requirements of NBC 2005.
3D Simulations Using the Present 3D Model
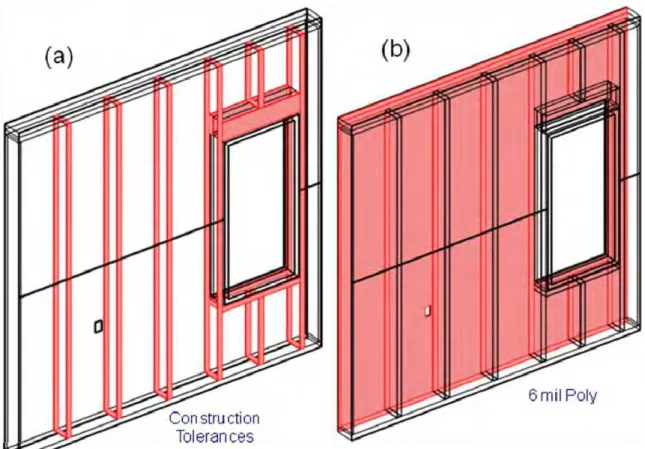
This section presents the steps of conducting numerical simulation using the present 3D thermal model for different walls with and without penetration. In all wall specimens, it was assumed that the thermal insulations were uniformly distributed in the stud cavity. In the case of open cell SPF, small air voids may exist in the foams. Because the thermal conductivity of the air (~0.025 W/(m.K)) is comparable with the values of the thermal conductivities of these foams (Elmahdy et al., 2009-b), the small air voids in the foams would have insignificant effect on the overall R-values. In all walls, a 6 mil poly was installed between the thermal insulation and the Gypsum board (Figure 5b). The wood studs were constructed using 38 mm by 138 mm of economy grade spf lumber. The studs were spaced at 406 mm (16”) on center with a double top plates and single bottom plate (Figure 4b). A 19 mm stud was used for each end of the wall. In view of the fact that the studs thermal conductivity is about ~2.3 - 5.1 times the thermal conductivities of the different types of thermal insulations (Elmahdy et al., 2009-b), these studs act as thermal bridges. As explained earlier in the case of wall specimens with penetration, however, more thermal bridges exist as a result of the window wood frame (Figure 4b and Figure 6). Therefore, it is expected that the wall with penetration would result in a lower R-values than without penetration.
For a given pressure difference across the wall assembly, the air enters the wall specimen through a 3 mm gap between the two OSB sheathing boards and exits through the electrical outlet box (see Figure 3). Because the shapes and the locations of the 3 mm air gap and the electrical outlet box are quite different, the air moves through the wall specimen in all directions. In the numerical simulation, a 1 mm construction tolerance was considered in all wall specimens. As shown in Figure 5a, the construction tolerances exist at all solid - solid interfaces, which include studs - OSBs interface, studs - top plate interface, studs - bottom plate interface, and studs - gypsum boards interface. In the case of wall specimen with penetration, the window wood frame adds more construction tolerances than wall specimen without penetration. As such, for the same pressure difference across the wall, the measured
air leakage rate in wall with penetration was higher than that for wall without penetration (for more details, see Elmahdy et al., 2009-b). Consequently, it is expected that the R-value of a wall specimen with penetration would be lower than that for wall without penetration due to more thermal bridges and higher leakage rate in the former than in the latter.
In all numerical simulations, it was assumed that the perimeters of wall specimens are adiabatic and sealed (i.e. no heat losses and air leakage across the wall perimeters). This means that the measured amount of the air leakage at a given pressure difference across the wall flows entirely through the wall specimen. The air temperatures on the weather side and room side were taken equal to -20oC and +20oC, respectively, with a film heat transfer coefficient of 8 W/(m2K). As shown
in Figure 3 through Figure 6, the 3D capability of the present model made it possible to model the 6 wall specimens as they were built and tested. The temperature contours and velocity field in a wall specimen are shown next.
Heat Transfer and Airflow in Wall Specimens
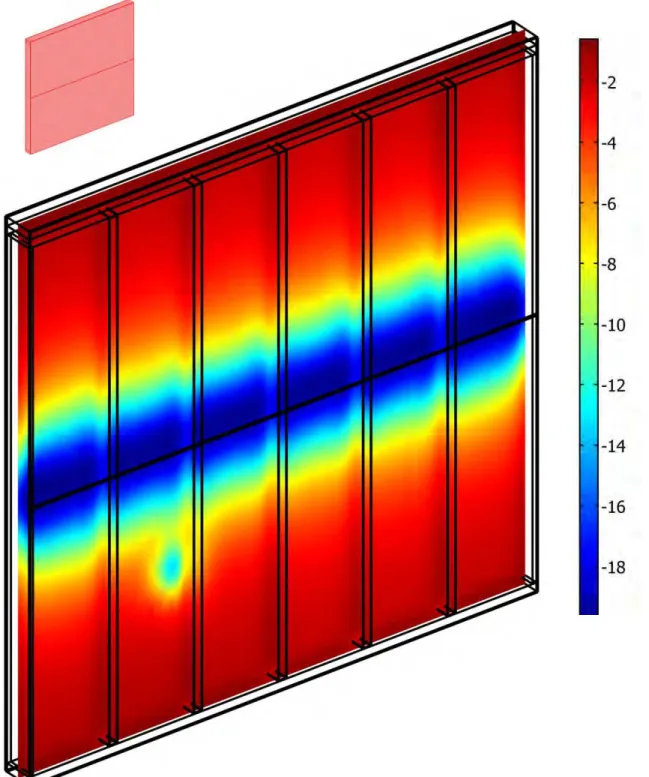
Figure 7 shows the air velocity field in a wall specimen with penetration (WER-5) for a measured leakage rate of 0.62 L/(s.m2) at pressure difference across the wall of 75 Pa. In this figure, the length of the velocity arrows is proportional to the magnitude of the resultant velocity. The air enters the wall specimen through the 3 mm gap between the Oriented Strand Board (OSB) sheathing boards at -20oC. Then, it flows through the wall and eventually exits the wall specimen through the electrical outlet box. As shown in this figure, the local air velocity and its direction vary within the wall specimen. The effects of the airflow through wall specimens (with and without penetration) on the local temperature distribution are shown in Figure 8 and Figure 9. These figures show the temperature contours in a slice passing through the middle of the wall assemblies at a leakage rate corresponding to pressure difference of 75 Pa. As shown in these figures, the local value of the air velocity (see Figure 7) greatly affects the local temperature distribution in the wall. For example, the region around the entry points of the air into the wall assembly has the lowest temperatures. Accurate prediction of the apparent R-value for a wall assembly requires capturing the three-dimensional effect on both the airflow and heat transfer through the wall assembly. The comparison of the predicted R-values using the present 3D model for the six wall specimens described earlier against the measured ones in the GHB are presented next.
RESULTS AND DISCUSSION
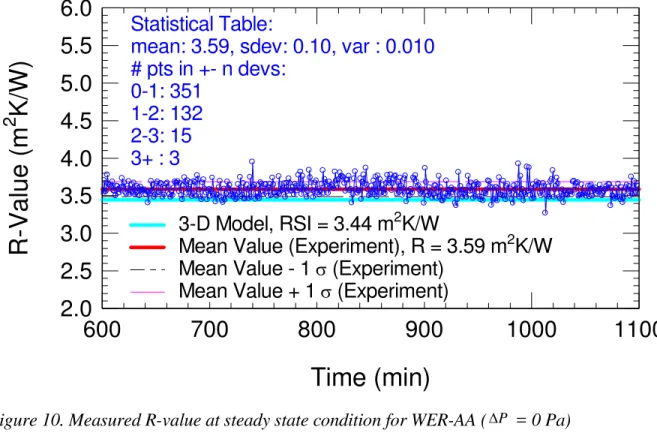
In this section, the present 3D model was used to predict the R-values for the 6 wall assemblies described earlier with and without air leakage. The details of the measurements of R-value and air leakage for different wall specimens are available in Elmahdy et al. (2009-b). Figure 10 shows sample result of the measured R-value in the GHB for the wall specimen WER-AA, with open cell SPF as thermal insulation. In this test, the steady state condition was achieved after ~10 hours. As shown in this figure, about 2/3 of the collected data for R-values falls within 1 (where = standard deviation value in m2K/W). The measured mean R-value for this wall was 3.59 m2K/W. The corresponding
standard deviation value of the measured R-value was 0.10 m2K/W. The 1 corresponds to a deviation from the mean R-value of +2.8%. This figure clearly shows that the uncertainty in most of the collected data for values was ~+6% (Elmahdy, 1992). As shown in Figure 10, the predicted and measured R-value for WER-AA was 3.44, and 3.59 m2K/W, respectively. Figure 11 shows a comparison between the predicted R-values using the present 3D model with the measured R-values for the 6 walls specimens at no air leakage. As shown in this figure, the predicted R-values for all walls are in good agreement with the measured ones (within +5%).
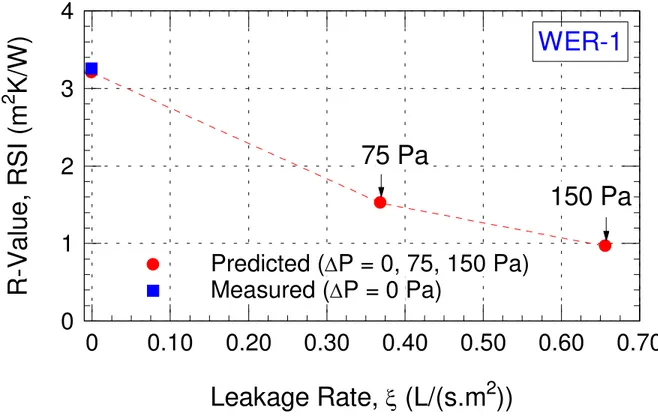
After gaining confidence in the present 3D model predictions for the R-values at no air leakage, it was used to predict the apparent R-values at different air leakage rates for the 6 wall specimens. The apparent R-value for the wall specimens with lapped poly, no sealing of penetrations (WER-1 and WER-5) was obtained at pressure differences across the wall of 75 and 150 Pa. However, for wall specimens with light density open cell SPF (WER-AA, WER-BB, WER-CC, and WER-DD), the apparent R-value was calculated at different pressure difference up to 600 Pa. Predicting the apparent R-value for a wide range of air leakage rate at different pressure difference across the wall is need in the next step of this project in order to develop a simple engineering correlation for determining the Wall Energy Rating (WER) number for different types of wall systems. Sample results for the predicted apparent R-values for WER-1 and WER-AA at different air leakage rates are shown in Figure 12 and Figure 13, respectively. As shown in these figures, the apparent R-values decrease as the air leakage rate increases.
CONCLUSION
3D numerical simulations were conducted using the present thermal model for different walls with and without penetration to predict the R-values with and without air leakage. The 2D capability of the present model was used to compare its predictions against the hygIRC-2D model, previously developed at NRC-IRC. The results showed that the predictions of both models are in good agreement. The present 3D model was used to predict the R-values of 6 wall specimens with and without penetration at no air leakage. The predicted values for these walls were in good agreement with the measured R-values in the NRC-IRC’ Guarded Hot Box (GHB) (within + 5%). The good agreements between the predictions of the present model and the measurements of R-values were due to: (a) the accurate measurements of R-values in GHB (uncertainties ~+ 6%, Elmahdy, 1992), (b) the accurate material characterizations, and (c) modeling the 6 wall specimens in 3D as they were built and tested. Furthermore, the present 3D model was used to predict the apparent R-values at different air leakage rates corresponding to pressure differences across the 6 wall specimens up to 600 Pa. The obtained results of R-values with and without air leakage for the 6 walls presented in this paper, other walls that used closed cell SPF with medium density as insulations (Elmahdy et al., 2009-a, Maref et al., 2009), and new walls that are currently being built and tested at NRC-IRC will be used to develop a simple engineering correlations for determining the Wall Energy Rating (WER) number for different types of wall systems. The results of this effort will be the subject for future publications.
ACKNOWLEDGEMENTS
The authors wish to acknowledge the contribution from the following: Canadian Urethane Foam Contractors Association (CUFCA), Honeywell, BASF and Demilec. The authors also wish to thank Dr. Kumar Kumaran for his support and guidance during the development of the 3D model, and Mr. Mike Nicholls for his efforts in constructing the wall specimens.
REFERENCES
ASTM E 283. 1997. Test Method for Rate of Air Leakage through Exterior Windows, Curtain Walls and Doors. Philadelphia: ASTM.
ASTM C 518. 2004. Steady-State Thermal Transmission Properties by Means of the Heat Flow Meter Apparatus. Section 4, Vol. 04.06. Philadelphia: ASTM.
ASTM C 1199. 1998. Test Method for Measuring the Steady State Thermal Transmittance of Fenestration Systems Using Hot Box Methods. Philadelphia: American Society for Testing and Materials.
ASTM E 1423. 1998. Practice for Determining the Steady State Thermal Transmittance of Fenestration Systems, Philadelphia: American Society for Testing and Materials.
Bird, R.B., Stewart, W.E., and Lightfoot, E.N. 1960. Transport Phenomena, John Wiley & Sons, Inc., pp. 149-150.
Bomberg, M.T., and Kumaran, M.K. 1989. Report on sprayed polyure-thane foam with alternative blowing agents. CFCs and the Polyurethane Industry: Vol 2 (A Compilation of Technical Publications) pp. 112-128, (NRCC-31113) (IRC-P-1638).
Canadian Construction Materials Center (CCMC). 1996. Technical Guide for Air Barrier Systems for Exterior Walls of Low-Rise Buildings, Masterformat Section 07272, National Research Council of Canada.
COMSOL Multiphysics 3.5a, www.comsol.com.
Elmahdy, A.H. 1992. Heat transmission and R-value of fenestration systems using IRC hot box: procedure and uncertainty analysis. ASHRAE Transactions, 98 (2), ASHRAE Annual Meeting, pp. 630-637.
Elmahdy, A.H., Maref, W., Swinton, M.C., and Tariku, F. 2009-a. Energy rating of polyurethane spray foamed walls: procedures and preliminary results. 4th International Building Physics Conference, Istanbul, Turkey, 15-18 June, 2009.
Elmahdy, A.H., Maref, W., Swinton, M.C., Saber, H.H., and Glazer, R. 2009-b. Development of energy ratings for insulated wall assemblies. Building Envelope Symposium, San Diego, California, October 26, 2009, pp. 21-30.
Kumaran, M.K., and Bomberg, M.T. 1990. Thermal performance of sprayed polyurethane foam insulation with alternative blowing agents. Journal of Thermal Insulation, 14, pp. 43-57, (NRCC-32365) (IRC-P-1695).
Maref, W., Elmahdy, A.H., Swinton, M.C., and Tariku, F. 2009. Assessment of energy rating of polyurethane spray walls: procedure and interim results. ASTM 2nd Symposium on Heat-Air-Moisture Transport: Measurements and Implications in Buildings, Sponsored by ASTM C16 on Thermal Insulation, Vancouver, British Colombia, Canada, April 19-20, 2009.
Maref, W., Kumaran, M.K., Lacasse, M.A., Swinton, M.C., and van Reenen, D. 2002-a. Laboratory measurements and benchmarking of an advanced hygrothermal model. Proceedings of the 12th
International Heat Transfer Conference, Grenoble, France, August 18, 2002, pp. 117-122 (NRCC-43054).
Maref, W., Lacasse, M.A., Kumaran, M.K., and Swinton, M.C. 2002-b. Benchmarking of the advanced hygrothermal model-hygIRC with mid-scale experiments. eSim 2002 Proc. (Univ. of Concordia, Montreal, September 12, 2002), pp. 171-176 (NRCC-43970).
National Building Code of Canada, 2005, Volume 1, Issued by the Canadian Commission on Building and Fire Codes, National Research Council of Canada.
Pakdee, W., and Rattanadecho, P. 2006. Unsteady effects of natural convective heat transfer through porous media in cavity due to top surface partial convection. Applied Thermal Engineering, 26, pp. 2316-1326.
Sozer, E., and Shyy, W. 2008. Multi-scale thermo-fluid transport in porous media. Int. J. of Numerical Methods for Heat & Fluid Flow, 19 (7), pp. 883-899.
ULC S705.1-01. 2005. Underwriters' Laboratories of Canada (ULC): (Including amendments 1&2). Standard for Thermal Insulation - Spray Applied Rigid Polyurethane Foam, Medium Density Material – Specification. 7 Underwriters Road, Toronto ON, Canada M1R 3B4.
Vafai, K., and Tien, C.L. 1981. Boundary and inertia effects on flow and heat transfer in porous media. Int. J. of Heat and Mass Transfer, 24, pp. 195-203.
Se c ti o n B -B COMSOL OS B ( M-1 0 ) G y psum B o a r d ( M -1 3 ) Spray Polyurethane Foam (M-24) Spray Polyurethane Foam (M-24) Air (M-42) Spruce (M-14) Air (M-42) Left T = -35oC h = 8 W/(m2K) P = Patm Right T = 20oC h = 8 W/(m2K) P = Patm Symmetry conditions Bottom Top Symmetry conditions
Figure 1. A horizontal cut through a wall showing different materials and boundary conditions
(b) Present 2D Model (a) hygIRC-2D model
Figure 2. Comparison of the temperature contours using hygIRC-2D and present 2D model for the test case shown in Figure 1
Figure 3. OSB sheathing board and Gypsum board for wall with penetration
Figure 5. Construction tolerances and 6 mil poly for wall with penetration Section A‐A 12.7 11 138 102 9 38 9 Dimensions in mm 32 GYB OSB SPF Stu d XPS W indow Fr a m e 12.5 mm gap filled with SPF Schematic drawing not to scale A A
Airflow
Airflow
Construction Tolerances
Figure 7. Isometric view of the air velocity arrows in WER-5 at leakage rate of 0.62 L/(s.m2), corresponding to 75 Pa
Figure 8. Temperature contours in a slice passing through the middle of the wall WER-1 at a leakage rate corresponding to 75 Pa (0.369 L/(s.m2))
Figure 9. Temperature contours in a slice passing through the middle of the wall WER-5 at a leakage rate corresponding to 75 Pa (0.62 L/(s.m2))
2.0
2.5
3.0
3.5
4.0
4.5
5.0
5.5
6.0
600
700
800
900
1000
1100
3-D Model, RSI = 3.44 m
2K/W
Mean Value (Experiment), R = 3.59 m
2K/W
Mean Value - 1
(Experiment)
Mean Value + 1
(Experiment)
Statistical Table:
mean: 3.59, sdev: 0.10, var : 0.010
# pts in +- n devs:
0-1: 351
1-2: 132
2-3: 15
3+ : 3
Time (min)
R-Value (m
2K/W)
Figure 10. Measured R-value at steady state condition for WER-AA (P = 0 Pa)
2.0
2.5
3.0
3.5
4.0
2.0
2.5
3.0
3.5
4.0
WER-1
WER-5
WER-AA
WER-BB
WER-CC
WER-DD
Uncertainties in the
measured R-value 6%
+5%
-5%
Measured R-Value (m
2K/W)
Predicted R-Value (m
2K/W)
0
1
2
3
4
0
0.10
0.20
0.30
0.40
0.50
0.60
0.70
Predicted (
P = 0, 75, 150 Pa)
Measured (
P = 0 Pa)
150 Pa
75 Pa
WER-1
Leakage Rate,
(L/(s.m
2))
R-Va
lu
e, RSI (m
2K/W)
Figure 12. Effect of the air leakage on the apparent R-value of WER-1