Publisher’s version / Version de l'éditeur:
Vous avez des questions? Nous pouvons vous aider. Pour communiquer directement avec un auteur, consultez la première page de la revue dans laquelle son article a été publié afin de trouver ses coordonnées. Si vous n’arrivez pas à les repérer, communiquez avec nous à PublicationsArchive-ArchivesPublications@nrc-cnrc.gc.ca.
Questions? Contact the NRC Publications Archive team at
PublicationsArchive-ArchivesPublications@nrc-cnrc.gc.ca. If you wish to email the authors directly, please see the first page of the publication for their contact information.
https://publications-cnrc.canada.ca/fra/droits
L’accès à ce site Web et l’utilisation de son contenu sont assujettis aux conditions présentées dans le site LISEZ CES CONDITIONS ATTENTIVEMENT AVANT D’UTILISER CE SITE WEB.
Proceedings of Combustion Institute, Canadian Section Spring Technical Meeting,
May 9-12, 2010, Ottawa, ON, 2010
READ THESE TERMS AND CONDITIONS CAREFULLY BEFORE USING THIS WEBSITE. https://nrc-publications.canada.ca/eng/copyright
NRC Publications Archive Record / Notice des Archives des publications du CNRC :
https://nrc-publications.canada.ca/eng/view/object/?id=d2f24b39-dd94-4cc1-8821-fdeb82356617
https://publications-cnrc.canada.ca/fra/voir/objet/?id=d2f24b39-dd94-4cc1-8821-fdeb82356617
NRC Publications Archive
Archives des publications du CNRC
This publication could be one of several versions: author’s original, accepted manuscript or the publisher’s version. / La version de cette publication peut être l’une des suivantes : la version prépublication de l’auteur, la version acceptée du manuscrit ou la version de l’éditeur.
Access and use of this website and the material on it are subject to the Terms and Conditions set forth at
Investigation of optical properties of aging soot
_____________________________________________ Proceedings of Combustion Institute – Canadian Section Spring Technical Meeting Carleton University, Ottawa May 9-12, 2010
Investigation of Optical Properties of Aging Soot
F. Migliorini, K. A. Thomson*. G. J. SmallwoodNational Research Council of Canada, Ottawa
1. Introduction
Recent research and development in the area of combustion have been motivated by the commitment of preserving a clean environment and to reduce the health impact of airborne species such as soot particles and polycyclic aromatic hydrocarbons. Soot formation also plays an important role in the performance of all combustion processes. Therefore, it is mandatory to have accurate measurement techniques for in-situ characterization of soot during its formation, and to quantify soot emissions. The former is critical for the validation of combustion models and soot formation sub-models, while the latter is needed to assess emission factors for complex combustion systems and to evaluate emission reduction strategies. Many optical diagnostic techniques have been developed for these purposes over the last several decades. These methods can offer remote, non intrusive, in situ, spatially and temporally precise measurements of important parameters including soot concentration and morphology and so they are particularly suitable for the combustion environment. Nevertheless, the interpretation of soot optical diagnostics requires the knowledge of the optical properties of soot; specifically, the propensity of soot to absorb and scatter light as a function of its wavelength. Soot optical properties are of particular importance in the interpretation of soot pyrometry, where emission at two or more wavelengths is used to determine soot temperature and concentration [1-4].
Many studies of soot optical properties are presented in the literature, but they show large uncertainties and discrepancies, in particular for in-flame soot. In the present work we present an overview of the data available in literature in order to highlight the different optical properties of soot at various stages of formation, referred herein as aging soot. In many cases the optical properties of mature, post-flame soot are used to evaluate soot optical measurements in-flame. We hypothesize that this assumption is not valid and can lead to substantial error in the interpretation of in-flame measurements.
Recently, Thomson et al. [5] studied the variation of soot optical properties in an ethylene laminar diffusion flame, performing Spectral Line-of-Sight Attenuation (Spec-LOSA) measurements. Close to the tip of the flame where mature soot would be expected, the soot absorption function, E(m), was relatively invariant with wavelength over the range of 450-750 nm. This is general consistent with observations made for over-fire soot from flames of various fuels [6-7]. Conversely, measurements made much lower in the same flame showed a 50% decrease in E(m) over the same spectral range. The latter finding has profound implications for the interpretation of pyrometric measurements, whether based on natural or laser-induced emission. The McKenna burner [8] is another example of a burner widely used in the literature. The flame is considered as a standard in lean and close-to-stoichiometric conditions and employed in many laboratories around the world for the development and calibration of optical diagnostic techniques. The flame is designed and assumed to be one-dimensional, which allows simplified combustion modeling. Therefore, several studies performed under rich conditions have studied the mechanism of soot formation, combining optical and sampling techniques with detailed chemical kinetics simulations [9-13]. Moreover this burner is used as a standard for the development of the laser-induced incandescence (LII) technique [14-16].
In the present work we investigate a rich ethylene/air premixed flame produced by a McKenna burner, in a standard condition adopted for intercomparison by the LII community. Spectrally resolved line-of-sight attenuation measurements have been performed to evaluate the spectral variation of the refractive index
*
Corresponding author, Kevin Thomson, kevin.thomson@nrc-cnrc.gc.ca
absorption function at various heights in the flame. We show that the measured refractive index absorption function, E(m) which potentially includes effects of non-soot light absorbing constituents, has a very strong spectral dependence which varies with height above the burner. The implications of the measurement are discussed in terms of their impact on flame emission and soot laser-induced incandescence measurements.
2. Soot optical properties in the literature
The optical properties of soot have been studied for many years with particular attention focused on refractive index. However, the spread of the soot refractive indices reported in the literature is quite wide even when restricted to the visible wavelengths [17-23]. Various arguments have been stated with regard to which optical property measurements are valid and which ones should be excluded [24] but ultimately large uncertainties remain. Through this debate, a key observation sometimes made but often not emphasized is that various types of carbon particles are produced during combustion processes and that these different particles have different optical properties which may also change as the particles age from young soot to mature soot. In a recent paper, Andreae et al. [25] reported definitions of various types of atmospheric carbon, such as soot carbon, brown carbon, light absorbing carbon, elemental carbon and black carbon. These classes of absorbers are not universally recognized and the distinction between them is not clear. Nevertheless, , a different spectral dependence of light absorption by black carbon and brown carbon has been found [24-26], where the refractive index of soot carbon is often observed to be wavelength independent, while brown carbon has an enhanced absorption in the UV. This might be related to differences in the elemental composition, typically in the H/C ratio, even if some conflicting results on the relationship between H/C ratio and refractive index have been presented [18,27]. According to Alfè et al. [28], the nature of the fuel and soot aging are responsible for variations in the internal nanostructure of soot, resulting in diverse spectral features. The variations in the internal structure of soot primary particles are due to different soot inception mechanisms occurring in flames that are more or less rich in the aromatic species considered to be soot precursors. Other important parameters to take into account when considering in-flame soot are the residence time and burner type [29]. Varying the flame geometry, it is possible to influence the heating of the fuel stream and consequently the soot formation and growth processes. As a consequence, the concentration of soot precursor particles and polycyclic aromatic hydrocarbons (PAHs), which are sufficiently large to absorb and emit light in the upper UV and lower visible wavelengths, can be enhanced to the point where they influence soot optical diagnostics.
Finally, it is noted that in early 1990s, two groups of researchers reported the existence of 2-4 nm non-soot nanoparticles in flames, with different properties and roles in soot formation [30]. According to D’Alessio et al. [31] these particles, observed in rich premixed ethylene/oxygen flames, are strong absorbers in the UV but are transparent in the visible and can be thought of as polymer-like structures containing sub-structures with aliphatic aromatic (2-3 ring) bonds. Conversely, in observing the mass spectra of soot precursors in a nonsmoking ethene diffusion flame, Dobbins et al. [32] recognized similar particles as layers of fully condensed large PAHs and noted that they should be capable of absorbing in the visible. Several new methods for nanoparticle measurements have been developed recently as summarized in a review by D’Anna [33].
In contrast to the confusing and sometimes contradictory observations summarized from the literature above, some measurements and a literature review focused on post-flame soot have observed somewhat more consistent optical properties for soot [6-7,24] for a range of fuels ranging from light gases to liquids. This suggests that given sufficient time or the opportunity to cool to ambient temperatures, soot may in fact stabilize to a form which exhibits reliable optical properties. While this may be true, it does not resolve the problem of selecting optical properties for the analysis and interpretation of in-flame soot measurements. Much more has been stated on this complex and contentious topic than can be summarized here. However, we observe that attribution of soot optical properties to in-flame soot is not trivial and consequently the validity of in-flame optical measurements of soot needs to be examined closely.
3. Theory
Line-of-sight-attenuation (LOSA) is a well established soot diagnostic valuable for soot volume fraction, fv,
mapping [34]. In LOSA measurements, the optical transmissivity of an aerosol is measured along a linear path through the medium. The transmissivity of the path, τ, at wavelength λ, is measured as the ratio of
light intensity before, Iλ,0, to that after passing through the attenuating medium, Iλ. The transmissivity is
ds K I I (e) 0 , exp (1)where s is the spatial location along the path. If the medium is uniform along the line-of-sight, Eq. 1 simplifies to: L K y) (e) ( ln (2)
where L is the length of the chord through the medium. For a horizontal chord through the centerline of a McKenna burner this simplification is approximately true.
According to RDG-FA (Rayleigh-Debye-Gans – Fractal Aggregate) theory for fractal aggregates made up of primary particles that fall in the Rayleigh range (i.e. dp/ < 0.3, where dp is the diameter of a primary
particle), soot concentration is related to the extinction, absorption and scattering coefficients as:
) ( ) 1 ( 6 ) ( 6 , ) ( ) ( m E K m E K f sa e a v (3)
where sa, is the ratio of the total scatter coefficient (over 4*π steradian), K(s), to the absorption
coefficient, K(a). The scatter coefficient can be estimated via RDG-FA theory if soot morphology is known (e.g. the primary particle diameter and number of particles per aggregate).
In circumstances where light scatter is negligible (i.e. for very small soot aggregates) or for soot of known morphology, Spec-LOSA provides a valuable tool to investigate the relative variation of E(m) with λ:
( ) ( ) ) (~
6
)
(
a e v aK
K
f
K
m
E
(4)since fv is constant in a given measurement. Absolute measurement of E(m) is possible if fv can be
unequivocally measured by another method such as gravimetric sampling (e.g. [35]). If is noted that in the above analysis, it is implicitly assumed that soot is the only constituent in the optical path absorbing light. In fact, and as discussed above, large PAH and non-soot nanoparticles may also contribute and so the measured refractive index function is effective in that it includes influence of these other species.
4. Apparatus
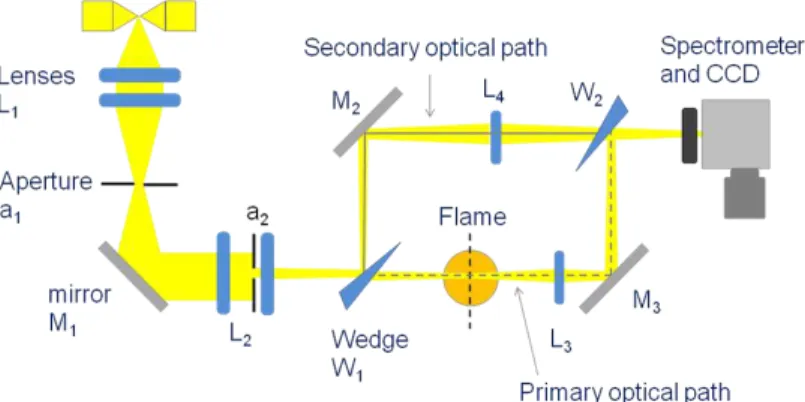
Due to the large diameter (60 mm) of the investigated flame and depth-of-field issues, the one-dimensional Spec-LOSA technique, previously used to investigate a laminar diffusion flame [3], could not be applied. Instead, a single line-of-sight, zero-dimensional method, was developed for this flame. The experimental apparatus is shown schematically in Figure 1. An intense diffuse light produced by an Hg arc lamp was focused through a circular 1 mm diameter aperture with a pair of optically conjugate achromatic lenses (254 mm focal length, 50 mm diameter) with a nominal magnification of 1:1. The aperture plane was then imaged to the center of the flame with another pair of achromatic lens (300 mm focal length, 50 mm diameter) again with the same magnification. In order to reduce depth-of-field blur of the beam over the 60 mm diameter of the flame, a rectangular aperture (10 mm wide x 2 mm high) was placed between the two lenses. This achieves a high spatial resolution over the measurement depth-of-field in the vertical direction while allowing the beam to blur in the horizontal direction, which is appropriate for the one-dimensional McKenna burner flame. In order to provide a reference measurement of the lamp intensity before transmission through the flame, the light beam was split into two paths by means of a wedge: the primary optical path passing through the center axis of the flame, while the secondary optical path bypasses the flame. The rectangular aperture was imaged using matched 200 mm focal length lenses (25.4 mm diameter) onto the vertical entrance slit of a spectrometer (nominal magnification 1:1), where the location on the entrance slit was shifted vertically for one beam such that two signals, the lamp (our light source) and the transmission (both the lamp and the flame) were collected at the same time. In this way any variation in lamp output during the acquisition period was captured.
The spectrometer was configured to measure in the wavelength range of 450 to 800 nm. This range was selected to optimize the combination of the output intensity of the lamp and the sensitivity of the detector,
while avoiding second order effects in the spectrometer. The CCD attached to the output plane of the spectrometer records the two signals on one axis and wavelength on the orthogonal axis.
Figure 1: Schematic of Spec-LOSA diagnostic
A transmissivity measurement is typically achieved from a sequence of four measurements. These are the detected intensity of the lamp without the attenuation medium present (lamp), the intensity measured in the absence of lamp and attenuating medium (dark), the intensity with both the lamp and attenuating medium (transmission), and the intensity measured from the attenuating medium in the absence of the lamp (emission). The transmissivity is then calculated as τλ = (transmission – emission)/(lamp-dark). At each
measurement height, image sets consisted of 20 shot acquisitions for each measurement (i.e., lamp, dark,
transmission and emission) averaged to reduce shot noise.
An ethylene/air premixed flame was used in these experiments. The flame was produced on a bronze porous plug McKenna burner (inner-plug diameter 60 mm) at atmospheric pressure. The total fuel/air flow rate was 10 l/min and the equivalence ratio was 2.1. To shield the flame from the surrounding air, an external shroud of nitrogen, flowing at 15 l/min, was used. Moreover, for flame stabilization, a stainless steel plate of 60 mm diameter was placed at 21 mm above the burner.
Spec-LOSA measurements were performed at a range of heights above the burner (HAB) surface, from 6 to 16 mm, in order to follow the soot inception, growth, and aging processes.
5. Results
A typical set of averaged images is shown in Figure 2, along with the transmissivity calculated from these images. The horizontal axis of each image is the spectral axis. Whereas the raw data has a spectral resolution of 6.7 µ m per pixel, the data used for calculations was binned into 60 nm bins along the spectral axis to reduce shot noise.
Figure 2: Spec-LOSA measurements in ethylene/air premixed flame, 20 shot averages, HAB = 12 mm
The upper spectrum in each image represents the intensity from the primary optical path (i.e. the light passing through the flame) and the lower spectrum is the secondary optical path. Therefore, in order to get the transmissivity the following procedure was applied: the emission was subtracted from transmission and
dark was subtracted from lamp and stored as two temporary images. The data for the primary and
secondary optical paths were then binned over the height of the spectral line (i.e. vertically) to generate two curves of intensity versus wavelength for each temporary image. Then the primary path curves were divided by the secondary path curves to achieve a transmissivity curve. Since the two optical paths do not necessarily have identical light transmission efficiencies, a normalization procedure has been performed. A second pair of images were taken in absence of the flame and processed as the previous ones in order to
obtain the normalization curve, Finally, the normalized transmissivity was measured by the ratio
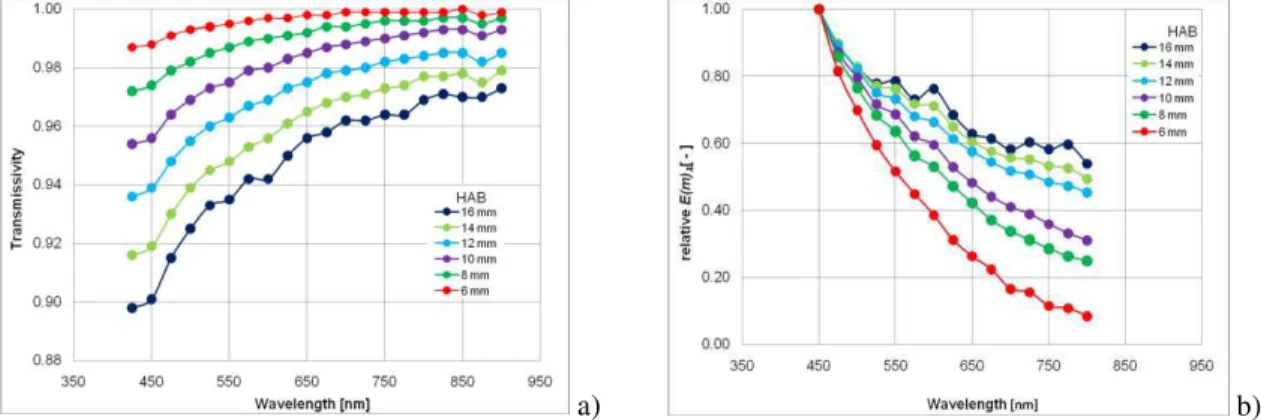
The spectral variation of the transmissivity at different heights above the burner is illustrated in Figure 3(a), showing the spectral variation of the measurements and the strong increasing light attenuation with increasing height in the flame. The greatest attenuation occurs at the shortest wavelengths.
a) b)
Figure 3: Transmissivity (a) and relative E(m)(b) at different heights above the burner
Since the McKenna burner is quasi one-dimensional only a single line-of-sight measurement through the burner centerline was made at each height and a line integrated extinction coefficient was evaluated via Eq.(2). When multiplied by the measurement wavelength, this quantity is proportional to the soot refractive index absorption function, E(m)λ, if light scattering by the aggregates is small relative to light absorption.
To gain information on soot morphology, thermophoretic sampling and transmission electron microscopy (TEM) analysis were performed. The sampling probe consist of a carbon-coated circular copper TEM grid (3 mm diameter). The probe was rapidly inserted into the flame and rapidly withdrawn after an exposure time of 80 ms. The sampling location was at the centerline of the flame at a height of 12 mm above the burner. The grids were examined with transmission electron microscopy and the images obtained were processed using commercial image processing software (Image-Pro Plus). Soot morphology parameters were measured as Df = 1.73, kf = 1.89, dp = 20 nm, Ng = 12.15 and 2g = 2.22. A correction for scattering
has been calculated following the method outlined in [35]. At this height above the burner the maximum correction for scattering is 1.8% at 450 nm and drops to 0.8% at 800 nm.
Therefore, even if the primary particle diameter and the aggregation are expected to increase slightly with the height above the burner, in the present case, the approximation of negligible scattering is quite accurate. Figure 3(b) shows the relative E(m)λ behaviour as a function of HAB, where the data at each height is
normalized to E(m) at the lowest wavelength (λ = 450 nm).
As can be observed in Fig 3(b), the relative E(m) is highly variant with wavelength at all the heights above the burner. The slope of the curves is greater lower down in the flame, reaching an almost 80% variation at HAB = 6 mm over the range 450 nm to 800 nm. However, even at the height of 16 mm, the variation is still 45%. Another important observation is that the curves do not level to a constant value or consistent slope at wavelengths in the near infrared. Thus, the common assumption that attenuation or emission measurements in the upper visible or near infrared will avoid interferences from PAH or nanoparticles or other possible uncertainties in soot optical properties is not supported under these flame conditions. Finally it should be noted that the technique is not sensitive to variation in the absolute magnitude of E(m). It is possible that
E(m) remains constant at the highest wavelength measured but is more likely that the magnitude is also
varying through the flame.
The source of the variation of relative E(m) with height above burner is uncertain. As summarized in Section 2, attenuation may come from large PAH, semi-transparent soot precursor nanoparticles, brown carbon, and black carbon. Each would have different spectral absorption tendencies and the overall relative
E(m) curve variation could simply track the dominance of each class of particle in the overall mixture as a function of height. Equally, particles in each class of absorbing species could be evolving such that their spectral characteristics change with height.
Whether the detected attenuation comes from soot or non-soot species, this observation has significant implications for all soot optical diagnostics. In attenuation measurements, the measured soot volume fraction is inversely proportional to E(m) and all attenuation is attributed to soot. To avoid participation of
[16]. However, the observed variation of E(m) with wavelength out to 800 nm at all heights makes selection of an appropriate wavelength difficult and brings into question the assumption that all attenuation is by soot only. In soot emission measurements, the influence is even more dramatic. For example, assuming that the measured absorption leading to the results shown in Fig. 3(b) is entirely due to soot, a two-colour pyrometry measurement of soot emission at 450 and 800 nm in the McKenna burner at a height of 6 mm would over-predict the soot temperature by 450 K (assuming an initial temperature of 1800 K) and would under-predict the soot volume fraction by 88% if a constant E(m) was used when analyzing the
data. At the standard height of 12 mm used in the LII community, the temperature would be over-predicted by 200 K and the soot volume fraction would be under-predicted by 63%. The implication of a varying relative E(m)for two-colour LII measurements is less clear. While large PAH and nanoparticles could contribute to attenuation and possibly to emission signals, it is less likely that they could be laser-heated to the same peak temperatures as soot without evaporating or sublimating and therefore would likely make a small contribution to the total LII emission signal. Conversely, if the soot is comprised of brown carbon (i.e. immature or high hydrogen content soot), attribution of an appropriate E(m) to the soot during LII
signal analysis would be difficult and errors would propagate in a similar fashion to two colour flame emission measurements.
It is evident from the current measurements that there is a great deal of uncertainty surrounding the correct soot refractive index absorption function to use when interpreting light absorption and emission measurements from soot and other absorbing/emitting species in a McKenna burner. Participation of large PAH and nanoparticles is likely but not sufficient to explain the observed strong and height varying spectral behaviour of relative E(m). This behaviour is critical to the correct interpretation of soot emission
measurements and makes measurements essentially impossible without a priori knowledge of the relative
E(m) function at the measurement location. Future research will include LII measurements collected in the same flame with the objective of clarifying the contribution of non-soot species to the absorption and to LII measurements, and to correct LII measurement interpretation.
7. Acknowledgements
The NSERC PERD Program and the NRC/Helmholtz collaborative research fund are acknowledged for their support.
References
[1] F. Liu, K.A. Thomson, G.J. Smallwood, “Numerical investigation of the effect of signal trapping on soot measurements using LII in laminar coflow diffusion flames,” Appl. Phys. B, 96 (2009) 671-682. [2] D.R. Snelling, K.A. Thomson, G.J. Smallwood, Ö.L. Gulder, E.J. Weckman, R.A. Fraser, “Spectrally
Resolved Measurement of Flame Radiation to Determine Soot Temperature and Concentration,” AIAAJ. 40(9) (2002) 1789-1795.
[3] S. De Iuliis, M. Barbini, S. Benecchi, F. Cignoli, G. Zizak, “Determination of th Soot Volume Fraction in an Ethylene Diffusion Flame by Multiwavelength Analysis of Soot Radiation,” Combust. Flame 115 (1998) 253-261.
[4] B.M. Crosland, M.R. Johnson, K.A. Thomson, “Analysis of uncertainties in instantaneous soot volume fraction measurements using two-dimensional auto-compensating laser-induced incandescence (2D-AC-LII),” submitted to Applied Physics B, March 2009.
[5] K.A. Thomson, M.R. Johnson, D.R. Snelling, G.J. Smallwood, “One-Dimensional Spectral Line-of-Sight Attenuation for Soot Optical Property Measurement,” Proceedings of Combustion Institute Canadian Section Spring Technical Meeting, Toronto, ON, May 12-14, 2008.
[6] S.S. Krishnan, K.C. Lin, J.S. Wu, G.M. Faeth, “Optical properties in the visible of soot emitted from turbulent pool fires,” ASME Heat Transfer Division American Society of Mechanical Engineers, Heat Transfer Division 352 (1997) 39-48.
[7] Ü.Ö. Köylü; G.M. Faeth, “Radiative properties of flame-generated soot,” Transactions of the ASME Journal of Heat Transfer, 115(2) (1993) 409-17.
[8] D.W. Senser, J.S. Morse, V.A. Cundy, “Construction and novel application of a flat flame burner facility to study hazardous waste combustion,” Rev. Sci. Instrum, 56(6) (1985) 1279-1284.
[9] A. D’Alessio, G. Gambi, P. Minutolo, S. Russo, A. D’Anna, “Optical characterization of rich premixed CH4/O2 flames across the soot formation threshold,” Proc. Combust. Inst. 25 (1994)
645-651.
[10] F. Xu, P.B. Sunderland, G.M. Faeth, “Soot formation in laminar premixed ethylene/air flames at atmospheric pressure,” Combust. Flame 108(4) (1997) 471-493.
[11] B. Atakan, A. Lamprecht, K. Kohse-Hoinghaus, “An experimental study of fuel-rich 1,3 pentadiene and acetylene/propene flames”, combust. Flame 133 (2003) 431-440.
[12] B. Apicella, M. Alfé, R. Barbella, A. Tregrossi, A. Ciajolo, “Aromatic structures of carbonaceous material and soot inferred by spectroscopic analysis,” Carbon 42(8-9) (2004) 1583-1589.
[13] A.V. Menon, S.-Y. Lee, M.J. Linevsky, T.A. Litzinger, R.J. Santoro, “Addition of NO2 to a laminar
premixed ethylene-air flame: Effect on soot formation,” Proc. Combust. Inst. 31 (2007) 593-601. [14] B. Axelsson, R. Collin, P.-E. Bengtsson, “Laser-induced incandescence for soot particle size
measurements in premixed flat flames,” Appl. Opt. 39(21) (2000) 3683-3690.
[15] V. Kruger, C. Wahl, R. Hadef, K.P. Geigle, W. Stricker, M. Aigner, “Comparison of laser-induced incandescence method with scanning mobility particle size technique: the influence of probe sampling and laser heating on soot particle size distribution,” Meas. Sci. Technol. 16 (2005) 1477-1486. [16] C. Schulz, B.F. Kock, M. Hoffmann, H. Michelsen, S. Will, B. Bougie, R. Suntz, G. Smallwood,
“Laser-induced incandescence: recent trends and current questions,” Appl. Phys. B 83 (2006) 333-354.
[17] H. Chang; T.T. Charalampopoulos, “Determination of the wavelength dependence of refractive indeces of flame soot,” Proc. R. Soc. London, Ser. A 430(1880) (1990) 577-91
[18] W.H. Dalzell, A.F. Sarofim, “Optical Constants of Soot and Their Application to Heat-Flux Calculations,” J. Heat Tran. 91 (1969) 100-104.
[19] B.J. Stagg, T.T. Charalampopoulos, “Refractive-indexes of pyrolytic-graphite, amorphous carbon and flame soot in the temperature range 25 to 600°C,” Comb. Flame 94 (1993) 381-396.
[20] S.C. Lee, C.L. Tien, “Optical constants of soot in hydrocarbon flames,” Proc. Combust. Inst. 18 (1981) 1159-1166.
[21] S.S. Krishnan, K.C. Lin, G.M. Faeth, “Extinction and scattering properties of soot emitted from buoyant turbulent diffusion flames,” J. Heat Transfer 123 (2001) 331-339.
[22] M.Y. Choi, G.W. Mulholland, A.Hamins and T.Kashiwagi, “Comparisons of the soot volume fraction using gravimetric and light extinction techniques,” Combust. Flame 102 (1995) 161-169.
[23] D.R. Snelling, F. Liu, G.J. Smallwood, O.L. Gulder, “Determination of the soot absorption function and thermal accommodation coefficient using low-fluence LII in a laminar coflow ethylene diffusion flame,” Comb. Flame 136 (2004) 180-190.
[24] T.C. Bond, R.W. Bergstrom, “Light Absorption by Carbonaceous Particles: An Investigative Review,” Aerosol Sci. Technol. 40 (2006) 27-67.
[25] M.O. Andreae, A. Gelencser, “Black carbon or brown carbon? The nature of light-absorbing carbonaceous aerosols,” Atmos. Chem. Phys. 6 (2006) 3131-3148.
[26] H. Moosmuller, R.K. Chakrabarty, W.P. Arnott, “Aerosol light absorption and its measurement: a review,” J. Quant. Spectrosc. Rad. 110 (2009) 844-878.
[27] A.I. Medalia, L.W. Richards, “Tinting Strength of Carbon Black,” J. Colloid Interface Sci. 40(2) (1972) 233-252.
[28] M. Alfè, B. Apicella, R. Barbella, J.-N. Rouzaud, A. Tregrorssi, A. Ciajolo, “Structure-property relationship in nanostructures of young and mature soot in premixed flames,” Proc. Combust. Inst. 32 (2009) 697-704.
[29] T.C. Williams, C.R. Shaddix, K.A. Jensen, J.M. Antilla, “Measurements of the dimensionless extinction coefficient of soot within laminar diffusion flames,” Int. J. Heat Mass Tran. 50 (2007) 1616-1630.
[30] H-H. Grotheer, H. Pokorny, K-L Barth, M. Thierley, M. Aigner, “Mass spectrometry up to 1 million mass units for the simultaneous detection of primary soot and of soot precursors (nanoparticles) in flames,” Chemosphere 57 (2004) 1335-1342.
[31] A. D’Alessio, A. D’Anna, A. D’Orsi, P. Minutolo, R. Barbella, A. Ciajolo, “Precursor formation and soot inception in premixed ethylene flames,” Proc. Combust. Inst. 24 (1992) 973-980.
[32] R.A. Dobbins, R.A. Fletcher, W. Lu, “Laser Microprobe Analysis of Soot Precursor Particles and Carbonaceous Soot,” Combust. Flame 100 (1995) 301-309.
[33] A. D’Anna, “Combustion-formed nanoparticles,” Proc. Combust. Inst. 32 (2009) 593-613.
[34] K.A. Thomson, M.R. Johnson, D.R. Snelling, G.J. Smallwood, “Diffuse-light two-dimensional line-of-sight attenuation for soot concentration measurements,” Appl. Opt. 47(5) (2008) 694-703.
[35] A. R. Coderre, K.A. Thomson, D.R. Snelling, M.R. Johnson, “Measuring optical properties of cooled soot,” Proceedings of Combustion Institute Canadian Section Spring Technical Meeting, Toronto, ON, May 12-14, 2008.