HAL Id: hal-02869929
https://hal-sde.archives-ouvertes.fr/hal-02869929
Submitted on 16 Jun 2020
HAL is a multi-disciplinary open access
archive for the deposit and dissemination of
sci-entific research documents, whether they are
pub-lished or not. The documents may come from
teaching and research institutions in France or
abroad, or from public or private research centers.
L’archive ouverte pluridisciplinaire HAL, est
destinée au dépôt et à la diffusion de documents
scientifiques de niveau recherche, publiés ou non,
émanant des établissements d’enseignement et de
recherche français ou étrangers, des laboratoires
publics ou privés.
Reveal Convergence between Birds and Bats
Se Jin Song, Jon Sanders, Frédéric Delsuc, Jessica Metcalf, Katherine Amato,
Michael Taylor, Florent Mazel, Holly Lutz, Kevin Winker, Gary Graves, et al.
To cite this version:
Se Jin Song, Jon Sanders, Frédéric Delsuc, Jessica Metcalf, Katherine Amato, et al.. Comparative
Analyses of Vertebrate Gut Microbiomes Reveal Convergence between Birds and Bats. mBio,
Amer-ican Society for Microbiology, 2020, 11 (1), �10.1128/mBio�. �hal-02869929�
Comparative Analyses of Vertebrate Gut Microbiomes Reveal
Convergence between Birds and Bats
Se Jin Song,
aJon G. Sanders,
aFrédéric Delsuc,
bJessica Metcalf,
cKatherine Amato,
dMichael W. Taylor,
eFlorent Mazel,
fHolly L. Lutz,
a,gKevin Winker,
hGary R. Graves,
i,jGregory Humphrey,
aJack A. Gilbert,
aShannon J. Hackett,
gKevin P. White,
kHeather R. Skeen,
g,lSarah M. Kurtis,
mJack Withrow,
hThomas Braile,
hMatthew Miller,
h,nKevin G. McCracken,
h,o,p,q,rJames M. Maley,
sVanessa O. Ezenwa,
t,uAllison Williams,
tJessica M. Blanton,
vValerie J. McKenzie,
wRob Knight
a,x,yaDepartment of Pediatrics, School of Medicine, University of California San Diego, La Jolla, California, USA
bInstitut des Sciences de l’Evolution de Montpellier (ISEM), CNRS, EPHE, IRD, Université de Montpellier, Montpellier, France cDepartment of Animal Sciences, Colorado State University, Fort Collins, Colorado, USA
dDepartment of Anthropology, Northwestern University, Evanston, Illinois, USA eSchool of Biological Sciences, University of Auckland, Auckland, New Zealand
fDepartment of Botany, Biodiversity Research Centre, University of British Columbia, Vancouver, British Columbia, Canada gIntegrative Research Center, Field Museum of Natural History, Chicago, Illinois, USA
hUniversity of Alaska Museum, Fairbanks, Alaska, USA
iDepartment of Vertebrate Zoology, National Museum of Natural History, Smithsonian Institution, Washington, DC, USA
jCenter for Macroecology, Evolution and Climate National Museum of Denmark, University of Copenhagen, Copenhagen, Denmark kInstitute for Genomics and Systems Biology, University of Chicago, Chicago, Illinois, USA
lCommittee on Evolutionary Biology, University of Chicago, Chicago, Illinois, USA mDepartment of Biology, University of Florida, Gainesville, Florida, USA
nSam Noble Oklahoma Museum of Natural History, Department of Biology, University of Oklahoma, Norman,
Oklahoma, USA
oDepartment of Biology, University of Miami, Coral Gables, Florida, USA
pRosenstiel School of Marine and Atmospheric Sciences, University of Miami, Miami, Florida, USA
qHuman Genetics and Genomics, Hussman Institute for Human Genomics, University of Miami Miller School
of Medicine, Miami, Florida, USA
rInstitute of Arctic Biology, University of Alaska, Fairbanks, Fairbanks, Alaska, USA sMoore Laboratory of Zoology, Occidental College, Los Angeles, California, USA tOdum School of Ecology, University of Georgia, Athens, Georgia, USA
uDepartment of Infectious Diseases, College of Veterinary Medicine, University of Georgia, Athens, Georgia, USA vMarine Biology Research Division, Scripps Institution of Oceanography, University of California San Diego, La
Jolla, California, USA
wDepartment of Ecology and Evolutionary Biology, University of Colorado Boulder, Boulder, Colorado, USA xDepartment of Computer Science & Engineering, Jacobs School of Engineering, University of California San
Diego, La Jolla, California, USA
yCenter for Microbiome Innovation, University of California San Diego, La Jolla, California, USA
Se Jin Song and Jon G. Sanders contributed equally to this article. Valerie J. McKenzie and Rob Knight contributed equally to this article.
ABSTRACT
Diet and host phylogeny drive the taxonomic and functional contents
of the gut microbiome in mammals, yet it is unknown whether these patterns hold
across all vertebrate lineages. Here, we assessed gut microbiomes from
⬃900
verte-brate species, including 315 mammals and 491 birds, assessing contributions of diet,
phylogeny, and physiology to structuring gut microbiomes. In most nonflying
mam-mals, strong correlations exist between microbial community similarity, host diet,
and host phylogenetic distance up to the host order level. In birds, by contrast, gut
microbiomes are only very weakly correlated to diet or host phylogeny.
Further-Citation Song SJ, Sanders JG, Delsuc F, Metcalf
J, Amato K, Taylor MW, Mazel F, Lutz HL, Winker K, Graves GR, Humphrey G, Gilbert JA, Hackett SJ, White KP, Skeen HR, Kurtis SM, Withrow J, Braile T, Miller M, McCracken KG, Maley JM, Ezenwa VO, Williams A, Blanton JM, McKenzie VJ, Knight R. 2020. Comparative analyses of vertebrate gut microbiomes reveal convergence between birds and bats. mBio 11:e02901-19.https://doi.org/10.1128/mBio .02901-19.
Editor Joerg Graf, University of Connecticut Copyright © 2020 Song et al. This is an
open-access article distributed under the terms of theCreative Commons Attribution 4.0 International license.
Address correspondence to Se Jin Song, [email protected], Valerie McKenzie, [email protected], or Rob Knight, [email protected].
This article is a direct contribution from Rob Knight, a Fellow of the American Academy of Microbiology, who arranged for and secured reviews by Margaret McFall-Ngai, University of Hawaii at Manoa, and Thomas Bosch, Christian-Albrechts-Universität zu Kiel.
Received 5 November 2019 Accepted 11 November 2019 Published
RESEARCH ARTICLE
Ecological and Evolutionary Science
®
7 January 2020
on January 7, 2020 at BIBL UNIVERSITE UPM
http://mbio.asm.org/
more, while most microbes resident in mammalian guts are present in only a
re-stricted taxonomic range of hosts, most microbes recovered from birds show little
evidence of host specificity. Notably, among the mammals, bats host especially
bird-like gut microbiomes, with little evidence for correlation to host diet or phylogeny.
This suggests that host-gut microbiome phylosymbiosis depends on factors
conver-gently absent in birds and bats, potentially associated with physiological adaptations
to flight. Our findings expose major variations in the behavior of these important
symbioses in endothermic vertebrates and may signal fundamental evolutionary
shifts in the cost/benefit framework of the gut microbiome.
IMPORTANCE
In this comprehensive survey of microbiomes of
⬎900 species,
includ-ing 315 mammals and 491 birds, we find a strikinclud-ing convergence of the microbiomes
of birds and animals that fly. In nonflying mammals, diet and short-term
evolution-ary relatedness drive the microbiome, and many microbial species are specific to a
particular kind of mammal, but flying mammals and birds break this pattern with
many microbes shared across different species, with little correlation either with diet
or with relatedness of the hosts. This finding suggests that adaptation to flight
breaks long-held relationships between hosts and their microbes.
KEYWORDS
diet, evolution, flight, microbiome, vertebrate
T
he mammalian gut microbiome has emerged as a key regulator of host physiology
(1), and coevolution between host and microbial lineages has played a key role in
the adaptation of mammals to their diverse lifestyles. Diet, especially herbivory, is an
important correlate of microbial diversity in mammals (2, 3). Most mammalian
micro-biomes are also strongly correlated with host phylogeny, despite profound shifts in diet
(2, 4–6). This suggests host factors that themselves change across host phylogeny, such
as gut physiology, play an important role in structuring the gut microbiomes across
mammals. The vertebrate adaptive immune system is even speculated to have evolved
as just such a factor for selective maintenance of symbiotic homeostasis (7).
The importance of phylogeny-correlated factors to the diversity of vertebrate
mi-crobiomes more generally is still poorly understood. Phylosymbiosis, or the observation
that more closely related host species have more similar microbiomes (8, 9), has been
described in a number of nonmammalian taxa (10, 11). Other analyses have found
substantial variation in phylosymbiotic signals among mammalian taxa (12), sometimes
with conflicting results (13, 14). The presence of a robust phylosymbiotic correlation
implies that host factors control microbial assembly. Even if the specific mechanisms
are unknown, variation in the strength or presence of a measurable phylosymbiotic
signal across host phylogeny could prove useful for identifying such mechanisms
through comparative studies. However, most studies to date have focused on just a few
taxa at a time, and variable methods for both surveying the microbiome and measuring
phylosymbiosis and host specificity (or the restriction of microbes to specific host
lineages) have made generalizations difficult.
Without broader evolutionary context, it is unclear how universally conserved
patterns of host-microbe phylosymbiosis actually are. Growing evidence indicates that
the strong patterns identified in mammals are the exception rather than the rule in
vertebrates. Meta-analyses of fish (15) and birds (16) have failed to detect the strength
of correlations to diet and phylogeny reported in mammals. A recent analysis of
samples from more than 100 vertebrate species also found the strength of
phyloge-netic correlation to be much higher in mammals than in birds, reptiles, amphibians, or
fish (17). It is increasingly appreciated in nonvertebrate animals that fundamental
aspects of the host’s relationship to its symbiotic community can change drastically
between taxa: many insects depend entirely on microbes for key metabolites, while
others seem to be devoid of resident gut microbes (18). The complexity of different
factors likely influencing diverse vertebrate gut communities remains a challenge to
uncovering the most important causal relationships. The diversity of animal
physiolo-gies, habitats, and lifestyles offers opportunities to use convergent “natural
on January 7, 2020 at BIBL UNIVERSITE UPM
http://mbio.asm.org/
ments” in evolutionary history to sort through this complexity. By filling out our
knowledge of microbial diversity across the vertebrate tree of life, we may be able to
use major transitions in the host-microbiome relationship to identify elements of
animal biology that are most likely to play such causal roles.
Reasoning that convergences in host phenotypes offer some of the clearest such
natural experiments, we have assembled a large sample set using the Earth Microbiome
Project standard methods (19) to identify patterns of phylosymbiosis and host
speci-ficity across vertebrates. Subsets of these data have previously explored convergences
in diet, including convergent evolution of myrmecophagy in mammals (20), folivory in
primates (4), and blood feeding in birds and mammals (21), as well as the impacts of
captivity on the gut microbiome (22). Here, we present our first analysis of the complete
data set, spanning samples from 315 mammalian species, 491 avian species, and 86
species representing other vertebrate classes (Fig. 1; see Data Set S1 in the
supple-mental material). Through large-scale vertebrate host sampling using consistent
meth-ods, we are able to compare broad patterns in the diversification of microbiomes both
within and between major vertebrate lineages with substantially greater power.
FIG 1 Host tree with diet composition as a bar chart, host taxonomic class in the inner ring, flight status as the outer ring, and strength of phylosymbiosis (Mantel Pearson correlation) plotted as branch color.
Convergence between Bird and Bat Microbiomes ®
on January 7, 2020 at BIBL UNIVERSITE UPM
http://mbio.asm.org/
RESULTS
Principal-coordinate analysis (PCoA) of the complete microbiome data set reveals a
striking pattern: although microbiomes from each vertebrate class generally cluster in
PCoA space (permutational multivariate analysis of variance [PERMANOVA] R
2⫽
0.04897, P
⫽ 0.001), bats group more closely with birds than with other mammals or
any other vertebrate class (Fig. 2). Furthermore, both of these clades harbor relatively
low proportions of Bacteroidetes but high proportions of Proteobacteria (see Fig. S1C
and D in the supplemental material), a phylum of bacteria highly associated with birds
(16, 23) and flight (Fig. S1A and B) that is diminished in most nonbat mammalian hosts.
Yet, despite these compositional similarities in the gut microbiomes of birds and bats,
we find that the strongest similarity between these clades is a lack of strong association
with a specific microbiome (Fig. 1).
In birds, we find gut microbiota in general to be only weakly correlated with host
phylogeny (multiple regression on distance matrices [MRM] R
2⫽ 0.02, P ⫽ 0.001)
(Fig. S2B; Table S1) and not correlated with host diet (P
⫽ 0.415) (Fig. S3A) despite diet
varying widely among bird lineages; this is juxtaposed with mammals, in which we see
a strong correlation to both diet and phylogeny (R
2⫽ 0.17, P ⫽ 0.001) (Fig. S2A to S3B
and Table S1). Rather, correlations between bird gut microbiota and host phylogeny are
more similar to levels in the less extensively sampled nonavian reptiles (R
2⫽ 0.03, P ⫽
0.002) and amphibians (R
2⫽ 0.03, P ⫽ 0.021). An analysis of beta diversity through time
(BDTT), a technique previously shown to deconvolute the contributions of host diet and
phylogeny to microbiome diversity in mammals (5), also showed little correlation
between bird diet and phylogeny at any depth of the microbial tree (Fig. S4C). Similarly,
bats had lower correlations between gut microbiota and both diet and phylogeny than
FIG 2 Principal-coordinate analysis of unweighted UniFrac distances between samples rarefied to 10,000 sequences/sample and filtered to include only up to 5 individuals per species (2,258 points). Colors represent host class, with the mammalian order Chiroptera shown as triangles; 95% confidence intervals per class represented by colored ellipses (separately for bats and nonflying mammals; Crocodylomorpha [crocodilians] excluded due to low sample number).
on January 7, 2020 at BIBL UNIVERSITE UPM
http://mbio.asm.org/
other well-sampled mammalian lineages in a BDTT analysis. Correlations between gut
alpha diversity and host body mass also held much more weakly for all birds (P
⫽
0.0101) than mammals (P
⬍ 0.001) (Fig. S5C), but only held for flightless mammals
when considering bats and flightless birds separately (P
birds, flighted⫽ 0.08, P
birds, flightless⫽
0.69, P
mammals, flighted⫽ 0.07, P
mammals, flightless⬍ 0.001) (Fig. S5D).
The lack of correlation between host factors and microbial composition in birds
appears to be partly a consequence of an overall lower level of specificity between
microbial and host taxa than is found in mammals. While in mammals, most amplicon
sequence variants (ASVs) are only found in a single host order, the opposite is true in
birds: most ASVs are shared broadly across host taxa (Fig. 3). Using a standardized effect
size measurement of Pielou’s evenness statistic to control for imbalances in our
sampling, we find that microbial communities associated with mammals are generally
much less evenly distributed across host taxa than are the microbial communities of
birds (Fig. 4, inset). In particular, bats and other mammals from insectivorous and
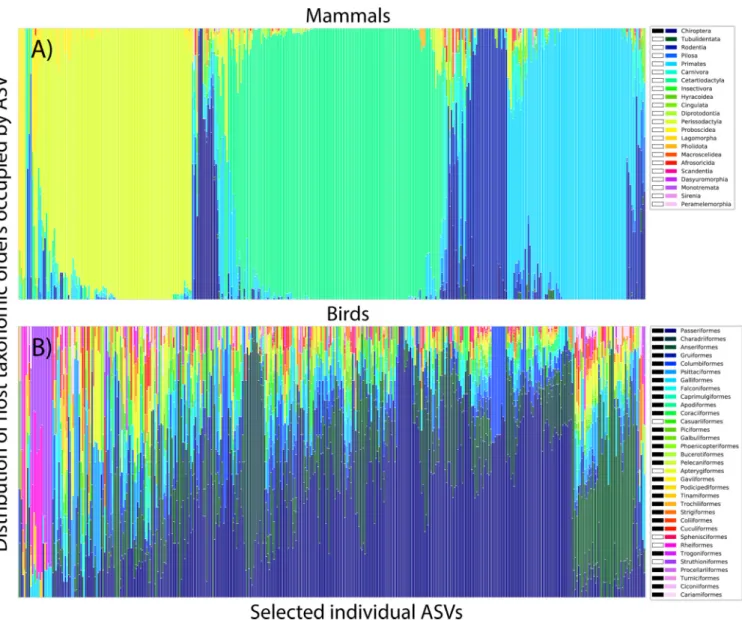
FIG 3 Taxonomic distributions of 400 randomly selected ASVs in mammals (A) and birds (B). Each column of the stacked bar chart corresponds to a different ASV. Different colored bars correspond to the taxonomic orders of each host sample in which that ASV is found, such that an ASV found in ten samples from the same host order would have a single colored column, while an ASV found in five samples each from two host orders would have a column evenly split into two colors. Note that on average, ASVs in mammals were only found in samples from a single mammalian order, while ASVs in birds were generally found in samples spanning many bird orders. ASVs with pink/purple bars on the left-most portion of panel B were found primarily in the flightless hosts of the Struthioniformes and Rheiformes orders (ostriches and rheas) within the Palaeognathae. Host orders capable of powered flight indicated by black bar in legend.
Convergence between Bird and Bat Microbiomes ®
on January 7, 2020 at BIBL UNIVERSITE UPM
http://mbio.asm.org/
carnivorous orders harbored the least specific communities; while among the birds, the
flightless orders (ostriches, emus, cassowaries, kiwis, and rheas), and the weak fliers
from the related Tinamiformes (tinamous) were among those hosting communities
with median specificities approaching those of mammals. The microbiota of these bird
orders (constituting the Palaeognathae) were also more likely to occur in mammals,
with samples from the Struthioniformes (ostriches), Rheiformes (rheas), and
Tinami-formes hosting the least bird-specific microbiota, and samples from the Eulipotyphla
(insectivorous shrews and moles), Dasyuromorphia (carnivorous marsupials), Pholidota
(ant-eating pangolins), and Chiroptera (bats) hosting the least mammal-specific
micro-biota (Fig. 4).
The association between flight and the loss of microbiome specificity is also
reflected in measurements of phylosymbiosis, suggesting that the evolution of
pow-ered flight profoundly disrupts the pattern of phylosymbiosis between host and gut
microbiome. We compared measurements of microbiome dissimilarity to host
phylo-genetic distance (measured as branch length on the TimeTree) (24) and approximate
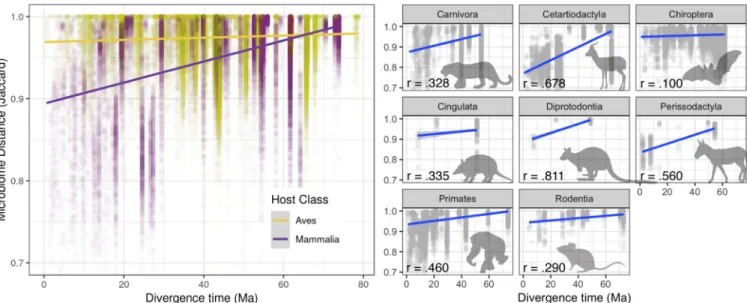
time-calibrated host phylogeny using the Mantel test (Fig. 1) (12, 25). We see that in
mammals as a whole, the correlation between microbial community similarity and host
phylogenetic distance is high, especially at recent timescales (Fig. S4A and B), whereas
this correlation is much lower in birds (mammals: P
⫽ 0.001, r ⫽ 0.40, coefficient ⫽
2.61E
⫺4; birds: P ⫽ 0.001, r ⫽ 0.14, coefficient ⫽ 8.92E⫺5) (Fig. 5, left). In contrast,
among mammalian orders, the strength of this correlation varies dramatically, with the
steepest relationships between phylogenetic distance and microbiome turnover in the
fermentative herbivores; among the well-sampled mammalian orders (
ⱖ7 species
represented), bats were unique in having little correlation at all (Fig. 5, right).
FIG 4 Flightless birds and bats have among the least bird- and mammal-specific microbiomes. Boxplot shows, per host sample grouped by taxonomic order, the mean log of the ratio of prevalence of an amplicon sequence variant (ASV) in mammals to its prevalence in birds. Samples from Chiroptera (bats) and palaeognath birds (Apterygiformes, Casuarii-formes, TinamiCasuarii-formes, RheiCasuarii-formes, and Struthioniformes) are highlighted with silhouettes. (Inset) Distribution of the standardized effect size of Pielou’s evenness for ASVs across host orders from mammals and birds (see also Fig. 3). Across mammals, most ASVs show uneven distribution (high specificity), while across birds, nearly all ASVs show even or near even distribution.
on January 7, 2020 at BIBL UNIVERSITE UPM
http://mbio.asm.org/
DISCUSSION
Our results suggest that the evolution of powered flight affected interactions
between hosts and microbes in birds and bats convergently: birds and mammals with
powered flight both display markedly less specificity than most nonflying mammals
and somewhat less specificity than nonflying birds. We considered several potential
proximate explanations for the convergent loss of microbial specificity in birds and
bats, which can be broken down into ecological, evolutionary, and technical factors.
First, flight could expose individuals to more diverse-source microbial communities,
resulting in increased microbial gut diversity if assembly of these communities was a
neutral process. This seems unlikely to be an important factor in itself, as vertebrate gut
communities have mostly been shown to follow nonneutral dynamics (26). If this were
the case, however, we might expect both birds and bats to host especially high alpha
diversity, reflecting colonization from a broader range of environments. Yet, the
opposite appears to be the case (see Fig. S5A in the supplemental material): both birds
and bats have lower mean alpha diversities than nonbat mammals (pairwise t tests,
P
⬍ 0.001 for observed operational taxonomic units [OTUs], Shannon diversity, and
Faith’s phylogenetic diversity [PD]). Furthermore, we did not see greater alpha diversity
in migratory birds, which presumably encounter a greater range of environments than
nonmigrators (P
⫽ 0.225 for observed OTUs) (Fig. S5B).
Similarities in microbiome composition and patterns of association suggest the
presence of flight-correlated host factors exerting similar selective pressures on the
assembly of the gut microbiome. Birds and bats both tend to have reduced intestinal
lengths and shorter intestinal content retention times, perhaps as a by-product of
selective pressure to decrease mass for more efficient powered flight (27–29). Shorter
guts, with correspondingly reduced anaerobic volumes, could also present less of a
barrier to microbial exchange through an aerobic environment. Accordingly, relative to
that in nonflying mammals, both birds and bats have fewer obligate anaerobes (P
⬍
0.001) and more facultative anaerobes (P
⬍ 0.001), and flightless birds have more
obligate anaerobes than flighted birds (P
⫽ 0.001) as a proportion of their gut microbial
communities, as measured by predicted high-level phenotypes using BugBase (30)
(Fig. S6).
It is possible that some other aspect of adaptation to flight has had a similar net
effect on microbiome specificity. The metabolic demands of powered flight are
pro-found and appear to have led to extensive and surprising degrees of convergence.
FIG 5 Mammals and birds show different patterns of phylosymbiosis. (Left) Within host orders, mammals show a generally strong correlation between host distance (estimated divergence time) and microbial community distance (Jaccard), but birds do not. (Right) Within mammalian orders with large sample size, bats (Chiroptera) show the weakest level of phylosymbiosis. For plots per bird order, see Fig. S7 in the supplemental material.
Convergence between Bird and Bat Microbiomes ®
on January 7, 2020 at BIBL UNIVERSITE UPM
http://mbio.asm.org/
Birds have the smallest genomes of all amniotes, and birds and bats both have more
compact genomes than their flightless relatives, most likely due to extensive DNA
loss— hypothesized to be related to powerful ongoing selection to reduce mass and
enhance flight-related correlates of metabolism (31, 32). It is therefore plausible that
pressure to decrease mass may extend to microbial biomass. Both birds and bats also
have greater rates of intestinal paracellular absorption than nonflying vertebrates (28,
29), meaning that a higher proportion of simple nutrients are absorbed directly by the
host, potentially decreasing the role for symbiotic microbial metabolism. Indeed, some
studies of microbial biomass across animal hosts have reported that both birds and bats
carry much lower numbers of microbial cells in feces than nonflying mammals (33). A
selection toward microbial reduction may also explain in part why birds and bats both
seem to have lost an association with Bacteroidetes but retained an association with
Proteobacteria, a group of bacteria suggested to have high functional variability (34): to
maximize microbial function while also reducing diversity and mass. Even if selective
pressure to reduce overall microbial biomass did not, in itself, lead to the loss of tight
evolutionary ties with specific symbionts, consistently lower resident microbial biomass
might increase the proportion of transient environmental microbes relative to the total
pool of microbes in the sample, decreasing the observed degree of host specificity on
average. Indeed, this could also help explain the dominance of Proteobacteria, which
make up a large proportion of the airborne microbiome (35), a source to which flighted
animals are constantly exposed.
If the convergent loss of microbial specificity in birds and bats is ultimately related
to selection toward a decreased reliance on microbes, it raises the possibility that the
proximate drivers include parallel changes in mechanisms mediating host-microbe
interactions. Consistent with this possibility, both birds and bats have lost large
numbers of genes involved in immune function, concomitant with a reduction in
genome size (36, 37), including reduced interferon (IFN) locus copy number (38, 39). In
bats, genes thought to be involved in minimization of DNA damage as a metabolic
consequence of flight have been linked to immune function and are also under positive
selection (36), suggesting that adaptation to flight may have affected key aspects of
immunity. Continuous and dampened expression of certain immune genes has been
proposed to allow bats to simultaneously manage flight-induced immune damage and
to tolerate a large number of viral pathogens without experiencing disease (36, 40).
Interestingly, our results suggest that bats also host significantly more potentially
pathogenic bacteria than other mammals (Tukey’s post hoc test, P
⬍ 0.001), implying
that links between flight and antiviral immunity may affect antibacterial immunity as
well.
We cannot completely discount the possibility that the similarities we observed
between bird and bat gut microbiomes are due at least in part to factors also correlated
with flight. For example, birds and bats both excrete uric acid, in contrast to most other
mammals. If uric acid or associated compounds interfere with DNA extraction or
somehow compromised the microbial DNA prior to extraction, our observed sequence
profiles might not accurately represent the relevant communities in vivo. However,
nonavian reptiles, which also excrete uric acid, resemble nonflying mammals in their
microbiome taxonomic compositions more than they resemble either birds or bats
(Fig. 2). In addition, in birds, unlike bats, uric acid and feces mix directly in the cloaca
before excretion. Finally, a subset of our bird samples was collected via intestinal
aspiration, prior to the addition of uric acid in the cloaca, and analyses performed with
this subset of samples did not differ substantially from those performed on feces (MRM
fecal: R
2⫽ 0.02, P ⫽ 0.001 for host phylogeny, P ⫽ 0.778 for diet; intestinal: R
2⫽ 0.02,
P
⫽ 0.001 for host phylogeny, P ⫽ 0.123 for diet). Consequently, this technical artifact
explanation appears unlikely.
The observed bird-bat similarities may also be due to the captivity state of the
source animals, in that much higher proportions of bird and bat samples were from
wild individuals than those of nonbat mammals. However, we found that captivity only
explains a small amount of the variation in our data (see Table S2), consistent with a
on January 7, 2020 at BIBL UNIVERSITE UPM
http://mbio.asm.org/
previous study showing that the effects of captivity on the animal gut microbiome is
not strong across mammals but rather varies markedly across host orders (22).
Further-more, a recent study of strictly wild animals also found higher levels of phylosymbiosis
in mammals than in other vertebrate groups, including birds (17), consistent with
captivity being an unlikely explanation for our observations.
Our data also suggest insectivory could be playing a role in microbiome specificity,
at least in mammals. Although diet explained only a very small proportion of variance
in bird microbiomes, and insectivorous mammals were not tightly clustered in our
analysis (Fig. S3B), insectivorous mammals harbored some of the least
mammalian-specific microbes (Fig. 4) and, like bats and birds, harbored higher proportions of
Proteobacteria (Fig. S1). Most individual lineages of insectivores were not sampled
deeply enough to accurately determine the strength of phylosymbiosis, but
insect-eaters like armadillos (Cingulata) did have some of the weakest signals in our data set
(Fig. 5). Previous work has reported some degree of convergence in the gut
micro-biomes of insectivorous mammals (20). Genomic analysis of insectivorous mammals
also indicates convergent retention of functional chitinase genes expected to play a
role in digesting the exoskeletons of their prey, potentially indicating a shift in reliance
away from microbial and toward host function (41). If this is the case, the major shifts
in host specificity we observe along independent branches on the vertebrate
phylog-eny in our data set could potentially be used to identify parallel changes in host genes
mediating gut microbiome diversity.
Collectively, our results suggest a striking convergent loss of host-microbe
associ-ations with the evolution of powered flight, breaking a conserved and consistent
pattern of phylosymbiosis observed in nonflighted mammals. We propose that this loss
of microbiome specificity represents not just a passive shift in neutral exposure to
microbial diversity but rather a fundamental and convergent shift in the physiological
mechanisms responsible for maintaining host-specific gut microbiomes. Though these
mechanisms are not yet well understood, the hypothesis of convergence between bats
and birds offers novel opportunities for their discovery and validation via comparative
approaches. Flight need not be the only mediator of such decreased reliance; indeed,
the other mammalian taxa shown here to have relatively less-specific microbiomes offer
additional opportunities for such comparisons. Our findings also raise a question not
often voiced: what are the evolutionary and metabolic costs of maintaining a specific
microbiome?
MATERIALS AND METHODS
Sample collection. Through a large collaborative network of researchers and zoo directors, samples were collated from museum collections, zoos, reserves, and populations in their natural habitats (see Data Set S1 in the supplemental material). Collections were conducted under approved IACUC protocols, and appropriate permits were obtained for sample collection and export where necessary. Sampling of fecal material from animals in zoos and reserves involved collecting up to 2 g of fresh fecal material using sterile swabs (BD CultureSwab or equivalent) within minutes to hours of deposition, which was immediately frozen, and stored at ⫺20°C until DNA extraction. Samples from museum collections included fecal or intestinal contents subsampled from frozen specimens using sterile implements or swabs. The 214 Smithsonian specimens were aspirations of large intestine (colon) from freshly killed wild birds. Samples taken directly from wild populations included fecal contents stored in RNAlater, on Whatman FTA cards, or in 95% ethanol (EtOH) (Data Set S1).
Sequencing. Samples collected for this project were processed using the Earth Microbiome Project standard processing protocols (19). A subset of samples originally collected for previously published studies (2, 3, 20) were reprocessed using these protocols. Briefly, sterile cotton-tipped swabs were used to transfer approximately 50 mg of sample to 96-well PowerSoil PowerMag DNA extraction plates (Qiagen), which were homogenized using a TissueLyser beadbeater (Qiagen); extractions were com-pleted on a KingFisher magnetic bead transfer robot (Thermo Fisher). From eluted DNA, triplicate PCRs using the 515f/806r EMP primers amplified the V4 region of the 16S rRNA gene, and pooled amplicons were sequenced on Illumina MiSeq and HiSeq instruments.
Data processing and metadata curation. To ensure that data from new samples were processed consistently with samples from prior studies, we uploaded all new sequence data to the Qiita web-based microbiome analysis platform for initial processing (42). All sequences were demultiplexed and quality filtered using Qiita defaults, and forward reads were trimmed to 100 bp prior to processing with Deblur to remove sequencing errors (43). To avoid potential artifactual sequences, we used the
“positive-Convergence between Bird and Bat Microbiomes ®
on January 7, 2020 at BIBL UNIVERSITE UPM
http://mbio.asm.org/
filtered” output table from Deblur, which retains only those sequences that approximately match the Greengenes 13_8 16S reference database (44).
Deblurred ASV tables and sample metadata were downloaded from each study and further pro-cessed using Qiime2 (45). Per-study ASV tables were combined, and a phylogeny was estimated with SEPP (46) as implemented in the q2-fragment-insertion Qiime2 plugin (47). Taxonomy was assigned using the Qiime2 naive Bayes feature classifier trained against the Greengenes 13_8 reference (44). ASVs classified as from mitochondria or chloroplasts were excluded from further analysis. Samples were rarefied to 10,000 reads. To prevent large imbalances in sample number among species from influencing ordinations, we randomly subsampled the rarefied data set to a maximum of 5 individuals per species, and these tables were used throughout the analysis.
Metadata tables for all samples were combined, and host-level metadata were added from several sources. To accomplish this, we first curated host species names and taxonomies against the NCBI taxonomy database using the Taxon Names Resolver python package (48). Samples for which the provided species name could not be automatically resolved were manually curated, as were taxa for which individual taxonomic levels were missing from NCBI taxonomy (e.g., Cetartiodactyla, which is an unranked level in NCBI). Curated species names were then matched against the EltonTraits ecological trait database, and any missing taxa checked and manually curated if necessary (49). Metadata on bird migration were compiled by K.W. from sources cited in Data Set S1.
To obtain an approximate host phylogeny, we matched curated species names to the TimeTree database (24). Unmatched taxa were manually curated and matched to the corresponding species binomial in the TimeTree database where possible. For taxa not present in the TimeTree database, we substituted a close congeneric species if (i) one was present in the TimeTree database, and (ii) there were no other congeneric species present in our sample set.
Beta diversity analyses. Beta diversity measures were calculated for the complete data set in Qiime2, using the SEPP insertion phylogeny for UniFrac phylogenetic metrics (50). Principal-coordinate analyses were performed in Qiime2 and visualized using Emperor (51) and ggplot2 (52) in R (53). Tests for categorical differences in beta diversity were performed using PERMANOVA (54) as implemented in R’s vegan package (55). To compare differences in beta diversity to differences in host diet and phylogeny, we used multiple regression of matrices as implemented in the ecodist package in R (56). To represent host evolutionary distance in these regressions, we used patristic distances derived from the TimeTree host phylogeny. To represent dietary dissimilarities, we used Bray-Curtis distances derived from the EltonTraits quantitative dietary compositions. To assess how correlations between microbiome dissimilarity and host phylogenetic and dietary dissimilarities were sensitive to microbial phylogenetic resolution, we used the SEPP insertion tree as an estimate of microbial phylogeny and compared correlations at different bacterial phylogenetic resolutions to the above host dietary and phylogenetic distances using Mantel tests in the beta diversity through time algorithm (5).
Alpha diversity analyses. Alpha diversity measures (observed OTUs, Faith’s phylogenetic diversity, and Shannon diversity) were calculated from the ASV tables rarefied to 10,000 sequences per sample in Qiime2. The SEPP insertion tree was used as an estimate of the bacterial phylogeny for the phylogenetic diversity measure. Differences in alpha diversity by categorical metadata variables were tested using ANOVA in R, with pairwise differences between categories assessed with the multcomp package (57). Differences in alpha diversity by continuous metadata variables were assessed using linear regressions. Host specificity analyses. We used several methods to assess host specificity in microbiomes. One measure of specificity is phylosymbiosis, or the correlation between host phylogenetic distance and microbiome dissimilarity. To quantify phylosymbiosis systematically across taxa, we implemented a version of the Mantel test as used by Nishida and Ochman (12), comparing measures of microbial beta diversity to host patristic distances derived from the TimeTree time-calibrated phylogeny. We used the Jaccard dissimilarity metric for most analyses, as this measure reflects the proportion of shared exact ASVs, and so is more sensitive to recent microbial codiversification than UniFrac (10). To prevent the possibility of zero-length within-species branches from biasing regressions, we randomly subsampled the data set to a single representative per species (25); for visualization purposes (e.g., Fig. 5), we plotted all between-species points while excluding within-species points. We calculated the Mantel Pearson cor-relation between microbiome dissimilarity and host phylogenetic distance and the partial Mantel correlation (conditioned on dietary distances) at every node of the host phylogeny that contained at least seven tips using the EcoPy package (58). We visualized the strength of the correlation across the host phylogeny using the iToL web-based tree rendering tool (59) (Fig. 1).
We also tested the specificity of ASVs to particular host taxa using an implementation of the environmental entropy calculation in reference 19. Briefly, we calculated the host taxonomic distribution of each ASV, represented by a vector of integers corresponding to the number of samples from each host taxon in which the ASV was observed. We only considered ASVs observed in at least ten samples. We transformed these integer vectors to per-ASV proportional values and visually illustrated host taxonomic distributions for ASVs with stacked bar charts (Fig. 3). We quantified specificity of these host taxonomic distributions using Pielous’s evenness statistic: maximally specific ASVs are found in just one host taxon, while minimally specific ASVs are found evenly across all host taxa. Because our sample set was not perfectly balanced across host taxa, biases in sampling could make ASV distribution appear uneven simply due to uneven sampling. Thus, we calculated a standardized effect size (SES) for this statistic. We permuted sample assignment within each ASV in the observation table, such that each ASV was found in the same number of samples in the permuted table as in the raw table. We then calculated the SES as the raw evenness statistic for an ASV, minus the mean of 100 permuted statistics, divided by the
on January 7, 2020 at BIBL UNIVERSITE UPM
http://mbio.asm.org/
standard deviation of the permuted statistics. We calculated a separate Pielou’s evenness SES value for each ASV based on its distribution across mammalian order-level taxa and across avian order-level taxa. To assess the degree to which individual ASVs were specific to mammalian or avian taxa, we calculated their likelihood of being observed in mammalian or avian samples, respectively. To do this, we used log risk ratios, or the log of the ratio of an ASV’s prevalence in mammalian samples to its prevalence in avian samples. Because this is undefined for ASVs never found in either mammals or birds, we set values for these taxa to⫾3, which just exceeded the range of defined values in our data set. We then calculated an average per sample as a measure of how specific ASVs in each sample were to mammals or birds.
Microbial characteristics. To predict high level microbial phenotypic characteristics using 16S sequence data, we implemented BugBase (https://bugbase.cs.umn.edu/) (30). We first clustered the deblurred ASVs against the Greengenes reference database (v13_5) at 99% identity and then rarefied the data to 5,000 sequences per sample.
To rank microbial phyla based on their association with birds, we used a regression approach for detecting differential abundances in microbiome data (60). ASVs were first collapsed at the phylum level based on taxonomy assigned using the Qiime2 naive Bayes feature classifier trained against the Greengenes 13_8 reference as described above. A model was built testing for differences among host classes, with Mammalia serving as the reference, using a batch size of 10 and an epoch of 1,000,000.
Data availability. Sequence data and metadata tables are available without restriction in Qiita (https://qiita.ucsd.edu/study/description/11166; full list of study identifiers [IDs] is in Data Set S1) and EBI (accession no. PRJEB35449). Analysis notebooks are available on Github (https://github.com/tanaes/ tetrapod_microbiome_analysis).
SUPPLEMENTAL MATERIAL
Supplemental material for this article may be found at
https://doi.org/10.1128/mBio
.02901-19
.
FIG S1, PDF file, 1.1 MB.
FIG S2, PDF file, 1.0 MB.
FIG S3, PDF file, 2.5 MB.
FIG S4, PDF file, 2.4 MB.
FIG S5, PDF file, 2.3 MB.
FIG S6, PDF file, 0.1 MB.
FIG S7, PDF file, 0.7 MB.
TABLE S1, DOCX file, 0.1 MB.
TABLE S2, DOCX file, 0.1 MB.
DATA SET S1, XLSX file, 2.2 MB.
ACKNOWLEDGMENTS
We thank the following individuals and institutions for contributing samples and for
their help in collecting samples: An Pas and Richard Jakob-Hoff (Auckland Zoo), Joseph
Mendelson (Atlanta Zoo), Kenton Kerns and Sara Hallager (National Zoo), Sabrina Wehrli
(Zurich Zoo), Paul Thompson (Taronga Zoo), Nicholas Holland (Scripps Institute of
Oceanography), Marilyn Marigold (South Florida Museum), Baptiste Mulot, Antoine
Leclerc, Alix Ortega, Alice Brunet, Nicolas Goddard, and Océane Graillot (ZooParc de
Beauval), David Gomis, Baptiste Chenet, Elodie Trunet, and Cédric Libert (Parc
Zoologique de Montpellier), Benjamin Lamglait (Réserve Africaine de Sigean), Mélanie
Berthet and Sandrine Apery (Jardin Zoologique de la Citadelle de Besançon), Corine
Esser (Zoo Fauverie du Mont Faron), Guillaume Douay (Jardin Zoologique de Lyon),
Marie Simon (Zoo de Lille), Pierre Delrieu (Parc Animalier de Gramat), and Emeric Figuet,
Marion Ballenghien, Lionel Hautier, and Guila Ganem (Institut des Sciences de
l’Evolution de Montpellier). Benoit de Thoisy and Roxane Schaub (Institut Pasteur de la
Guyane) provided access to samples from French Guiana. Nico Avenant (National
Museum of South Africa, Bloemfontein), Wendy Panaino, and Nora Weyer (University of
the Witwatersrand, Johannesburg) helped collect samples from Tswalu Kalahari Reserve
(South Africa). Fieldwork sessions were conducted under the auspices of the Tswalu
Foundation (
http://www.tswalufoundation.org
) with permission to collect fecal samples
granted by Duncan MacFadyen (E Oppenheimer & Son), Dylan Smith, and Gus van Dyk
(Tswalu Kalahari Reserve). Import permits were issued by the Direction Départementale
de la Protection des Populations (DDPP) de l’Hérault. We thank Ian Realo, Andrew
Engilis, Christina Gebhard, Christopher Milensky, Jacob Saucier, Brian Schmidt, and
James Whatton for help collecting microbiome aspirations of specimens from the
Convergence between Bird and Bat Microbiomes ®
on January 7, 2020 at BIBL UNIVERSITE UPM
http://mbio.asm.org/
United States National Museum. Collecting permits were issued by Maryland
Depart-ment of Natural Resources, Montana Fish, Wildlife and Parks, Texas Parks and Wildlife,
and the United States Fish and Wildlife Service. Collecting activities were conducted
under protocols of the Institutional Animal Care and Use Committee of the National
Museum of Natural History. Logistical support was provided by John Brennan, Louise
and Ernie Davis, Chris Hale, and Tim Ward in Texas, Paul Rhymer and Carolyn Thome in
Maryland, and Pat Gunderson in Montana. We thank members of the FMNH Emerging
Pathogens Project (EPP) including Josh Engel and Jason Weckstein for assistance
collecting avian samples for the Field Museum of Natural History.
We thank Zifeng Jiang for sample processing and Neil Gottel for help processing bat,
rodent, shrew, and herpetile samples from Uganda and Kenya. Permits were issued by
the Malawi Departments of Forestry and National Parks and Wildlife, Uganda Wildlife
Authority, Uganda National Council for Science and Technology, Kenya Wildlife Service,
and Kenya Forestry Service. Field assistance was provided by Waswa Sadic Babyesiza,
Charles Akora, Solomon Sebuliba, Julian Kerbis Peterhans, Paul Webala, and Beryl
Makori. Animal silhouettes were from
www.phylopic.org
, with thanks to Lukasiniho,
Cathy, Michelle Site, Chris Huh, Dori, Nevit Dilme, L. Shyamal, Matt Martyniuk, Michael
Keesey, Roberto Díaz Sibaja, Rebecca Groom, Tony Hisgett, and Gareth Monger for
artwork. Finally, we thank Luke Thompson for providing insightful conversation. This is
contribution ISEM 2019-222 of the Institut des Sciences de l’Evolution de Montpellier.
Fieldwork was supported by the Alexander Wetmore Fund (Smithsonian
Insti-tution) and the Department of Vertebrate Zoology (USNM). The EPP was funded by
the Davee Foundation and the Dr. Ralph and Marian Falk Medical Research Trust.
Financial support for field assistance was from Bruce Patterson, Onnolee and Orlin
Trapp, and the Council on Africa. This project was made possible by the following
funding sources: John Templeton Foundation (Convergent Evolution of the
Verte-brate Microbiome, grant ID 44000 to S.J.S., J.G.S., V.J.M., and R.K.), W.M. Keck
Foundation (DT061413 to R.K.), the European Research Council (ConvergeAnt
proj-ect, ERC-2015-CoG-683257), the Centre National de la Recherche Scientifique
(CNRS), and the Agence Nationale de la Recherche (CEBA, ANR-10-LABX-25-01) (to
F.D.), the Banting Postodoctoral Fellowship (to F.M.), the NSF PRFB (1611948 to
H.L.L.), U.S. Department of Agriculture, the late John DuPont, the Eurasian Pacific
Wildlife Conservation Foundation, and the Friends of Ornithology (to K.P.W.), Davee
Foundation and the Dr. Ralph and Marian Falk Medical Research Trust (to S.J.H.), and
NSF DEB-1102493 and NSF IOS-1101836 (to V.O.E.).
S.J.S., F.D., V.J.M., and R.K. conceived of the project. S.J.S., J.G.S., J.M., F.D., H.L.L., K.W.,
G.R.G., J.W., T.B., M.M., K.G.M., J.M.M., V.O.E., A.W., and J.M.B. collected samples. F.D.,
M.W.T., K.W., G.R.G., J.A.G., S.J.H., K.P.W., V.O.E., V.J.M., and R.K. provided funding
acquisition, resources, administrative, and supervisory roles that allowed for various
samples included in the data set to be collected and processed. G.H., H.R.S., and S.M.K.
helped process data. S.J.S, J.G.S., F.D., and F.M. analyzed the data. S.J.S., J.G.S., V.J.M., and
R.K. prepared the original manuscript draft. All authors contributed to revising the
manuscript.
We declare no competing interests.
REFERENCES
1. McFall-Ngai M, Hadfield MG, Bosch TCG, Carey HV, Domazet-Lošo T, Douglas AE, Dubilier N, Eberl G, Fukami T, Gilbert SF, Hentschel U, King N, Kjelleberg S, Knoll AH, Kremer N, Mazmanian SK, Metcalf JL, Nealson K, Pierce NE, Rawls JF, Reid A, Ruby EG, Rumpho M, Sanders JG, Tautz D, Wernegreen JJ. 2013. Animals in a bacterial world, a new imperative for the life sciences. Proc Natl Acad Sci U S A 110:3229 –3236.https://doi .org/10.1073/pnas.1218525110.
2. Ley RE, Hamady M, Lozupone C, Turnbaugh PJ, Ramey RR, Bircher JS, Schlegel ML, Tucker TA, Schrenzel MD, Knight R, Gordon JI. 2008. Evo-lution of mammals and their gut microbes. Science 320:1647–1651. https://doi.org/10.1126/science.1155725.
3. Muegge BD, Kuczynski J, Knights D, Clemente JC, González A, Fon-tana L, Henrissat B, Knight R, Gordon JI. 2011. Diet drives conver-gence in gut microbiome functions across mammalian phylogeny and within humans. Science 332:970 –974.https://doi.org/10.1126/ science.1198719.
4. Amato KR, Sanders GJ, Song SJ, Nute M, Metcalf JL, Thompson LR, Morton JT, Amir A, McKenzie VJ, Humphrey G, Gogul G, Gaffney J, Baden AL, Britton GAO, Cuozzo FP, Di Fiore A, Dominy NJ, Goldberg TL, Gomez A, Kowalewski MM, Lewis RJ, Link A, Sauther ML, Tecot S, White BA, Nelson KE, Stumpf RM, Knight R, Leigh SR. 2019. Evolutionary trends in host physiology outweigh dietary niche in structuring primate gut
on January 7, 2020 at BIBL UNIVERSITE UPM
http://mbio.asm.org/
microbiomes. ISME J 13:576 –587.https://doi.org/10.1038/s41396-018 -0175-0.
5. Groussin M, Mazel F, Sanders JG, Smillie CS, Lavergne S, Thuiller W, Alm EJ. 2017. Unraveling the processes shaping mammalian gut micro-biomes over evolutionary time. Nat Commun 8:14319.https://doi.org/ 10.1038/ncomms14319.
6. Sanders JG, Beichman AC, Roman J, Scott JJ, Emerson D, McCarthy JJ, Girguis PR. 2015. Baleen whales host a unique gut microbiome with similarities to both carnivores and herbivores. Nat Commun 6:8285. https://doi.org/10.1038/ncomms9285.
7. McFall-Ngai M. 2007. Adaptive immunity: care for the community. Na-ture 445:153.https://doi.org/10.1038/445153a.
8. Brucker RM, Bordenstein SR. 2012. The roles of host evolutionary relationships (genus: Nasonia) and development in structuring mi-crobial communities. Evolution 66:349 –362.https://doi.org/10.1111/ j.1558-5646.2011.01454.x.
9. Brooks AW, Kohl KD, Brucker RM, van Opstal EJ, Bordenstein SR. 2016. Phylosymbiosis: relationships and functional effects of microbial com-munities across host evolutionary history. PLoS Biol 14:e2000225. https://doi.org/10.1371/journal.pbio.2000225.
10. Sanders JG, Powell S, Kronauer DJC, Vasconcelos HL, Frederickson ME, Pierce NE. 2014. Stability and phylogenetic correlation in gut microbiota: lessons from ants and apes. Mol Ecol 23:1268 –1283.https://doi.org/10 .1111/mec.12611.
11. Pollock FJ, McMinds R, Smith S, Bourne DG, Willis BL, Medina M, Thurber RV, Zaneveld JR. 2018. Coral-associated bacteria demonstrate phylosym-biosis and cophylogeny. Nat Commun 9:4921.https://doi.org/10.1038/ s41467-018-07275-x.
12. Nishida AH, Ochman H. 2018. Rates of gut microbiome divergence in mammals. Mol Ecol 27:1884 –1897.https://doi.org/10.1111/mec.14473. 13. Phillips CD, Phelan G, Dowd SE, McDonough MM, Ferguson AW, Delton
Hanson J, Siles L, Ordóñez-Garza N, San Francisco M, Baker RJ. 2012. Microbiome analysis among bats describes influences of host phylog-eny, life history, physiology and geography. Mol Ecol 21:2617–2627. https://doi.org/10.1111/j.1365-294X.2012.05568.x.
14. Carrillo-Araujo M, Tas¸ N, Alcántara-Hernández RJ, Gaona O, Schondube JE, Medellín RA, Jansson JK, Falcón LI. 2015. Phyllostomid bat micro-biome composition is associated to host phylogeny and feeding strat-egies. Front Microbiol 6:447.https://doi.org/10.3389/fmicb.2015.00447. 15. Sullam KE, Essinger SD, Lozupone CA, O’Connor MP, Rosen GL, Knight R,
Kilham SS, Russell JA. 2012. Environmental and ecological factors that shape the gut bacterial communities of fish: a meta-analysis. Mol Ecol 21:3363–3378.https://doi.org/10.1111/j.1365-294X.2012.05552.x. 16. Waite DW, Taylor MW. 2015. Exploring the avian gut microbiota: current
trends and future directions. Front Microbiol 6:673.https://doi.org/10 .3389/fmicb.2015.00673.
17. Youngblut ND, Reischer GH, Walters W, Schuster N, Walzer C, Stalder G, Ley RE, Farnleitner AH. 2019. Host diet and evolutionary history explain different aspects of gut microbiome diversity among vertebrate clades. Nat Commun 10:2200.https://doi.org/10.1038/s41467-019-10191-3. 18. Hammer TJ, Sanders JG, Fierer N. 2019. Not all animals need a
micro-biome. FEMS Microbiol Lett 366:fnz117.https://doi.org/10.1093/femsle/ fnz117.
19. Thompson LR, Earth Microbiome Project Consortium, Sanders JG, Mc-Donald D, Amir A, Ladau J, Locey KJ, Prill RJ, Tripathi A, Gibbons SM, Ackermann G, Navas-Molina JA, Janssen S, Kopylova E, Vázquez-Baeza Y, González A, Morton JT, Mirarab S, Xu ZZ, Jiang L, Haroon MF, Kanbar J, Zhu Q, Song SJ, Kosciolek T, Bokulich NA, Lefler J, Brislawn CJ, Humphrey G, Owens SM, Hampton-Marcell J, Berg-Lyons D, McKenzie V, Fierer N, Fuhrman JA, Clauset A, Stevens RL, Shade A, Pollard KS, Goodwin KD, Jansson JK, Gilbert JA, Knight R. 2017. A communal catalogue reveals Earth’s multiscale microbial diversity. Nature 551:457– 463.https://doi .org/10.1038/nature24621.
20. Delsuc F, Metcalf JL, Wegener Parfrey L, Song SJ, González A, Knight R. 2014. Convergence of gut microbiomes in myrmecophagous mammals. Mol Ecol 23:1301–1317.https://doi.org/10.1111/mec.12501.
21. Song SJ, Sanders JG, Baldassarre DT, Chaves JA, Johnson NS, Piaggio AJ, Stuckey MJ, Nováková E, Metcalf JL, Chomel BB, Aguilar-Setién A, Knight R, McKenzie VJ. 2019. Is there convergence of gut microbes in blood-feeding vertebrates? Philos Trans R Soc Lond B Biol Sci 374:20180249. https://doi.org/10.1098/rstb.2018.0249.
22. McKenzie VJ, Song SJ, Delsuc F, Prest TL, Oliverio AM, Korpita TM, Alexiev A, Amato KR, Metcalf JL, Kowalewski M, Avenant NL, Link A, Di Fiore A, Seguin-Orlando A, Feh C, Orlando L, Mendelson JR, Sanders J, Knight R.
2017. The effects of captivity on the mammalian gut microbiome. Integr Comp Biol 57:690 –704.https://doi.org/10.1093/icb/icx090.
23. Hird SM, Sánchez C, Carstens BC, Brumfield RT. 2015. Comparative gut microbiota of 59 neotropical bird species. Front Microbiol 6:1403. https://doi.org/10.3389/fmicb.2015.01403.
24. Kumar S, Stecher G, Suleski M, Hedges SB. 2017. TimeTree: a resource for timelines, time trees, and divergence times. Mol Biol Evol 34:1812–1819. https://doi.org/10.1093/molbev/msx116.
25. Mazel F, Davis KM, Loudon A, Kwong WK, Groussin M, Parfrey LW. 2018. Is host filtering the main driver of phylosymbiosis across the tree of life? mSystems 3:e00097-18.https://doi.org/10.1128/mSystems.00097-18. 26. Jeraldo P, Sipos M, Chia N, Brulc JM, Dhillon AS, Konkel ME, Larson CL,
Nelson KE, Qu A, Schook LB, Yang F, White BA, Goldenfeld N. 2012. Quantification of the relative roles of niche and neutral processes in structuring gastrointestinal microbiomes. Proc Natl Acad Sci U S A 109:9692–9698.https://doi.org/10.1073/pnas.1206721109.
27. Stevens CE, Hume ID. 2004. Comparative physiology of the vertebrate digestive system. Cambridge University Press, Cambridge, United Kingdom.
28. Caviedes-Vidal E, McWhorter TJ, Lavin SR, Chediack JG, Tracy CR, Karasov WH. 2007. The digestive adaptation of flying vertebrates: high intestinal paracellular absorption compensates for smaller guts. Proc Natl Acad Sci U S A 104:19132–19137.https://doi.org/10.1073/pnas.0703159104. 29. Caviedes-Vidal E, Karasov WH, Chediack JG, Fasulo V, Cruz-Neto AP,
Otani L. 2008. Paracellular absorption: a bat breaks the mammal para-digm. PLoS One 3:e1425.https://doi.org/10.1371/journal.pone.0001425. 30. Ward T, Larson J, Meulemans J, Hillmann B, Lynch J, Sidiropoulos D, Spear JR, Caporaso G, Blekhman R, Knight R, Fink R, Knights D. 2017. BugBase predicts organism-level microbiome phenotypes. BioRxiv https://doi.org/10.1101/133462.
31. Kapusta A, Suh A, Feschotte C. 2017. Dynamics of genome size evolution in birds and mammals. Proc Natl Acad Sci U S A 114:E1460 –E1469. https://doi.org/10.1073/pnas.1616702114.
32. Wright NA, Gregory TR, Witt CC. 2014. Metabolic “engines” of flight drive genome size reduction in birds. Proc Biol Sci 281:20132780.https://doi .org/10.1098/rspb.2013.2780.
33. Hammer TJ, Janzen DH, Hallwachs W, Jaffe SP, Fierer N. 2017. Caterpillars lack a resident gut microbiome. Proc Natl Acad Sci U S A 114:9641–9646. https://doi.org/10.1073/pnas.1707186114.
34. Bradley PH, Pollard KS. 2017. Proteobacteria explain significant functional variability in the human gut microbiome. Microbiome 5:36.https://doi .org/10.1186/s40168-017-0244-z.
35. Cáliz J, Triadó-Margarit X, Camarero L, Casamayor EO. 2018. A long-term survey unveils strong seasonal patterns in the airborne microbiome coupled to general and regional atmospheric circulations. Proc Natl Acad Sci U S A 115:12229 –12234. https://doi.org/10.1073/pnas .1812826115.
36. Zhang G, Cowled C, Shi Z, Huang Z, Bishop-Lilly KA, Fang X, Wynne JW, Xiong Z, Baker ML, Zhao W, Tachedjian M, Zhu Y, Zhou P, Jiang X, Ng J, Yang L, Wu L, Xiao J, Feng Y, Chen Y, Sun X, Zhang Y, Marsh GA, Crameri G, Broder CC, Frey KG, Wang L-F, Wang J. 2013. Comparative analysis of bat genomes provides insight into the evolution of flight and immunity. Science 339:456 – 460.https://doi.org/10.1126/science.1230835. 37. Ahn M, Cui J, Irving AT, Wang L-F. 2016. Unique loss of the PYHIN gene
family in bats amongst mammals: implications for inflammasome sens-ing. Sci Rep 6:21722.https://doi.org/10.1038/srep21722.
38. Lovell PV, Wirthlin M, Wilhelm L, Minx P, Lazar NH, Carbone L, Warren WC, Mello CV. 2014. Conserved syntenic clusters of protein coding genes are missing in birds. Genome Biol 15:565.https://doi.org/10.1186/s13059 -014-0565-1.
39. Zhou P, Tachedjian M, Wynne JW, Boyd V, Cui J, Smith I, Cowled C, Ng JHJ, Mok L, Michalski WP, Mendenhall IH, Tachedjian G, Wang L-F, Baker ML. 2016. Contraction of the type I IFN locus and unusual constitutive expression of IFN-␣ in bats. Proc Natl Acad Sci U S A 113:2696–2701. https://doi.org/10.1073/pnas.1518240113.
40. Xie J, Li Y, Shen X, Goh G, Zhu Y, Cui J, Wang L-F, Shi Z-L, Zhou P. 2018. Dampened STING-dependent interferon activation in bats. Cell Host Microbe 23:297.e4 –301.e4.https://doi.org/10.1016/j.chom.2018.01.006. 41. Emerling CA, Delsuc F, Nachman MW. 2018. Chitinase genes(s) provide
genomic footprints of a post-Cretaceous dietary radiation in placental mammals. Sci Adv 4:eaar6478.https://doi.org/10.1126/sciadv.aar6478. 42. Gonzalez A, Navas-Molina JA, Kosciolek T, McDonald D, Vázquez-Baeza
Y, Ackermann G, DeReus J, Janssen S, Swafford AD, Orchanian SB, Sanders JG, Shorenstein J, Holste H, Petrus S, Robbins-Pianka A, Brislawn
Convergence between Bird and Bat Microbiomes ®
on January 7, 2020 at BIBL UNIVERSITE UPM
http://mbio.asm.org/
CJ, Wang M, Rideout JR, Bolyen E, Dillon M, Caporaso JG, Dorrestein PC, Knight R. 2018. Qiita: rapid, web-enabled microbiome meta-analysis. Nat Methods 15:796 –798.https://doi.org/10.1038/s41592-018-0141-9. 43. Amir A, McDonald D, Navas-Molina JA, Kopylova E, Morton JT, Zech
Xu Z, Kightley EP, Thompson LR, Hyde ER, Gonzalez A, Knight R. 2017. Deblur rapidly resolves single-nucleotide community sequence patterns. mSystems 2:e00191-16. https://doi.org/10.1128/mSystems .00191-16.
44. DeSantis TZ, Hugenholtz P, Larsen N, Rojas M, Brodie EL, Keller K, Huber T, Dalevi D, Hu P, Andersen GL. 2006. Greengenes, a chimera-checked 16S rRNA gene database and workbench compatible with ARB. Appl Environ Microbiol 72:5069 –5072.https://doi.org/10.1128/ AEM.03006-05.
45. Bolyen E, Rideout JR, Dillon MR, Bokulich NA, Abnet CC, Al-Ghalith GA, Alexander H, Alm EJ, Arumugam M, Asnicar F, Bai Y, Bisanz JE, Bittinger K, Brejnrod A, Brislawn CJ, Brown CT, Callahan BJ, Caraballo-Rodríguez AM, Chase J, Cope EK, Da Silva R, Diener C, Dorrestein PC, Douglas GM, Durall DM, Duvallet C, Edwardson CF, Ernst M, Estaki M, Fouquier J, Gauglitz JM, Gibbons SM, Gibson DL, Gonzalez A, Gorlick K, Guo J, Hillmann B, Holmes S, Holste H, Huttenhower C, Huttley GA, Janssen S, Jarmusch AK, Jiang L, Kaehler BD, Kang KB, Keefe CR, Keim P, Kelley ST, Knights D, et al. 2019. Reproducible, interactive, scalable and extensible microbiome data science using QIIME 2. Nat Biotechnol 37:852– 857. https://doi.org/10.1038/s41587-019-0209-9.
46. Mirarab S, Nguyen N, Warnow T. 2012. SEPP: SATé-enabled phylogenetic placement. Pac Symp Biocomput 2012:247–258.https://doi.org/10.1142/ 9789814366496_0024.
47. Janssen S, McDonald D, Gonzalez A, Navas-Molina JA, Jiang L, Xu ZZ, Winker K, Kado DM, Orwoll E, Manary M, Mirarab S, Knight R. 2018. Phylogenetic placement of exact amplicon sequences improves associ-ations with clinical information. mSystems 3:e00021-18.https://doi.org/ 10.1128/mSystems.00021-18.
48. Bennett DJ, Sanders JG, Hudson LN. 2016. Taxon Names Resolver: a python package for the automatic search of taxon names against the Global Names Resolver.https://github.com/DomBennett/TaxonNamesResolver. 49. Wilman H, Belmaker J, Simpson J, de la Rosa C, Rivadeneira MM, Jetz W.
2014. EltonTraits 1.0: species-level foraging attributes of the world’s birds and mammals. Ecology 95:2027–2027.https://doi.org/10.1890/13 -1917.1.
50. Lozupone C, Knight R. 2005. UniFrac: a new phylogenetic method for comparing microbial communities. Appl Environ Microbiol 71: 8228 – 8235.https://doi.org/10.1128/AEM.71.12.8228-8235.2005. 51. Vázquez-Baeza Y, Pirrung M, Gonzalez A, Knight R. 2013. EMPeror: a tool
for visualizing high-throughput microbial community data. Gigascience 2:16.https://doi.org/10.1186/2047-217X-2-16.
52. Wickham H. 2009. ggplot2: elegant graphics for data analysis. Springer Science & Business Media, Berlin, Germany.
53. R Development Core Team. 2008. R: a language and environment for statistical computing. R Foundation for Statistical Computing, Vienna, Austria.
54. Anderson MJ. 2001. A new method for non-parametric multivariate analysis of variance. Austral Ecol 26:32– 46. https://doi.org/10.1111/j .1442-9993.2001.01070.pp.x.
55. Oksanen J, Blanchet FG, Kindt R, Legendre P, O’Hara RB, Simpson GL, Solymos P, Stevens MHH, Wagner H. 2010. vegan: community ecology package. R package version 1.17– 4. https://cran.r-project.org/ package⫽vegan.
56. Goslee SC, Urban DL. 2007. The ecodist package for dissimilarity-based analysis of ecological data. J Stat Softw 22:1–19.
57. Hothorn T, Bretz F, Westfall P. 2008. Simultaneous inference in general parametric models. Biom J 50:346 –363. https://doi.org/10.1002/bimj .200810425.
58. Lemoine N, Gregory M. 2015. ecopy: first release. Zenodo, CERN, Geneva, Switzerland.https://doi.org/10.5281/zenodo.29232.
59. Letunic I, Bork P. 2016. Interactive tree of life (iTOL) v3: an online tool for the display and annotation of phylogenetic and other trees. Nucleic Acids Res 44:W242–W245.https://doi.org/10.1093/nar/gkw290. 60. Morton JT, Marotz C, Washburne A, Silverman J, Zaramela LS, Edlund A,
Zengler K, Knight R. 2019. Establishing microbial composition measure-ment standards with reference frames. Nat Commun 10:2719.https:// doi.org/10.1038/s41467-019-10656-5.