Publisher’s version / Version de l'éditeur:
Vous avez des questions? Nous pouvons vous aider. Pour communiquer directement avec un auteur, consultez la première page de la revue dans laquelle son article a été publié afin de trouver ses coordonnées. Si vous n’arrivez pas à les repérer, communiquez avec nous à PublicationsArchive-ArchivesPublications@nrc-cnrc.gc.ca.
Questions? Contact the NRC Publications Archive team at
PublicationsArchive-ArchivesPublications@nrc-cnrc.gc.ca. If you wish to email the authors directly, please see the first page of the publication for their contact information.
https://publications-cnrc.canada.ca/fra/droits
L’accès à ce site Web et l’utilisation de son contenu sont assujettis aux conditions présentées dans le site LISEZ CES CONDITIONS ATTENTIVEMENT AVANT D’UTILISER CE SITE WEB.
First International Tunnel Safety Forum for Road and Rail [Proceedings], pp. 57-66, 2007-04-23
READ THESE TERMS AND CONDITIONS CAREFULLY BEFORE USING THIS WEBSITE.
https://nrc-publications.canada.ca/eng/copyright
NRC Publications Archive Record / Notice des Archives des publications du CNRC :
https://nrc-publications.canada.ca/eng/view/object/?id=0e408771-3670-4176-bd7c-b4928e18e1eb https://publications-cnrc.canada.ca/fra/voir/objet/?id=0e408771-3670-4176-bd7c-b4928e18e1eb
NRC Publications Archive
Archives des publications du CNRC
This publication could be one of several versions: author’s original, accepted manuscript or the publisher’s version. / La version de cette publication peut être l’une des suivantes : la version prépublication de l’auteur, la version acceptée du manuscrit ou la version de l’éditeur.
Access and use of this website and the material on it are subject to the Terms and Conditions set forth at
The Proper use of emergency ventilation systems can significantly enhance road tunnels fire safety
http://irc.nrc-cnrc.gc.ca
T h e P r o p e r u s e o f e m e r g e n c y v e n t i l a t i o n
s y s t e m s c a n s i g n i f i c a n t l y e n h a n c e r o a d
t u n n e l s f i r e s a f e t y
N R C C - 4 9 4 9 0
K a s h e f , A . ; D e b s , A .
A version of this document is published in / Une version de ce document se trouve dans: First International Tunnel Safety Forum for Road and Rail, Nice, France, April 23-25, 2007, pp. 57-66
The material in this document is covered by the provisions of the Copyright Act, by Canadian laws, policies, regulations and international agreements. Such provisions serve to identify the information source and, in specific instances, to prohibit reproduction of materials without written permission. For more information visit http://laws.justice.gc.ca/en/showtdm/cs/C-42
Les renseignements dans ce document sont protégés par la Loi sur le droit d'auteur, par les lois, les politiques et les règlements du Canada et des accords internationaux. Ces dispositions permettent d'identifier la source de l'information et, dans certains cas, d'interdire la copie de documents sans permission écrite. Pour obtenir de plus amples renseignements : http://lois.justice.gc.ca/fr/showtdm/cs/C-42
THE PROPER USE OF EMERGENCY VENTILATION SYSTEMS CAN SIGNIFICANTLY ENHANCE ROAD TUNNELS FIRE SAFETY
Ahmed Kashef, National Research Council of Canada Alexandre Debs, Ministère des Transports du Québec, Canada
ABSTRACT
A research project has been conducted at the National Research Council of Canada to evaluate the effectiveness in a road tunnel of the current emergency ventilation system to control smoke spread in the event of a fire. The research includes both numerical and experimental studies. The numerical study uses the Fire Dynamic Simulator model to investigate smoke ventilation in tunnels. The experimental study is used to validate the numerical model and to provide the necessary initial and boundary conditions.
This paper investigates the effect of the meteorological parameters and tunnel slope on the performance of in-place emergency ventilation strategies in a section of a road tunnel. The study recommends methods for improving the performance of the ventilation strategies in order to promote a safer environment in the tunnel section.
1 INTRODUCTION
Life safety is one of the major concerns in the design of tunnel systems. In a tunnel environment, fire and smoke represent a serious hazard to which people may be exposed. As the number and length of tunnels increase and more people use them, fire safety issues are becoming of even greater importance. The main fire safety issues comprise: safe evacuation; safe rescue operation; minimal effects on environment; and minimal loss of property.
In the event of a fire incident, an appropriate emergency ventilation strategy (EVS) should be implemented almost instantaneously. The principal objective of the EVS is to provide an environment sufficiently clear of smoke and hot gases to permit a safe evacuation of motorists and a relatively safe access for firefighters. An EVS involves the selection, automatically or manually, of a sequence of fan operations. Establishing the optimal EVS is a challenging task during the design phase of the ventilation system. This task must take into account all critical fire scenarios, tunnel geometry, ventilation system capacity, traffic pattern (uni- or bi-directional) and meteorological conditions (wind speed and stack effects).
While the “piston effect” of moving vehicles can contribute positively to the removal of smoke in one-way road tunnels, its effect lessens as the tunnel cross-section area increases. Moreover, it is a common assumption to ignore the piston effect in case of a fire since the traffic will probably come to a standstill. The “chimney effect” in tunnels with considerable slope becomes the driving force on the tunnel airflow, especially when the traffic is stopped. Meteorological parameters can also have an appreciable influence on the performance of ventilation systems, which must produce the required air velocity against the wind-induced airflow.
A study has been conducted at the National Research Council of Canada (NRC) to evaluate the performance of the EVS in the event of a fire. The study aims at improving the ventilation operation in order to allow safe evacuation and maximize intervention effectiveness. An
extensive literature review on vehicle tunnel ventilation for fire safety was completed[1].
In-situ fire tests were conducted using a clean-burning propane system that produces minimal smoke. Artificial smoke was added for visualization purposes. Temperature, optical smoke
density, and air speed were measured at several locations downstream and upstream of the fire[2,3].
All numerical simulations were carried out in the absence of traffic in the tunnel. It is assumed that the traffic downstream of the fire would be cleared shortly after the eruption of the fire. Thus, the supposition of no traffic in the tunnel would not affect the outcome of the numerical simulations with regards to smoke movement and control. However, the existence of traffic upstream of the fire would act as obstacles that may affect the movement of supplied airflow. This paper investigates, using numerical and experimental approaches, the effect of the meteorological parameters and tunnel slope on the performance of in-place EVS in a section of a road tunnel. The study recommends methods in order to improve life safety in the tunnel section.
1.1 Tunnel Geometry and Ventilation System
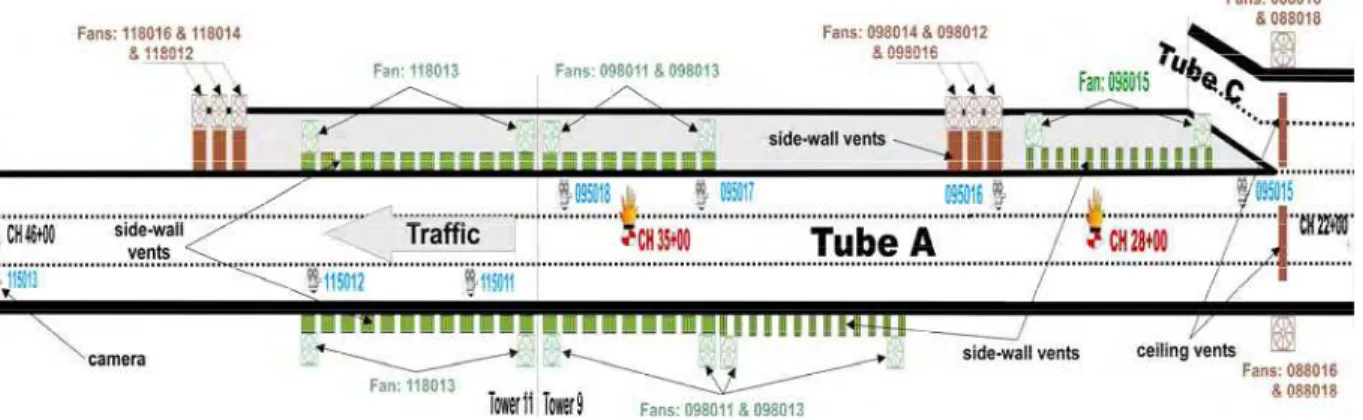
The road tunnel used in this study was constructed in 1974 and crosses the heart of the Montréal city downtown area over a 2.16 km length in an East-West direction. It is composed of two principal tubes, Tubes A and B, with one to five lanes each. The tunnel constitutes a major underground system from the point of view of circulation and structural complexity. It has five ventilation towers approximately 300 to 460 m apart with Tower 9 used as a control and monitoring centre for the tunnel.
The tunnel has several systems including traffic lights, pumping stations, emergency generators and the mechanical ventilation system (MVS). It involves a rather complex geometry with a different number of lanes, slope, natural ventilation (favouring or opposing smoke clearance), type of MVS (partial/semi-transversal or longitudinal), and cross-section height.
Distances along the tunnel are expressed in Chainages (CH) where: 1 CH = 100 ft = 30.48 m. The tested section is 732 m long and starts at CH 22+00 and extends up to CH 46+00 of Tube A (Figure 1). The traffic moves from East to West. The tested section has a width of 22 m (5 lanes) up to CH 23+00 after which its width is contracted to 12.8 m (3 lanes) up to CH 46+00. The height of the tested tunnel section is approximately 5.0 m. The investigated section is featured with a downward slope (5%) from East to West up to CH 38+00. The rest of the section has an upward slope (2.5%) from East to West.
Figure 1: Tested section of the road tunnel (plan view)
Table 1 shows the description of the MVS of the tested tunnel section. The MVS is a semi-transverse ventilation system composed of mainly sidewall vents with extraction ceiling points at CH 23+00. Fans 098012, 098014, 098016, 118012, 118014, and 118016 can only operate in the exhaust mode. The rest of the fans can operate in either supply or exhaust modes.
Table 1: Ventilation System
Fans Location and Description of Fan Vents
088016 & 088018 36 ceiling vents (1 m x 1 m)
098015 56 top sidewall vents (1 m x 0.5 m)
098012 & 098014 & 098016 3 sidewall vents (2 m x 3 m)
098011 & 098013 56 bottom sidewall vents (1 m x 0.5 m)
118013 51 bottom sidewall vents (1 m x 0.5 m)
118012 & 118014 & 118016 3 sidewall vents (2 m x 3 m)
2 EXPERIMENTAL WORK
2.1 Fire Tests
Four fire tests (Figure 2) were conducted in the tested section corresponding to two fire locations and four ventilation scenarios: “TST1SC1”, “TST1SC2”, “TST2SC1”, and “TST2SC2”. The fans activated and their modes of operation for each scenario are listed in Table 2. The two fire locations were at CH 28+00 and CH 35+00. The fire sizes for the four tests were approximately: 0.5, 1.0, 1.0, and 1.0 MW, respectively. These sizes were selected so as to minimize damage to the tunnel structure and different components and to produce reliable data for the validation of the numerical model. The objective was to limit the temperature at the ceiling below 100°C.
Figure 2: In-situ fire tests Table 2: Activated Ventilation Scenarios during Fire Tests
CH Ventilation Fan Mode
088016 & 088018 & 098015 Supply
TST1SC1
098012 & 098014 & 098016 Exhaust
088016 & 088018 Supply
28+00
TST1SC2
098015 & 098012 & 098014 & 098016 Exhaust
098011 & 098013 Supply
TST2SC1
118013 & 118012 & 118014 Exhaust
098015 Supply 35+00
098011 & 098013 & 118013 & 118012 & 118014 Exhaust
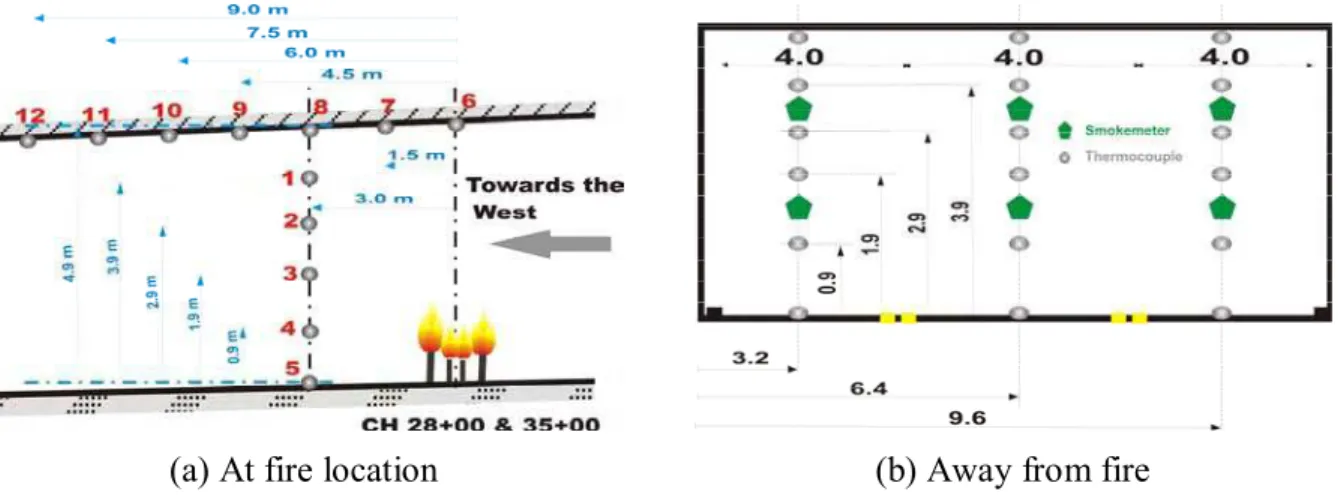
Six tw -person teams c moke nsity (SOD) measurements at 60 points of measurements at three locations: at the fire location, and at
ns, the
h an average speed of 1.5 m/s.
Figure 3: Ther SOD measurements
n tion scenarios, the airflow field was modified. For
TST1SC1, the airflow velocity was reduced to almost zero at the fire location. Activating
tilation. Natural airflow and tunnel floor slope
ys
o onducted the four tests and took temperature and s optical de
50 and 100 m downstream (DS) of the fire. Upstream (US) is defined in the context of this paper as the direction from which the traffic enters the tunnel (traffic moves from East to West).
At fire location, 12 thermocouples were used to measure the temperature along a vertical axis positioned at the centreline of the tunnel cross-section (Figure 3a). At the other two locatio
measurements were taken at three vertical axes located in the middle of the traffic lanes. The temperature was measured at 6 elevations along each vertical axis and the SOD at 2 elevations. Thus at each location, 24 measurements were taken (Figure 3b).
Airflow measurements were taken at different locations with and without the fire. The prevailing wind direction was West-East opposite to the traffic direction wit
(a) At fire location (b) Away from fire
mocouple trees and
2.2 Discussion of Experimental data
Upo activating the different ventila
TST1SC2 caused the airflow to reverse its direction at the fire location and to become in the direction of traffic flow. Meanwhile, airflow speed was reduced to a smaller value DS of the fire. For TST2SC1 and TST2SC2, the airflow reversed its direction (TST2SC1) or its speed was reduced to zero (TST2SC2) at the fire location.
The activated ventilation scenarios, modified the airflow field, but did not induce a large enough airflow to mitigate the effect of the natural ven
caused the smoke to travel mainly US of the fire. As a result, backlayering of smoke was observed during the four tests with different levels of intensity. The backlayering phenomenon is defined as the situation in which the smoke moves against the provided ventilation US of the fire creating an environment that poses a danger to both tunnel users and emergency responders. The maximum ceiling temperatures measured at the fire location were 137, 118, 142, and 45°C for TST1SC1 through TST2SC2, respectively. The maximum ceiling temperature alwa occurred at the fire centreline and decreased for location DS of the fire. It was observed that the plume was tilted towards US of the fire.
At the other two locations DS of the fire, the vertical temperature profiles of the four tests had a one-zone with ambient temperature. This indicated that the hot gases traveled mainly US of the fire for all tests as a result of the strong natural West-East wind and the downward slope.
The maximum measured SOD values at 50 m away from the fire were 0.062, 0.027, 0.020, and 0.018 optical density/m (OD/m) for the four tests, respectively. Except for Test 1, all these values were recorded at higher elevations indicating that smoke mainly traveled close to the ceiling. In TST1SC1, fan 098015 was activated in supply mode supplying fresh air from the side vents at the top of the north wall. As a result, smoke was forced downwards causing higher SOD values close to the tunnel floor. Activating fan 098015 in the exhaust mode (TST1SC2) resulted in much less SOD values DS of the fire.
At 100 m away from the fire, the maximum measured SOD values were 0.020, 0.023, 0.021, and 0.021 OD/m for the four tests, respectively. For all tests, the SOD values at that location were lower than those at 50 m, indicating that smoke did not travel far DS of the fire and was mainly exhausted by the large vents of Fans 098012, 098014, and 098016.
3 NUMERICAL SIMULATIONS
Computational Fluid Dynamics (CFD) models solve the complex differential equations describing the conservation of mass, momentum, enthalpy, species, etc. within the physical domain of interest. These models simulate the overall fire environment for a specific fire scenario including ambient conditions prior to a fire. The space and time dimensions are discretized into finite intervals and fluid variables such as temperature, velocity, gas composition and pressure are computed at a finite number of locations at the grid points as a function of time. A major difference between CFD models is how the viscosity used in the momentum equation is calculated. The majority of CFD models use turbulence models to approximate the turbulent energy and dissipation produced by the fire. This approach avoids the costly constraint of ensuring very fine grids, by using turbulence models and results in a solution to an averaged version of the flow equations. Another approach, the Large Eddy Simulation (LES), is to solve the large scales of motion and model the small scales that are assumed to be universal. The LES results in a transient solution to the actual Navier-Stockes equations. Because real turbulent flow situations are inherently transient, LES methods have an advantage in modelling turbulent fire-induced instantaneous flow fields. An example of the CFD-LES method is the Fire Dynamic
Simulator (FDS) model[4]. FDS solves a form of high-speed filtered Navier-Stocks equations
valid for a low-speed (low Mach number) buoyancy-driven flow.
In FDS, fire is represented using the “mixture fraction-based” combustion model in which large-scale convective and radiative transport phenomena are directly simulated and the physical processes occurring at small length and time scales are approximated. As such, the model does not simulate the actual combustion process in the fire and is based on the assumption that the reaction of fuel and oxygen is infinitely fast.
3.1 Fire Scenarios
The FDS code was used to simulate eight fire scenarios using a representative fire heat-release rate of 20 MW corresponding to a bus or truck on fire. The fire was modelled as an equivalent
gasoline pool[5] with an area of 8 m2 and with CO2, CO and smoke flow production rates of 1.5
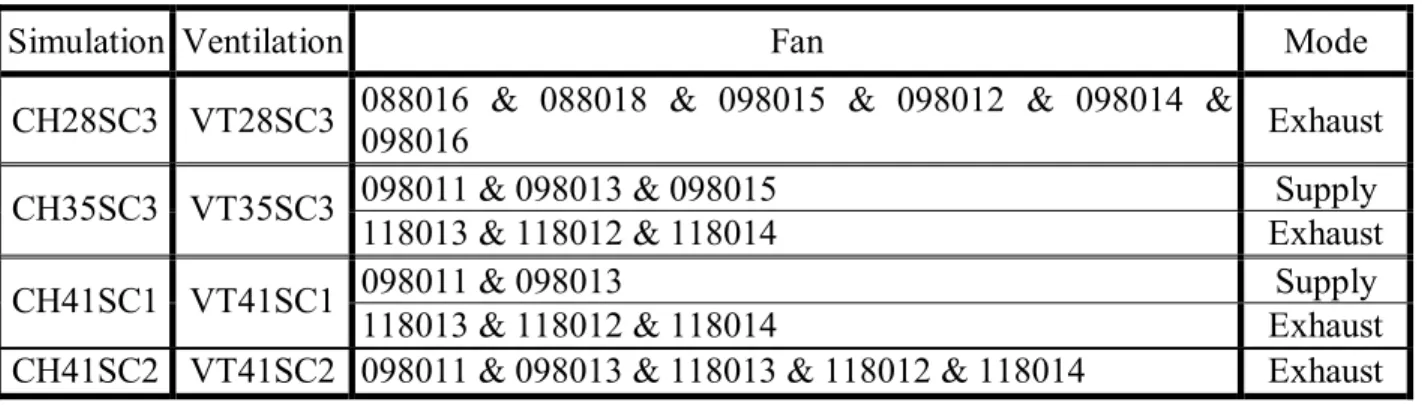
Eight simulations were conducted to help optimize the appropriate ventilation scenarios corresponding to the fire incident being placed at different locations within the tested section. Four of the eight simulations were replica for the four in-situ tests but for a fire size of 20 MW. For the simulations “CH28SC1”, “CH28SC2”, and “CH28SC3”, the fire was located at CH 28+00 and the three different ventilations TST1SC1, TST1SC2, and VT28SC3 were activated, respectively. Three simulations “CH35SC1”, “CH35SC2”, and “CH35SC3” corresponded to a fire at CH 35+00 and ventilations TST2SC1, TST2SC2, and VT35SC3, respectively. For the two simulations CH41SC1 and CH41SC2, the fire source was placed at CH 41+00 and two ventilations were activated, VT41SC1 and VT41SC2, respectively. Table 3 shows the fans and their mode of operation for VT28SC3, VT35SC3, VT41SC1 and VT41SC2. Table 3: Activated Ventilations for Fire Simulations
Simulation Ventilation Fan Mode
CH28SC3 VT28SC3 088016 & 088018 & 098015 & 098012 & 098014 &
098016 Exhaust
098011 & 098013 & 098015 Supply
CH35SC3 VT35SC3
118013 & 118012 & 118014 Exhaust
098011 & 098013 Supply
CH41SC1 VT41SC1
118013 & 118012 & 118014 Exhaust
CH41SC2 VT41SC2 098011 & 098013 & 118013 & 118012 & 118014 Exhaust
3.2 Geometry and Boundary Conditions
The modelled section is shown in Figures 1 and 4. It extends from CH 22+00 (0 m) to CH 46+00 (732 m) with a portion of Tube C being modelled. The boundary conditions at CH 22+00 and end Tube C were assumed to be at atmospheric pressure (as was observed in the field tests). At CH 46+00, a uniform inward airflow velocity of 1.5 m/s was assumed to reflect the natural airflow. Ventilation vents and slope were introduced in the numerical model to mimic the actual geometry of the modelled tunnel section.
Figure 4: Modelled section
3.3 Discussion of Simulated Cases
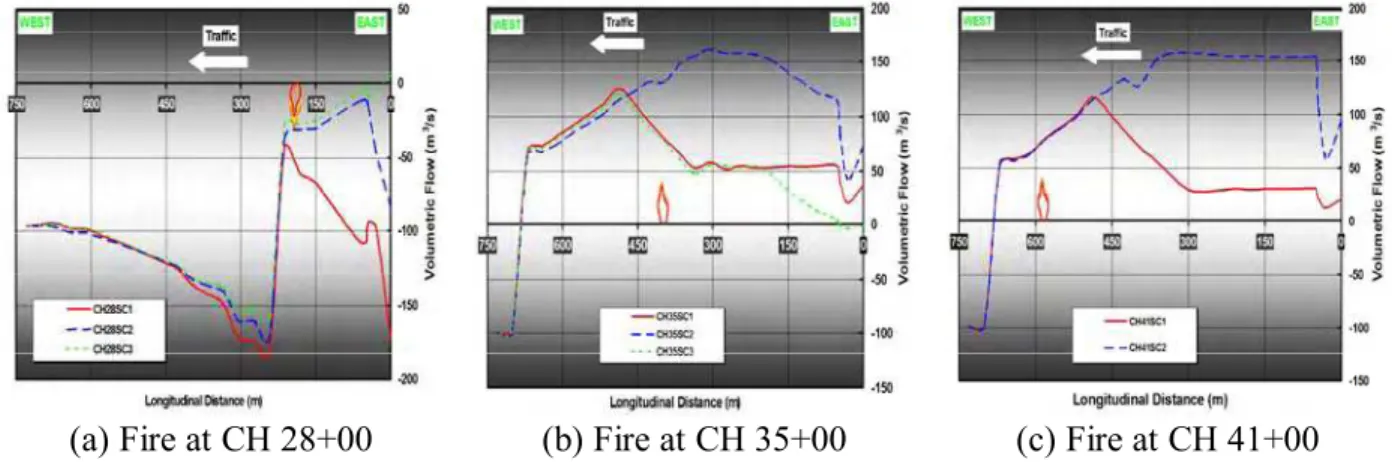
Figure 5 shows the resulting average values of the volumetric airflow for all the simulations. At each cross-section of the tunnel section, volumetric airflow values were averaged to produce one
value that represented the whole cross-section. Positive values indicate airflow from East to West.
Figure 5a shows very similar airflow DS of the fire for CH28SC1, CH28SC2, and CH28SC3. CH28SC2 modified the airflow US of the fire allowing for better control of backlayering than in the case of CH28SC1. CH28SC3 further reduced backlayering by reducing the negative airflow. Moreover, activating Fans 088016 and 088018 in the exhaust mode attracted fresh air from the East end.
(a) Fire at CH 28+00 (b) Fire at CH 35+00 (c) Fire at CH 41+00
Figure 5: Airflow along the tunnel section for different fire scenarios
Figure 6 shows the smoke progression with time from ignition for CH28SC1, CH28SC2 and CH28SC3. For CH28SC1 (Figure 6a), in 90 s smoke moved about 200 m US of the fire. It took longer periods (138 s and 180 s) to arrive at the same position for CH28SC2 and CH28SC3, respectively. For all of the simulations, smoke mainly traveled US of the fire and was limited to travel up to a 100 m DS of the fire.
(a) CH28SC1 (b) CH28SC2 (c) CH28SC13
Figure 6: Smoke movement along the tunnel section – Fire at CH 28+00
Figure 7a shows the resulting average visibility at the steady-state (1200 s from ignition) for CH28SC1, CH28SC2 and CH28SC3. At each cross-section of the tunnel section, visibility values were averaged to produce one value that represented the whole cross-section. Backlayering occurred for all scenarios. Upstream of the fire, the visibility was reduced to an
average value of 2 m. Removal of smoke was more efficient in CH28SC2 and CH28SC3 than in CH28SC1. In CH28SC1, the air supplied through the upper sidewall vents of Fan 098015 forced the smoke down. At about 175 m US of the fire, the visibility improved in the case of CH28SC3 indicating the efficiency of activating ceiling fans 088016 and 088018 in the exhaust mode.
(a) Fire at CH 28+00 (b) Fire at CH 35+00 (c) Fire at CH 41+00
Figure 7: Visibility along the tunnel section
The airflow patterns of CH35SC1, CH35SC2 and CH35SC3 (Figure 5b) are quite different US of the fire. The VESC TST2SC2 induced positive airflow US of the fire pushing the smoke and fire products DS of the fire.
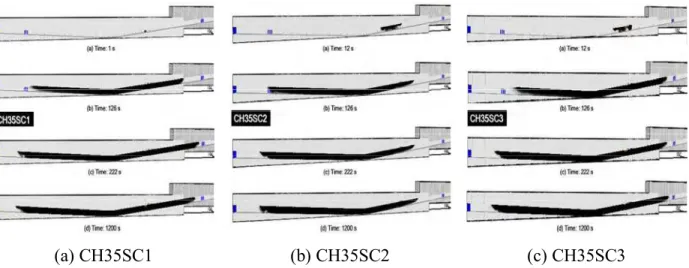
Figure 8 shows the smoke progression for CH35SC1, CH35SC2 and CH35SC3. For CH35SC1 and CH35SC3 and at 222 s, smoke traveled about 150 m US of the fire. In the case of CH35SC2, the backlayering was restricted to a distance of less than a 100 m.
Figure 7b shows the average visibility at 1200 s from ignition for FISCs CH35SC1, CH35SC2 and CH35SC3. The figure indicates that the backlayering phenomenon occurred for all FISCs. For FISCs CH35SC1 and CH35SC3, the visibility was significantly reduced to less than 3 m US of the fire. In case of FISC CH35SC2, the visibility was regained at a distance less than 50 m US of the fire.
(a) CH35SC1 (b) CH35SC2 (c) CH35SC3
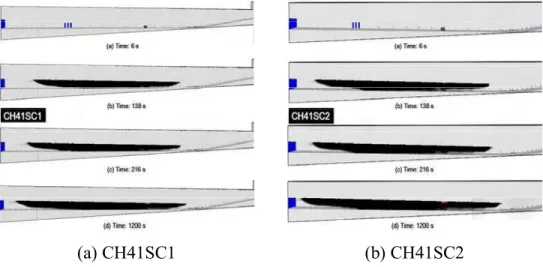
Figure 5c shows the volumetric flow for both FISCs CH41SC1 and CH41SC2. The airflow patterns are quite similar in the vicinity of the fire. However, at a distance of more than 100 m US of the fire, the airflow patterns become quite different. The VESC VE41SC2 induced positive airflow US of the fire pushing the smoke and fire products DS of the fire.
Figure 9 shows the smoke time progression for FISCs CH41SC1 and CH41SC2. At 138 s, backlayering extended about 70 m for both simulations and was maintained at that position for the rest of the simulation period.
(a) CH41SC1 (b) CH41SC2
Figure 9: Smoke movement along the tunnel section – Fire at CH 41+00
Figure 7c shows the visibility at the steady-state for CH41SC1 and CH41SC2. The visibility was quite similar for both simulations. The visibility was significantly reduced to less than 3 m US of the fire. At a distance of 50 m US of the fire, the visibility was regained.
4 CONCLUSIONS AND RECOMMENDATIONS
The prevailing wind direction and tunnel floor slope in the investigated section present significant challenges for the efficient removal of smoke and fire products. They result in the tendency of the smoke to travel mainly US of the fire rendering this portion of the tunnel untenable and hindering the evacuation process.
The large size exhaust vents (e.g. sidewall vents of fans 098012 and 118012) have a much more significant effect on modifying the airflow field than the small size vents (e.g. sidewall vents of fans 098015 and 118013). The effect of the small vents is mainly a localized one. Fans with vents located at the top of walls or at the ceiling should be operated in the exhaust mode to efficiently remove the buoyant smoke. On the other hand, fans with vents located at the bottom of the walls should be activated in the supply mode. In this case, the supplied fresh air will not disturb the buoyant smoke layer.
For a fire located between CH 23+00 and CH 33+00, the extraction of smoke by the upper sidewall vents of Fan 098015 is more efficient in removing smoke than activating this fan in a supply mode. In addition, activating the ceiling fans 088016 and 088018 in exhaust mode
improved the visibility conditions US of the fire. However, the extraction of smoke in this case was not sufficient to eliminate the backlayering phenomenon.
For a fire located between CH 33+00 and CH 41+00, it is recommended to activate VESC TST2SC2. VESC VT41SC2 is recommended if the fire is located between CH 41+00 and CH 43+00
In this stretch of the tunnel, the floor slopes downwards in an east-west direction and the natural wind velocity is about 1.5 m/s. It is important to create airflow in the East-West direction, sufficient to overcome the natural wind and the buoyant smoke and hot gases ascending the tunnel slope. Installing jet fans can create this airflow. Alternatively, the smoke may be extracted at the ceiling level through a duct system constructed at the ceiling. Until a decision has been made regarding the suggested modifications, it is recommended to activate ventilation scenario VT28SC3.
5 REFERENCES
1. Kashef, A.; Bénichou, N.; Lougheed, G.D., “Numerical Modelling of Movement and Behaviour of Smoke Produced from Fires in the Ville-Marie and L.-H.-La Fontaine Tunnels: Literature Review,” Research Report, Institute for Research in Construction, National Research Council Canada, 141, pp. 66, Sep, 2003 (IRC-RR-141).
2. Kashef, A.; Bénichou, N.; Lougheed, G.D.; Debs, A. "Performance investigation of emergency ventilation strategies in a road tunnel," Tunnel Management International Journal, 8, (4), December, pp. 1-10, December 01, 2005.
3. Kashef, A.; Bénichou, N.; Debs, A. "Performance investigation of emergency ventilation strategies in a new section of a road tunnel," Tunnel Management International Journal, 9, (2), June, pp. 1-6, June 01, 2006.
4. K.B. McGrattan, H.R. Baum, R.G. Rehm, G.P. Forney, J.E. Floyd, and S. Hostikka., “Fire Dynamics Simulator (Version 2), Technical Reference Guide,” Technical Report NISTIR 6783, National Institute of Standards and Technology, Gaithersburg, Maryland, August 2001. 5. National Fire Protection Association, “NFPA 502 Standard for Road Tunnels, Bridges, and
Other Limited Access Highways,” 2001 Edition, NFPA, Quincy, MA. ACKNOWLEDGEMENTS
The authors acknowledge the NRC’s researchers, Dr. Noureddine Benichou and Dr. Gary Lougheed, and technical staff, Mr. George Crampton and Mr. Don Carpenter, who contributed immensely to conducting the successful in-situ tests.