Supplementary Material
1. RAY209 canola root-attachment assayTo confirm the colonization of roots by RAY209, sterilized canola seeds were individually placed in polystyrene culture tubes (Fisherbrand) containing 10 mL of 0.4% water agar (day 0). Seeds were inoculated with 1.0 ´ 107 CFU of RAY209 per seed and grown in a phytotron
(Conviron PGR15) with a day/night cycle of 16/8 h and 22/18°C. On day 24, roots were examined for turbidity (indicating colonization) (Figure S1A-B). Roots were then harvested, washed twice with 20 mL of sterile water, vortexed for 30 sec, placed on TSA plates, and incubated for 48 h at 28°C to observe root-associated RAY209 growth (Figure S1C-D).
Figure S1. Canola root colonization by Delftia acidovorans RAY209. (A) and (C) = control (uninoculated); (B) and (D) = RAY209 inoculation. Comparison of A and B demonstrates an increase in turbidity surrounding the developing root after 24 days with RAY209 inoculation (red box). Comparison of C and D demonstrates the strength of RAY209 colonization on primary and secondary roots after 24 days.
2. Plant growth-promoting behaviour of RAY209
To monitor the effect of Delftia acidovorans RAY209 on root development, canola seeds were surface sterilized by submerging in 2% NaClO for 5 min and rinsed with sterile water several times. Three seeds were placed in CYG germination pouches (Mega International, Newport, MN) with 0.5´ Hoagland’s Solution (Sigma-Aldrich) and inoculated with 1.0 ´ 105 CFU of RAY209
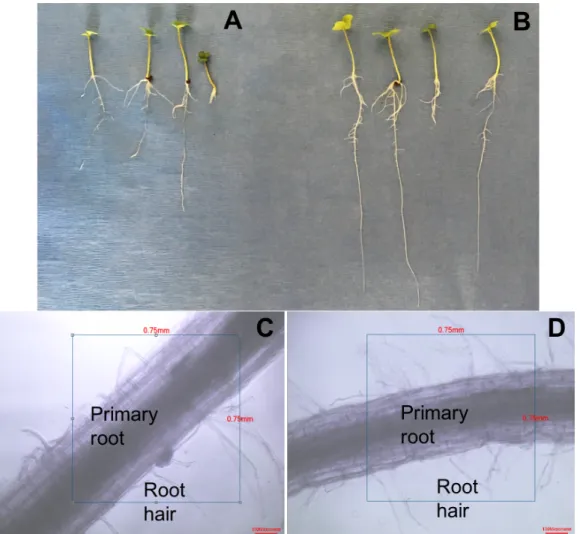
15 and the number of lateral roots counted, and root/shoot lengths measured and weighed (Table S1). Prior to weighing, root/shoot material was dried at 37 °C for 4 days. The number of root hairs on developing primary roots with and without RAY209 inoculation was examined after 36 days by submerging roots in water and observing at 100´ magnification (Figure S2C-D).
Figure S2. Effect of Delftia acidovorans RAY209 on canola root development. (A) and (C) = control (uninoculated); (B) and (D) = RAY209 inoculation. A and B compare differences in root length between treatments. Comparison of C and D demonstrates an increase in number of root hairs on developing primary root with RAY209 inoculation (D) after 36 days. Roots were submerged in water and observed at 100´ magnification. Scale bars = 100 µm.
Table S1. Effect of Delftia acidovorans RAY209 on canola root development at day 15.
Results are expressed as mean ± standard deviation (n=12 for each treatment). Different letters indicate a significant difference among treatments (p < 0.05).
3. Hydroponic growth system
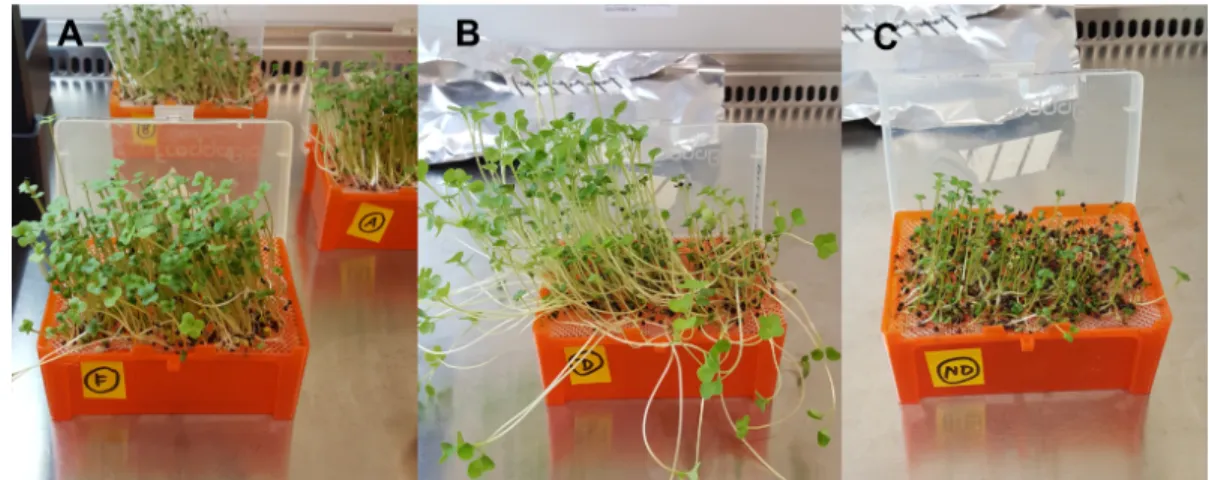
Figure S3. Experimental growth system of canola plants. (A) RAY209-inoculated plants at day 2; (B) RAY209-inoculated plants at day 7; (C) uninoculated plants at day 7.
Control RAY209 Dry root weight (mg) 6.3 ± 0.9 a 7.6 ± 1.5 b Dry shoot weight (mg) 17.7 ± 4.6 a 23.3 ± 3.4 b # of lateral roots 71.9 ± 24.5 a 88.7 ± 12.9 b Root length (cm) 22.9 ± 5.0 a 23.6 ± 3.2 a Shoot length (cm) 6.6 ± 1.1 a 7.2 ± 0.6 a
Figure S4. Experimental growth system of soybean plants. (A) RAY209-inoculated plants at day 2; (B) RAY209-inoculated plants at day 7; (C) uninoculated plants at day 7.
4. Validating strongly root-attached RAY209 isolation strategies from canola roots
Canola roots were harvested and plated as previously described in Materials and Methods. Homogenization and low-intensity sonication were tested for the ability to release root-attached RAY209 while preserving cell viability (Figure S5). A subset of processed roots (as previously described in main text) were weighed and submerged in 500 µL PBS, then bath-sonicated using the Low power setting of a Bioruptor Standard UCD-200 (Diagenode) for 5 min, alternating 30 sec on/off [1]. Cell counts were obtained as previously described.
Figure S5. Validation of method for releasing root-attached RAY209 cells from canola roots. Low-intensity sonication (grey) and homogenization (black) methods were tested for the ability to release root-attached RAY209 cells from the root surface. Sonication was ineffective, as mean cell counts did not differ significantly between days 2 and 7 (ptwo tail = 0.70). Homogenization was
sufficiently effective, as a significant log10-fold increase in mean root-attached RAY209 cells was
observed (pone tail = 0.03); n = 3 replicates.
5. RNA-seq experimental outcome
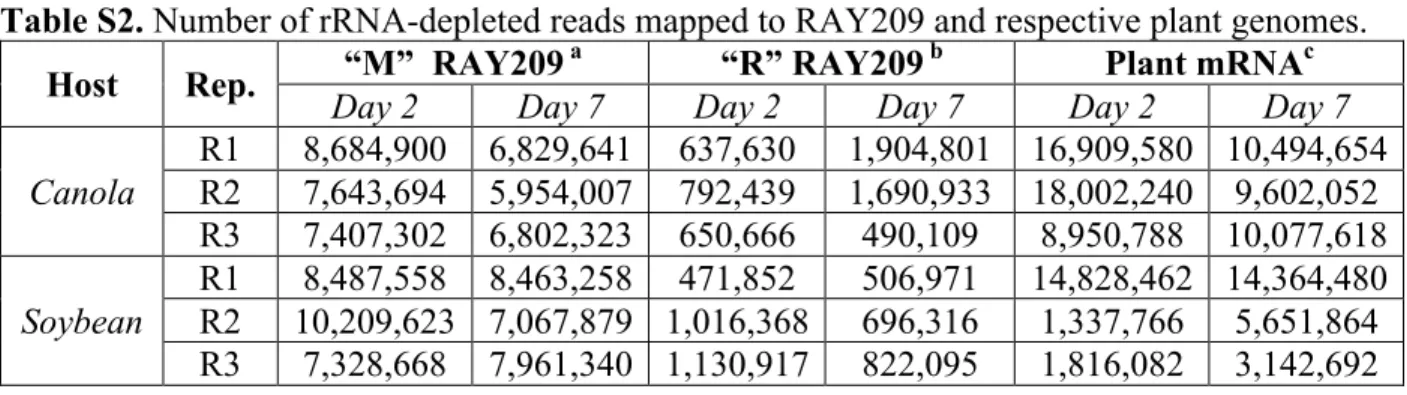
Table S2. Number of rRNA-depleted reads mapped to RAY209 and respective plant genomes. Host Rep. “M” RAY209
a “R” RAY209 b Plant mRNAc
Day 2 Day 7 Day 2 Day 7 Day 2 Day 7
Canola R1 8,684,900 6,829,641 637,630 1,904,801 16,909,580 10,494,654 R2 7,643,694 5,954,007 792,439 1,690,933 18,002,240 9,602,052 R3 7,407,302 6,802,323 650,666 490,109 8,950,788 10,077,618 Soybean R1 8,487,558 8,463,258 471,852 506,971 14,828,462 14,364,480 R2 10,209,623 7,067,879 1,016,368 696,316 1,337,766 5,651,864 R3 7,328,668 7,961,340 1,130,917 822,095 1,816,082 3,142,692
a Reads from medium-suspended (“M”) mRNA samples; b Reads from root-attached (“R”)
mRNA samples; c Reads mapped to respective plant genomes from root-attached (“R”) mRNA samples.
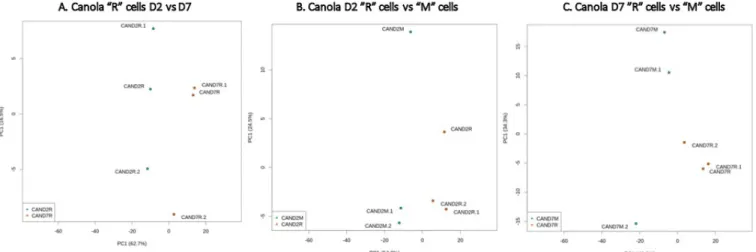
Figure S6. PCA plot of RAY209-canola expression profiles (DESeq2 regularized log transformations of count data). Comparisons of samples made are described in headings (A – C). D2 = day 2 and D7 = day 7; “M” = medium-suspended samples and “R” = root-attached samples.
Figure S7. PCA plot of RAY209-soybean expression profiles (DESeq2 regularized log transformations of count data). Comparisons of samples made are described in headings (A – C). D2 = day 2 and D7 = day 7; “M” = medium-suspended samples and “R” = root-attached samples.
for 3 min and rinsed with sterile water. Care was taken to not disturb the liquid growth medium during data collection.
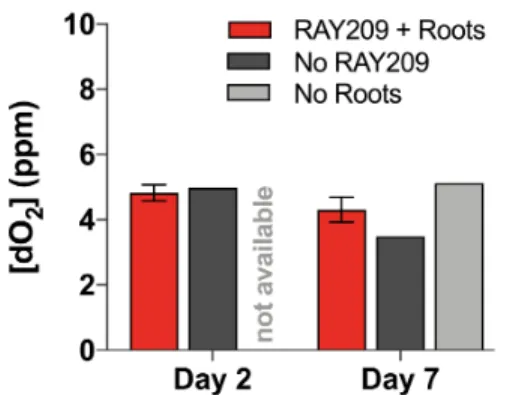
Figure S8. Average dissolved oxygen concentration around canola roots. Dissolved oxygen (dO2) at the roots remained consistent (ptwo tail = 0.12) throughout the week-long growth period,
averaging 4.8 ppm at day 2 and 4.3 ppm by day 7 (n = 3 replicates). 6. References
1. Richter-Heitmann T, Eickhorst T, Knauth S, Friedrich MW, Schmidt H. Evaluation of strategies to separate root-associated microbial communities: a crucial choice in rhizobiome research. Front Microbiol 2016;7:773.