HAL Id: hal-01461271
https://hal.archives-ouvertes.fr/hal-01461271
Submitted on 3 Feb 2021
HAL is a multi-disciplinary open access
archive for the deposit and dissemination of
sci-entific research documents, whether they are
pub-lished or not. The documents may come from
teaching and research institutions in France or
abroad, or from public or private research centers.
L’archive ouverte pluridisciplinaire HAL, est
destinée au dépôt et à la diffusion de documents
scientifiques de niveau recherche, publiés ou non,
émanant des établissements d’enseignement et de
recherche français ou étrangers, des laboratoires
publics ou privés.
The formation of Pliocene sapropels and carbonate
cycles in the Mediterranean: diagenesis, dilution, and
productivity
Bjh van Os, Lj Lourens, Fj Hilgen, Gj de Lange, L Beaufort
To cite this version:
Bjh van Os, Lj Lourens, Fj Hilgen, Gj de Lange, L Beaufort. The formation of Pliocene sapropels
and carbonate cycles in the Mediterranean: diagenesis, dilution, and productivity. Paleoceanography,
American Geophysical Union, 1994, 9 (4), pp.601–617. �hal-01461271�
PALEOCEANOGRAPHY,
VOL. 9, NO. 4, PAGES 601-617, AUGUST 1994
The Formation of Pliocene sapropels and carbonate cycles
in the Mediterranean: Diagenesis,
dilution, and productivity
B.J.H. Van Os,
• L.J. Lourens,
F.J. Hilgen, and G.J. De Lange
Department of Geochemistry and Geology, Institute of Earth Sciences, Utrecht, Netherlands L. Beaufort
Laboratoh'e de Geologie du Quaternaire, Centre National de la Recherche Scientifique, Marseille, France
Abstract. High-resolution micropaleontological (planktonic foraminifera and calcareous
nannofossils) and geochemical (stable isotopes, org,'mic carbon, Fe, P, S, Ca, Ba, Mn, and
A1) records are presented for the first sapropel-containing carbonate cycle in the Pliocene
of Sicily. The carbonate cycle is characterized by a gray to white to beige to white color
layering typical of the marls of the Trubi formation. A faintly laminated sapropel is
intercalated in the gray-colored bed of the carbonate cycle. CaCO 3 content varies from
40% in the beige to 45-50% in the white layers. Lowest CaCO3 content of 25-30% is found in the gray layer and sapropel. Variations in carbonate ,'red organic matter per- centages c,'m best be explained by changes in palcoproductivity rather than by variations in dilution and dissolution. Total productivity was highest during deposition of the gray layer and sapropel, as indicated by high organic carbon and Ba contents and high
abundance of Globorotalia puncticulata. Carbonate production reached its highest values,
however, during deposition of the white layers, as evidenced by enhanced abundances of
planktonic foralninifera ,'red nannofossils. The low carbonate content in the gray layer and
sapropel is explained in terlns of a collapse in carbonate production caused by extreme changes in the physical and biochemical properties of the water column, which in turn
resulted in siliceous plankton and opportunistic foraminifers such as Globorotalia
puncticulata outcompeting most calcareous organisms. The beige layer represents a low-
productivity environment silnilar to the present-day eastern Mediterranean basin. Several
mech,'misms have previously been proposed to explain variations in productivity in the
eastern Mediterr,'mean. Both sapropels and gray layers were deposited at times when
perihelion occurred in northern hemisphere summer. We envisage that the increase in seasonal contrast resulting from this orbital configuration enhanced winter mixing and
stabilization of fl•e water colunln during SUlmner, both leading to favorable conditions for
intensification of the spring bloom. In addition, a decrease in excess evaporation, as can
be deduced
from fl•e b•sO
record,
led to shoaling
of the pycnocline
and reduced
cir-
culation, thus enhancing the availability of nutrients in the photic zone. Finally, enhanced
precipitation and associated runoff should have caused an increase in river-borne nutrients.
Introduction
The late Pleistocene sedimentary record of the eastem Mediterranean is known to contain distinct layers with elevated organic carbon content [Cita et al., 1977; Kidd et al.,
1978]. These "sapropels", interbedded in hemipelagic
sediments,
have many characteristics
(e.g., high Cor•,
Fe, S,
and trace metals) [e.g., Calvert, 1983; Pruysers et al., 1993]
INow at Geological Survey, tharlem, Netherlands.
Copyright 1994 by the American Geophysical Union.
Paper number 94PA00597. 08 83-8305/94/94PA-00597510.00
in common
with organic-rich
black
shales,
such
as those
from
the Cretaceous.
Sapropel
occurrences
are cyclic and correspond
closely
with minima in the precession index when perihelion occurred
in northern
hemisphere
summer
[Rossignol-Strick,
1983,
1985;
Prell and Kutzbach, 1987; Hilgen, 1991a]. Sapropels are not
only found
in the upper
Pleistocene,
but they
occur
frequently
and are widespread in marine sequences throughout the
Mediterranean
Neogene
and
Quaternary
[c.f. Olausson,
1961;
Cita et al., 1977; Shaw and Evans, 1984; Chamley et al.,
1986; Howell et al., 1988; Sprovieri et al., 1986; De Visser et
al., 1989; Emeis et al., 1991; Hilgen, 1991a, b; Rio et al.,
1991; Tltunell et al., 1991 ].
Much work has been done to explain the formation of the
602 VAN OS ET AL.' SAPROPEL FORMATION
et al., 1982; Rossignol-Strick et al., 1985; Thunell and
Williams,
1989; Rohling
and Gieskes,
1989; Calvert et al.,
1992].
An increase
in freshwater
input
could
have
resulted
in
the development
of a low-salinity
surface
layer
which,
in turn,
reduced deepwater circulation. This limited the amount of
oxygen in the deeper part of the water column and could
eventually have led to anoxic bottom water conditions and
enhanced preservation of organic matter [Olausson, 1961;
Cita et al., 1977; Nolet and Corliss, 1990]. Increased runoff
from the river Nile during
peaks
of monsoonal
precipitation
on northern Africa [Rossignol-Strick et al., 1982] or from the
northern
borderlands
of the Mediterranean
[Rossignol-Strick,
1987;
Rohling
and
Hilgen,
1991]
is thought
to have
triggered
the formation
of the youngest
sapropel.
Evidence
for a low-
salinity
layer is given by b•80 depletions
in planktonic
foraminiferal
shells
within sapropels,
which
would
be related
to the
b•80
signature
of freshwater
input
[Vet•naud-Grazzini
et al., 1977; Gudjonsson and van der Zwaan, 1985; Timnell
and Williams,
1989;
Tang
and Stott,
1993].
Alternatively,
an
increase in nutrients may have caused enhanced marine
production
and associated
flux of organic matter to the
seafloor [Calvert, 1983; Calvert et al., 1992]. The most
extreme hypothesis suggests that excess runoff and precipitation over evaporation caused a reversal of the water circulation in the (eastern) Mediterranean [Calvert, 1983; Sarmiento et al., 1988; Tllunell and Williams, 1989]. Such a
reversed (estuarine) circulation would act as a nutrient trap,
leading to enhanced productivity and consequent sapropel
formation [De Lange and Ten Hca, en, 1983; Thunell and
Williams, 1989; Calvert et al., 1992]. Rohling and Gieskes [1989] combined decreased deepwater formation with
enhanced primary production. Their scenario suggests that a
decrease in excess evaporation over precipitation and runoff
caused shoaling of the pycnocline (and nutricline) into the
euphotic zone. This led to the developement of a distinct deep
chlorophyll maximum and enhanced marine production. A
consequence
of this model
is that the b•SO
depletions
in
sapropels are related to reduced inflow of western Mediter-
ranean water and decreased excess evaporation rather than
enhanced river water input [Van Os and Rohling, 1993].
Most scenarios for sapropel formation are based on upper
Pleistocene sapropels but have subsequently been applied to
iN Tyrrhenian
Sea
Sea
__.
o SICILIAN TRUBI o
a-grey b,d-white c-beige rnarl$
a ) /5 c b d
2 c
(
dCapo
Rossella
Punta
di
Maiat'•
•
•
'••••/
Punta
Piccola
0 500m
• Punta Grande
Figure 1. Location map and schematized lithology of carbonate cycle 101/102 (numbering quadruplet cycles
VAN OS ET AL.: SAPROPEL FORMATION 603
lower Pleistocene and Pliocene sapropels and lanfinites [e.g.,
Gudjonsson
and van der Zwaan, 1985; Sprovieri
et al., 1986;
Rio et al., 1991; De Visser et al., 1989; Thunell et al., 1991 ]. The Pliocene of the Mediterranean also contains distinctive
CaCO 3 cycles [Hilgen, 1987; Gudjonsson, 1987; De Visser et
al., 1989; Tlumell et al., 1991], which are attributed to a
combination of productivity variations and dilution by
enhanced terrigenous input. •us far, the relation between
sapropels and these carbonate cycles has received little
attention, although sapropels often occur in certain parts of
the carbonate cycles.
The main objective of this study is to elucidate the
dominant processes leading to the formation of the Pliocene
carbonate cycles and their intercalated sapropels. Perhaps the
most suitable sediments lbr this task are the marly outcrops of the Pliocene Trubi and Monte Narbone formations on
Sicily, which show cyclic enrichment in organic matter and
carbonate. The Trubi marls display a distinct white to gray to
white to beige
color layering,
with the gray and beige
marls
being
less
indurated
and CaCO
3 poor
(Figure
1). In addition,
the gray layers
are slightly
enriched
in Co•8
(0.1-0.2%)
[De
Visser et al., 1989]. The first Pliocene, brownish-colored,
laminated,
sapropels
start to occur in the basal part of the
overlying
Monte Narbone
tbrmation.
These
sapropels
occur
within or completely substitute the gray layers of the car-
bonate
cycles
[Hilgen,
1987].
We performed
a high-resolution
geochemical
and
micropaleontological
study
on the carbonate
cycle that contains the first sapropel.
Material and Methods
Geological Setting
Samples
were taken from carbonate
cycle 101/102 [see
Hilgen, 1991b] in the lower part of the Monte Narbone
formation in the Punta Piccola section near Porto Elnpedocle,
southern Sicily (Figure 1). The gray layer of this cycle
contains a faintly laminated sapropel, which is dated
astronomically
at 3.07 Ma [Hilgen, 1991b]. The sediments
have
been
deposited
at a water
depth
of 400-800
m [Brolsma,
1978] with an average sediment accumulation rate of 4.2 cm
kyr
'• [Hilgen,
1991b].
This accumulation
rate was
determined
by dividing
the total
thickmess
of this
carbonate
cycle
(= 92
cm) by the average
period
of a precession
cycle
(*_21.7
kyr).
Sampling
Considerable effort was taken to remove the weathered
surface to expose the fresh sediment. After that, a 70-cm-high
polygon block, weighing about 120 kg, was carefully ex-
cavated and placed in polyethylene bags that were sealed to
prevent dehydration. Back in the laboratory, the block was
stored at 4øC to prevent further dehydration. •lhe block was dry-sawed into 3-cm-thick slabs perpendicular to the bedding
plane. Fresh colors reappeared on the freshly sawed sides,
thus facilitating the description of the lithology in detail. For
the gray layer and the intercalated sapropel, fresh colors were
dominantly dark green and green. The /¾esh colors of the
beige and white layers were dark blue and light green to blue,
respectively. To minimize contamination, 5 mm were scraped
off the slab bet'ore taking the samples. Sampling was started
immediately after sawing; the samples, consisting of 0.5- to
1-cm-thick fragments, were taken carefully with a stainless steel spatula parallel to the bedding plane. For geochemical
purposes, the samples were stored at 4øC until analyses at the
laboratory. Cores with a diameter of slightly less than 1 cm
were drilled into the slabs at the same levels as the
geochemical samples. This provided us with a fixed volume, necessary to calculate the amount of calcareous fossils per
cubic centimeter of sediment.
Chemical Analyses
The samples were dried at 105øC for 24 hours and thoroughly ground in an agate mortar mill prior to a HC10 4, HNO3, and HF acid digestion. The final residue was taken up
in 1 M of HC1. The elements Fe, P, S, Ca, Ba, Mn, A1, and
various trace metals were measured with an inductively
coupled plasma emission spectrolneter (ARL 34000). The
analytical precision and accuracy of the measured values were
both found to be better than 3% for all elements; this was
checked by making use of an international (SO-1) and a house standard (MM-82) and by analyzing replicate samples, respectively.
Organic
Carbon
and b13Corg
The measurements
of Co•8
and b13C
in carbonate-rich
samples require that prior to the analyses, all carbonate should
be removed. About 1 g of sample was weighed into a
centrifuge tube. The carbonate was extracted by mechanical
shaking with 6N HC1 for 12 hours. Hydrochloric acid, rather
than acetate acid or phosphoric acid must be used to assure
complete removal of carbonate phases such as dolomite. To
avoid overpressure, the centrifuge tubes were carefully
&gassed during the first hour of the procedure. After extrac-
tion, the samples were rinsed with demineralized water in
order to remove CaC12 and were subsequently dried. From the extracted fluids, the (dissolved) organic carbon content was determined. The results showed that the organic carbon loss due to the carbonate extraction was negligible. Organic carbon was determined volumetrically following dry oxidation with CuO at 900øC in a closed circulation system at 0.2 atm
oxygen. The released CO2 gas was cryogenically separated
from the other
gases.
The •5•3C
was measured
with a VG
SIRA 24 mass spectrometer with a precision better than
0.1%o. Each sample was measured in duplicate. The isotope
data are reported relative to the PeeDee belemnite standard.
SO,, and NO 2 gases, which could interfere with the carbon
content and isotopic measurelnents, respectively, were shown
to be absent using mass spectrometer scans.
The b•3Cc• and b•8Oc•b
In order to remove any organic remains, about 100
specimens of Globigerinoides ruber (10 mg) per sample were
roasted for 30 rain at 470 ø under a helium flow. After that,
the samples were transferred into glass reaction tubes that
were evacuated for 14 hours. This was followed by 6 hours
of reaction with 100% phosphoric acid at 25.0øC under high
vacuum. The released CO2 was cryogenically separated from
the other gases and measured on a VG SIRA 24 mass
spectrometer. Data are reported as per rail relative to the PDB
standard. Replicate analyses and repetitive analyses of the
laboratory
standard
showed
a standard
deviation
of <0.1%,>
for
604 VAN OS ET AL.: SAPROPEL FORMATION Calcareous and Silicious Fossils
Foraminiferal counts were made on splits (using an Otto microsplitter) from the 125- to 595-pm and 65- to 125-grn
fractions, and 200-500 specimens of the 125- to 595-prn
fraction were hand-picked, mounted on Chapman slides,
identified, and counted.
Calcareous nannofossil counts were made from slides
prepared through a settling method which allowed the estimation of the number of specimens per gram sediment. For each sample, a number of view fields were scanned until a total of 300 specimens were encountered.
Total calcareous fossil content (shells per cubic centimeter)
was determined for four different size fractions: (1) 125-595
grn (planktonic foraminifera), (2) 65-125 grn (planktonic
foraminifera), (3) 10-50 pm (calcareous dinoflagellates), and
(4) <10 grn (nannofossils). Dinoflagellate and nannofossil counts were made on every second sample.
Opal concentrations were determined in the sediment
according to the method of Demaster [1981]. The precision
of this method is better than 10% for values larger than 1% of opal.
Results
Geochemical Analyses
CaCO3
concentrations
are enhanced
in the white layers,
have intermediate values in the beige layers, and are lowest
in the gray layer and intercalated sapropel (Figures 2 and 3).
Because of the closed sum effect, CaCO3 varies inversely
with the other major phases in the sediment, such as
aluminosilicates. Phosphorous concentrations resenable the
pattern as displayed in the CaCO3 record. Organic carbon
concentrations are elevated in the gray layer and intercalated
sapropel, are low in the beige layers, and have intermediate
values in the white layers (Figure 3).
Iron and sulphur are both enriched in the gray layer. To
correct for terrigenous iron, the Fe/A1 ratio was computed,
which
shows
a good
correlation
(R2=
0.86) with sulphur.
The
molar Fe/S ratio of about 2 suggests that most iron and
sulphur
in the sapropel
are present
in the form of pyrite.
Although organic carbon and sulphur are both enriched in the
gray layer, no good correlation is found between organic
carbon and sulphur.
Barium is enriched in the gray layer (Figure 3) and
correlates
well with Cor•
(R2=0.89).
In the sapropel,
a small
decrease in Ba is observed where Mn (Figure 4) displays a
very prominent peak.
The elements Ti, A1, Zr, and Cr, which are contributed
mainly by the terrigenous
fraction,
are enriched
in the gray
and beige layers and are depleted in the white layers (Figure
5).
Stable Isotopes
The b•aO
record
of Globigerinoides
ruber
shows
a "bell-
shaped" profile, which is slightly asymmetric with respect to
the lithology.
Lowest
b180
values
(-2.5%o)
are reached
at the
base of the sapropel, while enrichments in b•80 are found in
the white layer (-0.5 %0)
below
the gray layer and in the beige
layer (+0.5%0) (Figure 3).
The bl3Co.
r,•r shows
a stepwise
decrease
at the white-gray
10-
E
...
o 20- (D - >Q)
30-
0 -CL 40-
-._u) 50-
_ 70-CaCO (%)
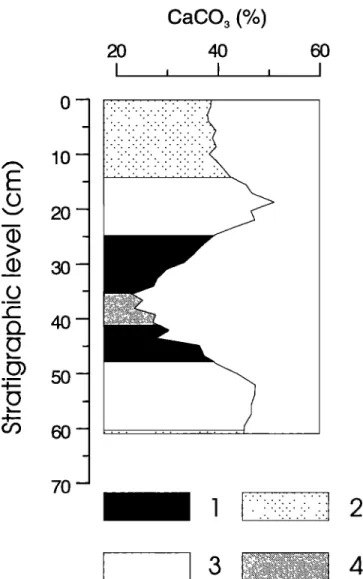
2O 4O I I , IFigure 2. Stratigraphic column of carbonate cycle 101/102:
1 = gray layer; 2 = beige layer; 3 = white layer; and 4 =
sapropel. Note that lithology shows close resemblance with the CaCO3 content.
boundary,
reaching
its lowest
b•3C
value (-0.25%o)
in the
lower
part
of sapropel.
The largest
enrichment
in 13C
(b•3C=
1.2%o) is found in the white layer that precedes the gray layer
(Figure 3).
The b•3Corg
values
vary
between
-22.5
and-24.5%o
(Figure
3). The largest
enrichment
in •3Co•
• is recorded
in the gray
layer and intercalated sapropel, whereas the most depleted
values occur in the white layers. Intermediate values
(b•3Co•g-
- -23%0)
are
recorded
in the
beige
layer.
Paleontological DataSixteen planktonic foraminiferal categories were counted
and their distributions are shown in Figure 68. Taxonomy of
planktonic foraminifers is after Lourens et al. [1992]. The
most conspicuous feature is the elevated percentages of
Globorotalia puncticulata in the gray layer and intercalated
sapropel.
The calcareous nannofossil assemblages have low diversity.
VAN OS ET AL.' SAPROPEL
FORMATION
605
0- lO - 40- O• CaGO 3 (%) P (ppm) 20 40 60403 600 I I(•13Corg
(%0)
800 -26.0 -24.0 -22.0 I I , I • Ishells >6• shells 10-5q• shells <lq•
Corg Ba, Babio(ppm)
0.0 0.5 1.0 15 0
•- (ppm
cm
4)
200 400 600 0 20 40
G puncticulsta
8180
G. ruber
813C
G.r/•er
70 m
0.0E+0 5.0E+4 1.0E+5 0E+0 2E+5 4E+5 0E+0 1E+7 2E+7 0 20 40 -2.0 -1.0 0.0 -0.5 0.0 0.5
Shells
cm
'3
Shells
cm
'3
Shells
cm
'•
% of shells
>125p
%0
%0
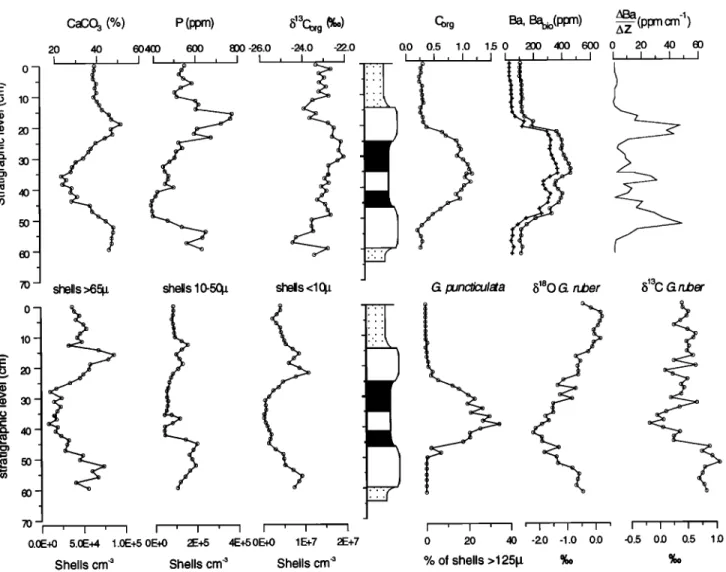
Figure
3. Variations
of
CaCO
3,
P,
b•3Corz,
Co,.v
Ba,
biological
bound
Ba,
Ba
derivative,
shell
content
> 65
pro,
shell
content
10-50
grn,
shell
content
< 10 gm
in species
per
cubic
centimeter,
percentage
G.
puncticulata
of shell
fraction
125-595
gm,
and
b180
and
•513C
of G.
ruber,
versus
stratigraphic
level.
shell ratio index
0- - 10- • - E • 20- _.e 3o- _(2 • 40- .? - • 50- 60- _ 70- I ' I ' 0.4 Mn Dbcoaster
Fe*
S
0.0
0.8 0
%
2
4 0
40
%
80
1.5 2.0 2.5 3.0 0.0 0.5 1.0
%
%
Figure
4. Comparison
of shell
fraction
ratio
(shell
fraction
> 10
lardshell
fraction
< 10
pm),
percentages
606 VAN OS ET AL.' SAPROPEL FORMATION i 10- 60- 70-
AI
Ti, Ti/AI
+ -•..Cr, Cr/AI
Zr, Zr/AI
ß 4-.+ .4 '•'•. +'4- '.+0.75 1.00 1.25 1.50 0.75 1.00 1.25 1.50
0.75 1.00 1.25 1.50 0.75 1.00 1.25
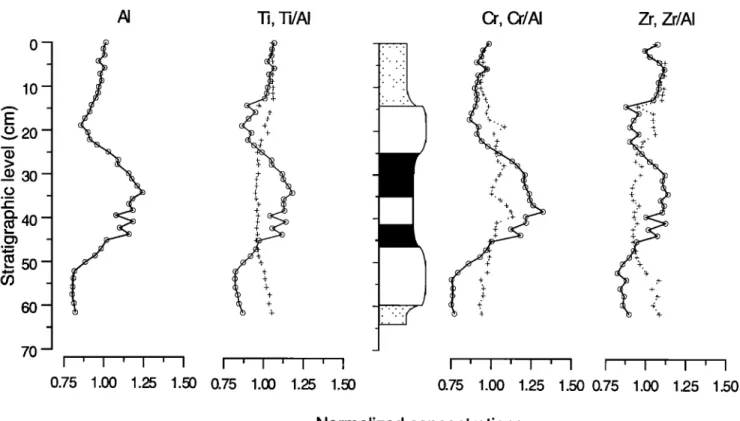
Normalized concentrationsFigure
5. Normalized
(divided
by their
average
values)
concentrations
of AI, Ti, Cr, and
Zr (circles)
and
normalized
Ti/A1,
Cr/A1,
and
Zr/A1
ratios
(pluses),
versus
stratigraphic
level.
I 1.50
the discoasters
are well preserved).
The assemblages
are
dominated by Retictdofenestra minutula and Coccolithus
pelagicus
in the gray and beige layers,
by discoasters
and
Calcidiscus
pelagicus
in the white layers,
and
by discoasters
in the sapropel (Figure 6b). This pattern is similar to that
found by Thunell et al. [1991] for the Trubi marls. At the
level of the sapropel, the abundance of coccoliths decreases
dramatically while the number of discoasters remains almost
constant,
resulting
in the relative
dominance
of this group
at
this level (Figures 4 and 6b).
The patterns displayed in the records of the total number of
calcareous
fossils
of the different
size fractions
are nearly
identical
to that displayed
in the CaCO3
record
but resemble
even more the P record
(Figure
3). In addition,
most
species
display
high abundances
in the white layers
and very low
abundances in the gray layer. Increased calcareous fossil
contents are recorded in the white layers, they are inter-
mediate
in the beige layer and low in the gray layer and
intercalated sapropel. Despite the lower calcareous fossil
content
in the planktonic
foraminiferal
association
>125 I.
un,
the sapropel
and gray layers
are characterized
by an increase
in Globorotalia
puncticulata
(Figures
3 and 6a), which
shows
a remarkable correlation with the organic carbon (R2=0.83)
and barium content (R2=0.67).
Discussion
Formation
of Carbonate
Cycles
and Sapropels
The most
conspicuous
feature
of the
carbonate
cycle
is the
strong variation
in carbonate
and organic
matter content.
Dilution
and
productivity
have
been
proposed
to explain
similar
variations
in Pliocene
carbonate
cycles
and
sapropels
of southern
Italy [De Visser
et al., 1989; Howell et al., 1990;
Thunell
et al., 1991; Van der Weijden,
1993]. In addition,
Sprovieri
et al. [1986] suggested
that diagenesis
could
be
responsible for the variation in carbonate content. In the next
section,
we will discuss
each
process
separately,
so as to
assess
its potential
importance
in determining
the CaCO
3 and
Co,g
content
of these
sediments.
Diagenesis
Evidence
for dissolution
comes
from
the abundance
pattern
of discoasters.
Discoasters
are adapted
to an oligotrophic
environment
[Chepstow-Lusty
et aL, 1989]. Apart from this
paleoenvironmental
significance,
discoasters
are
thought
to be
more resistant to dissolution
than small placoliths
(Reticulofenestra
minutula),
and Calcidiscus
pelagicus.
Discoaster
abundance
will therefore
be relatively
higher
after
dissolution [Lobmann and Carlson, 1981]. Enhanced dis-
solution occurred in the sapropel and at the boundaries of the
gray layer. The relative enhanced abundance of discoasters in
the sapropel
closely
matches
the Mn concentrations
(Figure
4).
To assess
significance
and timing
of aliagenesis
we will
discuss
the possible
effects
during
the successive
aliagenetic
stages:
(1) deposition,
(2) early
aliagenesis,
(3) aliagenesis
after
burial and (4) weathering.
Deposition.
Dissolution
of CaCO3
is often
reported
to
occur
in shelf
sediments,
even
as the overlying
seawater
is
VAN OS ET AL.' SAPROPEL FORMATION 607
Planktonic foramiferal associations (%)
0 10 0 0 0 10 20 ,.30 0 10 0 0 0 0 10 0 10 0 10 20 0 0 10 20 ,.30 0 0 0 10 20 0 20 30 4.0 50 60 70
'i"
11 12 13 14 15 16 17Planktonic foraminiferal associations (shells/cm 3)
0 0 0 0 400 800 1200 0 0 0 0 0 400 0 400 0 400 800 12000 0 400 0 0 0 400 800 0 '-' 20 • 30 • 4.0 '• 50 60 ß . 8 11 2 13 14 15 16 17
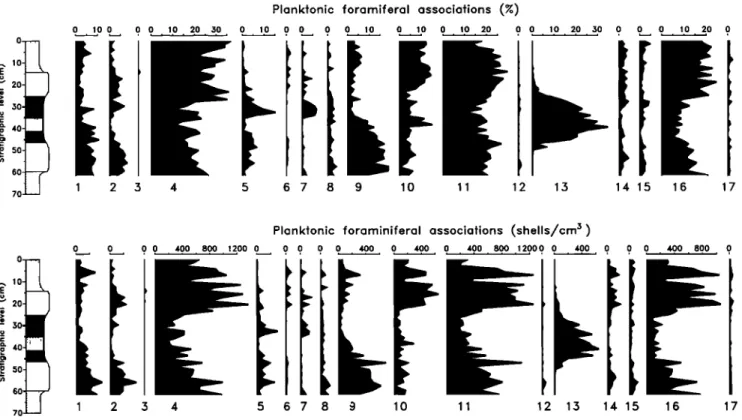
Figure 6a. Abundances and accumulation rates of planktonic foraminifera versus depth' 1 = G. ruber; 2 = G. sacculifer; 3 = Sph. sp.' 4 = G. apertura; 5 = G. obliquus' 6 = G. siphonifera; 7 = G. bulloides; 8 =
G. bulloides (intermediate); 9 = G. falconensis; 10 = G. bulllodes (juvenile)' 11 = Neogloboquadrina sp.
(dextral); 12 = Neogloboquadrina sp. (sinistral); 13 = G. puncticulata; 14 = O. universa' 15 = T. quin- queloba; 16 = G. glutinata; 17 = species indeternfinable.
40- 50- 60-- Calcareous nannofossils (%) 0 10 20 30 40 0 10 20 3.30 40 50 60 70 0 10 20 30 40 50 0 10 20 0 10 20 0 10 0 0 0 0 0 1 2 3 4 5 6 7 8 9 10 11 40. 50. 60.--
Calcareous nannofossils (coccoliths * 106/cm 3)
0 50 100 150 200 0 50 100 150 200 250 3.300 3.350 400 450 500 550 600 650 700 750 800 0 50 0 500 0 0 0 0 0 0
1 2 3 4 5 6 7 89 10 11
Figure 6b. Abundances and accumulation rates of calcareous nannofossils versus depth: 1 = C. pelagicus;
2 = R. minutula; 3 = discoasters; 4 = C. leptoporus; 5 = C. macintyrei; 6 = H. carteri; 7 = H. sellii; 8 = U.
608
VAN OS ET AL.: SAPROPEL
FORMATION
1990]. The presumed depth of accumulation was 400-800 m,
that is, well above the lysocline (present-day equals 3000 m)
and beyond the reach of corrosive bottom waters that could
dissolve CaCO3. In addition, the modern eastern Mediter-
ranean water column is entirely saturated with respect to
calcite.
During deposition, CaCO3 dissolution can occur during oxic
decomposition of organic matter at the sediment-water
interface following the reactions [Emerson and Archet; 1990]
CH20 + 02 ---> CO 2 + H20 (1)
GO
2 + CaCO
3 + H20 .• 2HCO3-
+ Ca
2'
(2)In such a system, build-up of HCO3', which would slow down dissolution, is prevented by high benthic activity. Throughout the studied interval, the total amount of benthic foraminifers
in the 125 to 595-gm
fraction
was low (= 125 shells/cm
3) and
remained almost constant. This suggests that the system was not sufficiently closed to prevent mixing with supersaturated bottom waters. However, the occurrence of pyrite in the gray layer and intercalated sapropel indicates that anoxic conditions prevailed in the subsurface sediment during deposition. In the very early stages of sulphate reduction, a decrease in pH might be expected, which will result in undersaturation with respect to most carbonate minerals [Canfield and Raiswell, 1991]. Pervasive sulphate-reducing conditions, however, will produce alkalinity that will enhance the preservation of
CaCO 3 [Morse and MacKenzie, 1990].
If dissolution was the only cause to explain the decrease in
CaCO 3 from 55 wt % (or 55 g) in the white layer to 21 wt %
(or 12 g) within the gray layer and sapropel (thus assuming a constant terrigenous flux of 45 g), this would suggest that 78% (43 g) of CaCO3 dissolved at the sediment-water inter-
face. To dissolve this amount of CaCO 3, about 12/100
(molecular
weight
Corg/CaCO3)
x 43 g = 5.16 gr (or 5.16 wt
%) Corg
has to be decomposed.
Decomposition
of such
(unrealistically)
large amounts
of Co• would
rapidly
exhaust
oxygen in the pore water and subsequently anoxic conditions
at the sediment-water interface. The occurrence of benthic
foraminifera, however, contrasts this scenario.
The fact that the percentages of discoasters did not increase in the low-carbonate beige-colored layer of the carbonate cycle but only in the gray layer and sapropel may suggest that dissolution might have occurred above a certain threshold
value
of Co•. The relative
abundances
of discoasters
increased
between
48 and
30 cm during
which
Co•,
values
vary between
0.4 and 1.2%. This would imply that dissolution already
started to occur for Cor• percentages
larger than 0.4%.
Consequently, we would have expected to find enhanced
percentages of discoasters within the 50- to 20-cm interval.
The relative abundances of discoasters, however, already decreased at 30 cm. It therefore seems unlikely that the observed dissolution pattern is related to a certain threshold value. In addition, the pattern displayed in the discoaster abundances does not show a clear correlation with the organic carbon content in this interval. Moreover, this dissolution index shows a good relation with the lithological boundaries and faintly laminated sapropel in this carbonate cycle rather
than with Corg.
We conclude
that organic carbon
decom-
position did not induce carbonate undersaturation in the
sediment, which implies that the decrease of CaCO 3 in the
gray layer cannot result from dissolution during deposition.
Early aliagenesis. After deposition of the gray layer,
sulphate reduction probably ceased because of the diminished
supply of reactive organic carbon. This is also indicated by
the low pyrite content in the surrounding white and beige
layers. In this situation, replenishment of oxygen in the
sediment may occur, which can lead to the development of a
progressive oxidation front. As a result, oxygen penetrating
into the sediment will react with reduced iron and manganese,
causing the formation of metal-rich layers above the previous-
ly anoxic sediment [Pruysers et al., 1993]. However,
progradation of the front will be seriously hampered by the
high organic carbon and pyrite contents that were previously
formed in the gray layer. Only after oxidation of most sulphides and organic matter will the front progress. Therefore it is extremely unlikely that the Mn-rich layer, found in the
center of the gray layer and in which organic matter and
sulphide are still abundant, would be formed during this stage
in diagenesis. Oxidation of organic matter in this stage can
also result in the dissolution of CaCO3 following the reactions
(1) and (2). However,
the Co•g
profile
does
not indicate
that
penetration of an oxidation front has occurred. Such an
oxidation front would have resulted in a stepwise increase of
the organic matter concentration and the formation of iron and manganese enrichments above the organic-rich layers [e.g., Pruysers et al., 1993; Tllomson et al. 1993]. In addition, in
view of the relatively low reactivity of organic matter after
deposition, these reactions may be assumed to take place in
a closed system. As a consequence, of the re-equilibration of
reaction (2), CaCO3 dissolution will slow down. Instead of
making a number of assumptions in an effort to calculate the resulting organic matter decomposition to the observed
decrease in CaCO3, we prefer to refer to the results of a
natural decomposition experiment. In the Madeira Abyssal
Plain, the oxic decomposition of about 0.6% organic matter
has resulted in a 3% decrease in CaCO 3 content [Thomson et
al., 1993]. Extrapolation to the carbonate cycles under
investigation would require decomposition of more than 9%
organic carbon to explain the 34% decrease in CaCO3,
assuming a constant terrigenous flux.
Carbonate dissolution due to acid production during the
oxidation of pyrite [Stumm and Morgan, 1981] in the gray
layer probably did not occur, because pyrite is still abundant
and products of pyrite oxidation (gypsum and iron
(hydr)oxides) are not found. Theretore carbonate dissolution
during the oxic decomposition of organic matter and sulphides
seems unlikely, and the observed decrease in carbonate cannot be explained by early aliagenesis.
Diagenesis after burial. Diagenetic CaCO 3 dissolution and
precipitation caused by interaction with large volumes of
formation water could have occurred after burial. The burial
depth of these relatively young sediments most probably did
not exceed 300 m, which virtually excludes large-scale
diagenetic processes. Furthermore, exchanges with formation
and meteoric water would be marked by significant shifts in
8180
and 813C
of the carbonate
due to recrystallization
or
dolomitization.
Although
a shift to more
negative
8•80 values
is observed in the sapropel, these shifts are small compared
with reported values of calcite recrystallized during burial
VAN OS ET AL.: S APROPEL FORMATION 609
careful examination of all shell fractions did not show any signs of diagenetic alteration. Therefore the effect of dis- solution during burial is thought to be insignificant.
Weathering. Subaerial weathering can contribute sig- nificantly to the lithological appearance and chemical al-
teration of the sediments [Van Os et al., 1993]. In the
carbonate cycle 106/107 in the Punta Piccola section in
particular,
organic
carbon,
sulphur,
and •5•3Corg
show
sig-
nificant changes at Mn- and Fe-enriched levels [Van Os et al., 1993]. This is thought to be caused by infiltration of acidic, meteoric water subsequently tollowed by transport of water along highly conductive planes. Oxidation of pyrite andorganic matter could have caused the dissolution of CaCO3
(reaction (2)) and other constituents. As mentioned before, the
oxidation of pyrite produces acidity and could dissolve large amounts of carbonate. In this carbonate cycle, a manganese- rich layer is also found in the sapropel, parallel to the bedding, plane indicating that this kind of dissolution might have occurred in this carbonate cycle as well. A ratio of greater than 10-grn versus less than 10-1am shell fractions (shell ratio index) (Figure 4) resembles the pattern as displayed in the percentages of discoasters and indicates that the small fraction was easier dissolved at the boundary of the gray layer and in the sapropel than the coarser fractions. Although one might assume that the largest shells would be affected more easily by dissolution, we suggest that the larger shells could still be identified and counted, whereas the smaller shells could not be recognized anymore. As an alternative explanation, it can be hypothesised that because of subaerial wheathering, the small fraction was easier winnowed by meteoric water transport than that of the coarse fraction. Nevertheless, organic matter and sulphur do not significantly decrease at the Mn- enrichment, suggesting that they were not
affected
by weathering.
In addition,
•5•3Corg
shows
no
variation within the Mn-enriched layer.Summarizing, minor dissolution has occurred during weathering in the Mn-enriched layer. This dissolution process,
however,
cannot
explain
the total
variations
in CaCO3
and
Co•g
content in this carbonate cycle, because (1) the shell ratio
index and relative abundance of discoasters did not increase
during deposition of the beige layer, which is also charac- terized by low CaCO3 contents and low absolute number of calcareous fossils and (2) the variation in the CaCO3 content does not correspond well with a decrease in discoasters: the most rapid increase in the relative abundance of discoasters is
accompanied by only a small decrease in CaCO3 content.
Dilution and Productivity
Dilution is a process commonly used to explain variations
in CaCO3 in sediments deposited above the carbonate com-
pensation depth. Geochemical studies of the Trubi and Monte
Narbone formations, as well as the younger sediments of the Vrica section, suggest that dilution with terrestrial clastics played an important role during the formation of the car- bonate cycles and sapropels [De Visser et al., 1989; Howell
et al., 1990; Thunell et al., 1991; Van der Weijden, 1993]. De
Visser et al. [1989] used dilution to explain the low carbonate content in the gray marls of the Trubi formation. In addition, they attributed the white and beige marl beds to periods of high and low carbonate production, respectively.
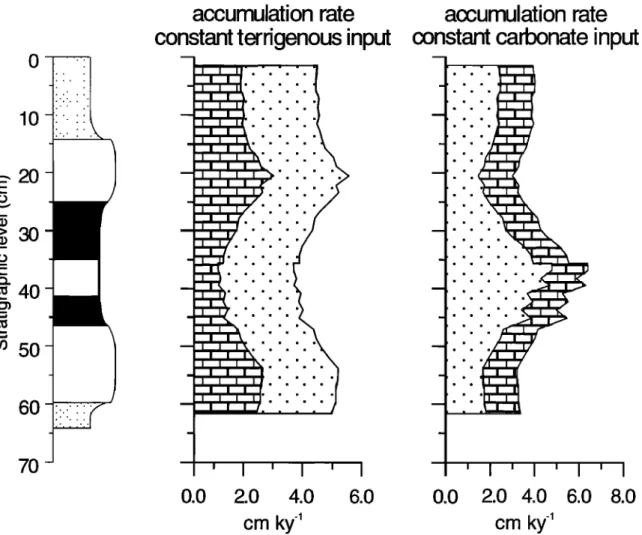
It is difficult to distinguish between the effect of dilution and carbonate production, since lower carbonate production and increasing terrigenous accumulation have similar effects on lithology. The two most extreme cases of the etYect of dilution versus the effect of carbonate production on the accunmlations rates is demonstrated in Figure 7 by assuming a constant carbonate input or constant terrigenous input, respectively.
For the determination of accunmlation rates, the terrigenous
fraction
(f,½0
was estimated
as 100 - CaCO3(%)
- Co,g(%);
the
carbonate fraction (fc•,b) was calculated from the Ca con-
centration, assuming CaCO3 is the only carbonate mineral
present and neglecting the contribution of aluminosilicate-
bound
Ca. Accumulation
rates
,are
in gcm -2 kyr
'1, assuming
that constant carbonate production and an average sedimen-
tation
rate of 4.2 cm kyr
'• [Hilgen,
1991b]
can be calculated
for different constituents [M] by
/ )
[M]ac
=
f½t, x 4.2
x p (3)
avg[l+ft•rr
where p is bulk density in grams per cubic centimeter (-1.5
g cm'3).
The accumulation
rate of constituents
[M] during
constant terrigenous accumulation can be calculated by
[M]ac
½ =
x 4.2 x p
(4)
ft•rrfterr
Dilution. The major result of assuming
a constant
car-
bonate
accumulation
rate is that the terrigenous
accumulation
rate was highest
during deposition
of the gray layer and
sapropel,
and the lowest
during
deposition
of the white layers
(Figure 7). Such enhanced terrigenous accumulation in the
gray layer would certainly be marked by variations in
mineralogy and grain size. Grain size measurements of
sediments
from the Trubi formation
show that a higher
proportion of relatively large particles was deposited in the
beige
beds
compared
with the white or gray beds [De Visser
et al., 1989]. Furthermore,
the gray layers
were characterized
by a small
range
in particle
size,
suggesting
a riverine
source.
De Visser
et al. [1989] therefore
concluded
that during
deposition
of the gray layer, the carbonate
signal
was diluted
with river-derived
terrigenous
material.
Although
we did not
carry out grain size analysis on our samples, the Ti/A1, Zr/A1,
and Cr/A1
ratios
can also
be used
as indicators
for grain
size
variations.
The nearly
constant
but slightly
lower Ti/A1, Zr/A1,
and
Cr/A1
ratios
in the gray
layer
and
sapropel
compared
with
the surrounding
white and
beige
layers
(Figure
5) are consis-
610 VAN OS ET AL.: SAPROPEL FORMATION o
E 2O
>30 '• 40 50 7Oaccumulation rate
constant
terrigenous
input
0.0
I ' I
2.O 4.O
cm ky
-1
accumulation rate
constant
carbonate
input
6.0
0.0
2.0
4.0
cm ky
-1
I ' I
6.0 8.0
Figure
7. Cummulative
accumulation
rate
diagram
of carbonate
accumulation
rates
(blocks)
and
terrigenous
accummulation
rates
(dots),
assuming
a constant
terrigenous
input
(left) and
constant
carbonate
input
(right).
tent with the grain size variations observed by De Visser et al.
[1989].
Although the inferred variations in grain size may give an
indication
of the provenance
of terrigenous
material,
they
give
no definite answer to the question of whether the amount of
terrigenous material increased or decreased during deposition
of the gray layer. A more direct indication of the amount of
terrigenous
input comes
from the •5•3C
of organic
matter.
Sackerr [1964] and Jasper and Gagosian [1990] showed that
•5•3Corg
can be used
as an indicator
of changes
in the
provenance of organic matter due to the different •5•3C values
for terrestrial
and marine
organic
matter.
Assuming
a constant
carbonate
accumulation
rate, the Corg
accumulation
rate
gradually
increases
from 0.15 gcm
'2 kyr
4 in the beige
layer
to 0.60 gcm
'2 kyr
'• in the sapropel
(Figure
8) and
is closely
correlated
with the terrigenous
flux. If this increase
in organic
carbon
were mainly caused
by enhanced
terrigenous
organic
matter
supply,
one
would
expect
a lighter
•5•3Co•8
value
in the
sapropel.
However,
the
enhanced
•5•3Co•
8 values
(-- -22.5%0)
(Figure 3) in the gray layer and intercalated
sapropel
are
typical values for organic matter derived from marine
plankton. In most marine settings, organic carbon from
terrestrial sources has isotopically lighter values. Therefore an
increased
influx
of terrestrial
organic
carbon
in the gray
layer
and intercalated sapropel might not be expected.
Consequently,
the low carbonate
content
and high organic
carbon
content
in the gray layer and sapropel
cannot
ade-
quately
be explained
by enhanced
terrigenous
input. Thus
variations
in carbonate
content
must
be explained
by changes
in productivity (Figure 7).
Productivity.
The major
result
of assuming
a constant
ter-
rigenous accumulation rate is that the carbonate accumulation
rate was highest
during deposition
of the white layers,
intermediate
in the beige
layer,
and lowest
in the gray layer
and intercalated sapropel (Figure 7). Based on increased
planktonic abundances and high carbonate content in the
white beds, Thunell et al. [1991] postulated that the white
carbonate-rich beds of the Trubi formation were formed
during periods of enhanced
paleoproductivity.
In the
sediments under investigation, this considerable increase in
carbonate and calcareous fossils of the various size fractions
is also observed (Figure 6). In this section we test the
hypothesis
that these
white layers
reflect
periods
of highest
paleoproductivity.
A direct method
for estimating
paleoproductivity
is to
VAN OS ET AL.' SAPROPEL FORMATION 611 i 0 i 70- Filmre 8.
PaP (grC m -• a")
80 120 160 0Pnew
(grC
m
-• a")
Pnew
(grC
m
'• a-') Flux-Ba
(pgram
cm
-• a '•)
80 8
I I
40 0 40 800 4
I , I , I I , I •
(a) Paleoproductivity (PAP) and new paleoproduction estimates (Pnew) computed from the
(marine)
organic
carbon
content
(equations
(6) and (7)) assuming
constant
terrigenous
input
(pluses),
contant
carbonate
input (diamonds),
and constant
sedimentation
rate (circles).
(b) B%ioflux
and P,ew
computed
from
the B%i
o content
(equations
(8)-(11)) assunfing
constant
terrigenous
input (diamonds),
constant
carbonate
input (pluses) and constant sedimentation rate (circles).
content.
To calculate
the marine
fraction
of total Co,g
we used
the method of Calder and Parker [1968] and Jasper and
Gagosian [ 1990]'
13 13 13 13
MCo,g
= Co,g
x [(b Ci-•5
CT)/(•5
CM-•5
CT)]
(5)
where
•513C
i = •513Corg
of a given
sample,
•513C
T = •513Cor
. of
the
terrigenous
end-member
equals
-26.6
+_
0.7%,,,
and
bt•3CT
= •S13Corg
of the marine
end-member
equals
-20.6
+_
2.2%o.
Export productivity
is commonly
used for describing
the
amount
of organic
matter
that leaves
the photic
zone [Miiller
and Suess,
1979; Berger
et al., 1989;
Samthein
et al., 1988,
1992]. We have computed the paleoproductivity (P) and new
paleoproductivity
(Phew)
according
to the empirical
transfer
equation
for Pleistocene
paleoproductivity
from Sarnthein
et
al. [ 1992]:
P = 61.390
C^
ø'25ø
S -0.049
B-cZ0.150
(6)P,½w
= 9.354 CA
0'493
SB.C
'0'105
Z
0'300
(7)
where C^ is the weight percent of the marine organic matter,
SB.c equals the sedimentation rate, and z is 600 m. We
assumed that the (organic) carbon free sedimentation rate (S•.
c) nearly eaquals the bulk sedimentation rate (S•). The P
estimate
varies
from +_140
gC m
'2 yr '• in the sapropel
to +_90
gC m
'2 yr '• in the beige
layer
(Figure
8). The P values
in the
beige layer are in very good agreement with the paleoproduc- tivity estimates derived from the modern western Mediter-
ranean,
which
vary between
87.7 and 106 gC m
'•' yr '• (see
Morel and Andrd [1991, and references therein]). Moreover,
this value is close to the mean annual fixation rate of the
world ocean
of about
111 or 75 gC m '2 yr '• when using
the
total carbon fluxes proposed by Bolin [1983] or Berger et al.
[1987]. From this viewpoint the P estimates of the beige
layers of the carbonate cycle tums out to be close to the
"mean" world ocean. The paleoproductivity estimates in the
gray layer and intercalated sapropel are higher than those
estimated in the high-productivity conditions in the northem
part of the westem Mediterranean and in the Alboran Sea (see
Morel and Andrd [1991]). Moreover, these estimates are
comparable to present-day productivity values recorded along
upwelling regions such as the Arabian Sea [Murray and Prell,
1992] and the Peruvian coast [Fleming, 1957; Koblents- Mishke et al., 1970; Berger et aL, 1987; Schrader, 1992].
To eliminate the effects of decomposition or enhanced
preservation of organic matter on the paleoproductivity
estimates, one may use a tracer of paleoproductivity that is
not affected by aliagenesis, such as barium [Goldberg and
Arrhenius, 1958; BostrOm et al., 1973; Church, 1979; Bruin- sack, 1986; Calvert, 1983; Schmitz, 1987; Klinkl•ammer and
Lambert, 1989; Dymond et aL, 1992]. Barium is a good
indicator for export production of marine organic matter, because it is removed by organic particles from the photic
zone [Bishop, 1989; Dehairs et al., 1987]. While organic
matter may be decomposed in the water column or in the
sediment, the barium signal will be preserved in the sediment. Diagenetic remobilization of barium is reported to occur
under pervasive anoxic conditions [Bruinsack, 1986; Van Os
et al., 1991]. Although sulphate-reducing conditions were
developed in the sediment studied here during deposition of
the sapropel, as suggested by the presence of ironsulphides,
the Ba distribution does not indicate significant remobilization. The small decrease of Ba found at the Mn-
![Figure 1. Location map and schematized lithology of carbonate cycle 101/102 (numbering quadruplet cycles after Hilg en [ 1991 b])](https://thumb-eu.123doks.com/thumbv2/123doknet/13687493.432126/3.891.124.777.499.1059/figure-location-schematized-lithology-carbonate-numbering-quadruplet-cycles.webp)