HAL Id: hal-00643866
https://hal.archives-ouvertes.fr/hal-00643866
Submitted on 8 Dec 2011
HAL is a multi-disciplinary open access
archive for the deposit and dissemination of sci-entific research documents, whether they are pub-lished or not. The documents may come from teaching and research institutions in France or abroad, or from public or private research centers.
L’archive ouverte pluridisciplinaire HAL, est destinée au dépôt et à la diffusion de documents scientifiques de niveau recherche, publiés ou non, émanant des établissements d’enseignement et de recherche français ou étrangers, des laboratoires publics ou privés.
Drag force mechanical power during an actual
propulsion cycle on a manual wheelchair
Christophe Sauret, Michel Dabonneville, Mariano Cid, Philippe Vaslin
To cite this version:
Christophe Sauret, Michel Dabonneville, Mariano Cid, Philippe Vaslin. Drag force mechanical power during an actual propulsion cycle on a manual wheelchair. Innovation and Research in BioMedical engineering, Elsevier Masson, 2009, 30 (1), pp.3-9. �10.1016/j.irbm.2008.10.002�. �hal-00643866�
Drag force mechanical power
during an actual propulsion cycle
on a manual wheelchair.
Christophe Sauret1, Philippe Vaslin2, Michel
Dabonneville3, Mariano Cid4
Research Report LIMOS/RR 08-05
06/10/2008
1 LIMOS-CNRS UMR 6158, Univ. Blaise Pascal, sauret@isima.fr 2 LIMOS-CNRS UMR 6158, Univ. Blaise Pascal, vaslin@isima.fr 3 LIMOS-CNRS UMR 6158, Univ. Blaise Pascal, dabonneville@isima.fr 4 LMP-CNRS UMR 5469, Université Bordeaux I, m.cid@lmp.u-bordeaux1.fr
hal-00643866, version 1 - 23 Nov 201
1
Author manuscript, published in "IRBM 30, 1 (2009) 3-9" DOI : 10.1016/j.irbm.2008.10.002
Abstract
The object of this study was to compute the mechanical power of the resultant braking force during an actual propulsion cycle with a manual wheelchair on the field. The resultant braking force was calculated from a mechanical model taking into account the rolling resistances of the front and rear wheels. Both the resultant braking force and the wheelchair velocity were not constant during the propulsion cycle and varied according to the subject’s fore-and-aft and vertical movements in the wheelchair. These variations had logical repercussions on the braking force mechanical power, which ranged from 20.6 to 34.5 W (mean = 29.6 W) during the propulsion cycle. The mechanical power was also calculated from the conditions of a classical drag-test, by the product of the cycle mean velocity and a constant braking force corresponding to a 60 % rear wheels distribution of the subject-and-wheelchair’s weight. This second mechanical power (32.4 W) was 10 % higher than the average of the instantaneous power. Beyond the need of a clear definition of the two phases of the propulsion cycle, this study showed that the assumption on wheelchair locomotion usually admitted on laboratory ergometers cannot be applied in field studies, and that the kinetic energy variations during the cycle propulsive phase should be considered for evaluating the subject’s mechanical work and power.
Keywords: Braking force, Mechanical power, Manual wheelchair, Actual condition.
Résumé
L’objet de cette étude était de calculer la puissance mécanique des forces de freinage pendant un cycle de propulsion en fauteuil roulant manuel sur le terrain. La résultante des forces de freinage a été calculée à partir d’un modèle mécanique prenant en compte la résistance au roulement des roues avant et arrière. Aussi bien la résultante des forces de freinage que la vitesse du fauteuil n’étaient pas constantes pendant le cycle de propulsion et variaient avec les mouvements antéropostérieurs et verticaux du sujet dans le fauteuil roulant. Ces variations se répercutaient logiquement sur la puissance des forces de freinage, qui variaient entre 20,6 et 34,5 W (moyenne = 29,6 W) pendant le cycle de propulsion. La puissance mécanique a été également calculée à partir des conditions d’un test de décélération classique, par le produit de la vitesse moyenne du cycle et d’une force de freinage constante correspondant à une répartition de 60 % du poids du système {sujet + fauteuil} sur les roues arrière. Cette seconde puissance mécanique (32.4 W) était supérieure de 10 % à la moyenne des puissances instantanées. Au-delà de la nécessité d’une définition claire des deux phases du cycle de propulsion, cette étude a montré que les hypothèses sur la locomotion en fauteuil roulant communément admises sur les ergomètres de laboratoire ne peuvent pas être appliquées aux études sur le terrain, et que la variation d’énergie cinétique pendant la phase propulsive du cycle devrait être prise en compte pour évaluer le travail et la puissance mécaniques du sujet.
Mots-clés : Force de freinage, Puissance mécanique, Fauteuil roulant manuel, Situation réelle.
hal-00643866, version 1 - 23 Nov 201
Introduction
Handrim wheelchair propulsion is a very strenuous form of locomotion for both the cardio-respiratory system [1] and the musculoskeletal system [2], at the origin of many chronic pains and injuries at the shoulder [3,4], the elbow and the wrist [5].
For investigating this form of locomotion, scientists have used different devices like wheelchair simulators, rollers ergometers or specific wheelchair treadmills in order to measure the work load of a subject propelling a manual wheelchair. Most of the studies carried out with these devices assumed that the wheelchair velocity was constant during the propulsion and the subject must maintain a mean cycle velocity all along the exercise duration. This assumption, which induced that the kinetic energy variation was null, allowed considering that the sum of the mechanical works of the motor force created by the subject (
m
F
) and the resultant braking force (Fb) was null. Consequently, the mechanical work of the motor force was simply equal and opposed to the drag force mechanical work:
( )
m( )
bW F = −W F
The mechanical power developed by the subject was then computed from the drag force mechanical power (P ), defined as the dot product of the braking force (b Fb
) and the wheelchair velocity (Vw):
b b w
P = F V ⋅
On the field, as on laboratory ergometers, the braking forces are on three forms: rolling torques at the tires/floor contact, friction torques at wheels hubs and aerodynamic drag force [6]. In the case of laboratory ergometers, the wheelchair velocity in the laboratory reference frame is null and the aerodynamic drag force is thus negligible [1]. So, the resultant braking force is resumed to the rolling and friction torques. On wheelchair simulators, since the wheels have no contact with the ground, the rolling torques of the tires on the floor is simulated by a resistance applied on the rear wheels axle and chosen by the clinician [7,8]. On treadmills, the rolling and friction torques are globally determined from a drag test [9,10]: a force sensor is mounted on a cable binding the wheelchair to the treadmill frame, in order to measure the drag force when the treadmill is functioning. During this test, the subject is sitting still upright in the wheelchair with his back resting on the seat back. On roller ergometers, the resultant braking force is also computed from a deceleration test performed in the same conditions as a treadmill drag test [11]. This method has also been used in the rare field studies where wheelchair deceleration was either calculated from the elapsed time to cross a known distance [12] or by a first time derivation of the “instantaneous” wheelchair velocity [13,14,15], or directly measured by an accelerometer fixed on the wheelchair frame [16].
The drag force mechanical power (P ) was then computed by multiplying the chosen or b measured drag force value with the theoretical wheelchair velocity calculated from the wheels angular velocity on wheelchair simulators, from rollers angular velocity on roller ergometers and from the treadmill belt velocity on wheelchair treadmills. In all cases, the velocity was assumed constant all along the exercise duration and the mechanical power was thus also assumed constant.
However, several authors have shown that even during an exercise performed at a constant cycle mean velocity, the instantaneous wheelchair velocity varied within the propulsion cycles [17,18] and oscillated all along the displacement. These within-cycle variations of
hal-00643866, version 1 - 23 Nov 201
wheelchair velocity allowed distinguishing a propulsion phase when the wheelchair speed increases and a recovery phase when it decreases [18].
Besides, other authors have shown that the subject’s position in the wheelchair influenced the drag force value, and was related to the subject-and-wheelchair’s mass distribution between front and rear wheels [16]. This variation was explained by the difference of radii between front casters and rear wheels, and by the different mechanical and chemical properties of their tires. Thus, when the fore-and-aft distribution of the mass is modified, the local braking forces under the front casters and under the rear wheels do not evolved identically: the increase of the former is not equal to the decrease of the latter. This phenomenon allowed assuming that the subject’s movements on the wheelchair could influence the resultant braking force within the propulsion cycle [16]. Indeed, the few experimentations on this phenomenon have shown that the resultant braking force could largely vary between 20 and 55 N [19] and between 16 and 25 N during the propulsion cycle [20]: the resultant braking force increased during the push phase and during the beginning of the recovery phase, and then regularly decreased till the end of the cycle, down to its cycle initial value. In these studies, the push phase was defined by the time interval during which the subject applied an effort on the handrims, and the recovery phase by the time interval when the subject did not applied any effort on the handrims.
As both the wheelchair velocity and the braking force increased during the push phase and then decreased during the recovery phase, it can be assumed that the drag force mechanical power (P ) could be influenced by the variations of these parameters. The aim of the present b study was (i) to demonstrate that the drag force mechanical power is not constant during an actual field displacement, and (ii) to evaluate the magnitude of this variation. The mean value of P during the propulsion cycle was also compared with that calculated by a classical b method based on deceleration test.
Materials and methods
On the field, the rolling torques of tires on the ground and the friction torques at wheels hubs are opposed to the wheelchair displacement. Besides, since the wheel hubs are balls bearings, the friction resistance is the resultant torque of all the rolling torques of balls on the rings. This implies that the rolling torques on the ground and at wheels hubs are governed by the same mechanical laws. Consequently, the resultant rolling torque of each wheel (M ) is R the sum of the rolling torques of the tire on the ground (M ) and of the balls on the rolling RG rings (MRH) [20]:
R RG RH
M = M + M
Each wheel resultant rolling torque can also be expressed by the product of the global rolling coefficient of the tire on the ground and the ball bearings (δ ) with the normal ground reaction force applied by the ground on the wheel (R ):N
R N
M = δ R
Moreover, as the wheelchair velocity is generally ranging from 1 to 2 m/s during a daily wheelchair displacement, the aerodynamic drag force can be assumed negligible [1]. So, the resultant braking force is resumed to the rolling torques actions on the four wheels. Besides, the general rolling torque expression allows writing that the rolling torque M (resp. R1 M ) R2
hal-00643866, version 1 - 23 Nov 201
on front wheels (resp. rear) is equal to the product of the rolling coefficient δ1 (resp. δ2) with
the normal ground reaction force R (resp. N1 R ) applied on both front wheels (resp. rear):N2
1 1 1
R N
M = δ R and: MR2 = δ2 RN2
The action of M (resp. R1 M ) on the front wheels (resp. rear) can also be expressed by a R2
braking force F (resp. b1 F ) applied on the front wheel axle (resp. rear), opposed to the b2
wheels displacement, and equal to the ratio of the rolling torque with the front wheel radius
r
1(resp.
r
2) : 1 1 1 1 1 1 N R b R M F r δ r = = and: 2 2 2 2 2 2 N R b R M F r δ r = =Considering that the wheelchair frame is rigid, the resultant braking force (F ) is equal to b the sum of the braking forces acting on front and rear wheels:
1 2 1 2 1 2 N N b
R
R
F
r
r
δ
δ
=
+
(1)The rolling coefficients
δ
1 andδ
2 have been determined before the experiments with subjects, with the same wheelchair and on the same floor. Four series of fifteen deceleration tests were realized with two additional masses (50 and 90 kg) successively placed forwards and backwards on the seat. During each test, an assistant pushed the wheelchair and the additional mass on a flat and horizontal ground till giving it an initial velocity. Then the wheelchair decelerated under the only action of the braking force, and its deceleration was continuously measured by a 3-D accelerometer (FA 3506, FGP, France) fixed on the frame.Simultaneously, the three components of the force and of the torque applied by the additional mass on the seat were measured by a six-component dynamometer (TSR, Mérignac, France) fixed between the seat and the wheelchair frame. The accelerometer and the dynamometer signals were sampled at a 100 Hz frequency by 16-bit analog/digital conversion card (AI-16XE-50, National Instruments, USA) plugged in a embedded mini-computer (FMW 2902 F, Fujitsu, Japan) fixed under the wheelchair seat. Data were transmitted in real time using IEEE 802.11b and TCP/IP wireless transfer protocols to a remote computer where they were recorded. They were then processed using home-made routines written with a free computational software (Scilab 4.1, INRIA, France) for correcting the accelerometer signal [21] and calculating the resultant braking force. The external force equation during the wheelchair deceleration phase of the test shows that only the resultant braking force modifies the system mechanical state. Then, the second Newton’s law allows writing that during this phase, Fb is equal to the product of the system mass by the measured deceleration.
1
N
R
andR
N2 were determined from the external moment equation, since the resultingmoment remains null as long as the wheelchair keeps its four wheels on the floor. The resulting moment around the rear wheels axle, which is the sum of the moment of
R
N1 and the moment of the system weight (W ), is thus null. This condition allows writing the following equation:1 0
N G
d R + x W =
hal-00643866, version 1 - 23 Nov 201
where x is the fore-and-aft position of the system’s center of mass, expressed in the G wheelchair reference frame, and d is the wheelbase (d = 0.30m in this study). The position of the system’s center of mass was computed by the weighted average of the wheelchair (G ) w and additional mass centers of mass (G ) – the former was measured and the latter was m calculated from the center of pressure on the seat dynamometer – with their respective masses
w m and m :m w w m m w m m OG m OG OG m m + = +
In the same way, the moment around the front wheels axle, which is the sum of the moments of
R
N2 and of the system weight, is null:(
)
2 0
N G
d R + d x W− =
Then,
R
N1 andR
N2 were determined as follow:1 G N x R W d = − (2) and: N2 G d x R W d − = − (3)
Since the
r
1 andr
2 radii were known (0.07m and 0.30m, respectively),δ
1 andδ
2 were finally computed by a least square linear regression.To study the influence of the subject’s movements on the braking force, it was necessary to measure
R
N1 andR
N2 during an actual propulsion cycle on the field. For that purpose, a young able-bodied subject (21 year old, 1.83 m, 72 kg) performed a straightforward displacement on the horizontal track of an indoor athletic stadium (Stadium Jean Pellez, Aubière, France). During this displacement, after about ten pushes, the subject-and-wheelchair system crossed the field of view of a digital video camera (Fastcam-PCI 500, Photron, USA) that recorded the wheelchair and the subject’s movements in the sagittal plane at a 125 Hz frequency.To determine the value of the normal ground reaction force (
R
N) applied by the groundon the subject-and-wheelchair system, the second Newton’s law was applied to the system along the vertical axis. The sum of the wheelchair and the subject’s weights (
W
S andW
W )and the normal ground reaction force is equal to the product of the system mass, which is the sum of the wheelchair and subject’s masses (
m
s +m
w), with its vertical acceleration (a
yG):(
)
S W N s w yG
W
+
W
+
R
=
m
+
m a
The system vertical acceleration (
a
yG) is the weighted average of the verticalaccelerations of the wheelchair (
a
yW) and the subject’s (a
yS) centers of mass. Because thewheelchair is rigid and moved only horizontally, its vertical acceleration is null (
a
yW= 0),and the previous equation becomes:
s S W N yS s w
m
W
W
R
a
m
m
+
+
=
+
hal-00643866, version 1 - 23 Nov 201
N
R
could then be computed from the vertical acceleration of the subject’s center of mass and the wheelchair and the subject’s weights:(
)
s N yS S w s f m R a W W m m = − + + (4)The subject was modeled by fifteen segments [22] defined from anthropometric tables [23], and the flexion of the subject’s trunk during the propulsion was taken into account. The trunk was subdivided in two equal segments, which length was the half of the trunk one in upright position. These two segments were linked by a virtual joint, which position was calculated from the distance between the great trochanter and the acromion. The masses of these segments were assumed homogenous all along their lengths, which allowed computing the trunk and then the subject’s centers of mass. The vertical acceleration of the latter (
a
yS)was obtained by the second time derivation of its position. The fore-and-aft position of the subject’s center of mass was used to compute that of the subject-and-wheelchair, and then
1
N
R
andR
N2 from equations (2) and (3). Wheelchair velocity during the propulsion cyclewas computed by the first time derivation of the position of a marker fixed on the rear wheel center.
For the whole kinematic analysis, the markers coordinates were individually filtered by a low-pass filter based on a fast Fourier transformation with a cut-off frequency ranging between 3 and 6 Hz depending on the markers and their vertical or horizontal displacements. For instance, the coordinates of the markers that presented a narrow range of motion in the wheelchair reference frame, like the great trochanter or the knee, were filtered with a 3 Hz cut-off frequency, whereas those of markers that presented a large range of motion, like the elbow or the wrist, were filtered with a 5 to 6 Hz cut-off frequency, as recommended by DiGiovinne et al. [24] and Cooper et al. [25].
The instantaneous mechanical power of the resulting braking force was calculated by multiplying the instantaneous values of the resultant braking force by the wheelchair horizontal velocity. The mean power during the propulsion cycle was computed by the average of instantaneous power values. The drag force mechanical power calculated from the classical method was obtained by multiplying the mean wheelchair velocity measured during the cycle with the braking force computed by the drag force model with the subject-and-wheelchair’s weight (1083.6 N) and a 60 % weight distribution on the rear wheels.
Finally, two definitions of the propulsive and of the recovery phases were used. In the first method, the propulsion cycle was divided into a push phase, when the hands where in contact with the handrims, and a free-wheeling phase, when the hands did not touch the handrims. In the second method, the cycle was divided into a propulsion phase and a deceleration phase, respectively defined by the periods when the wheelchair speed increased and then decreased. The transition between both these phases corresponded to the precise instant when the wheelchair reached its maximal velocity.
hal-00643866, version 1 - 23 Nov 201
Results
Every deceleration test that presented an artifact or a too large lateral displacement was rejected, which resulted in 11 correct trials for each of the four series (Table 1).
Additional mass - Position n
R
N1 (N)R
N2 (N) a (m/s2)F
b (N)50 kg – Backward 11 369 504 -0,188 (± 0,006) -16,7 (± 0,5)
50 kg - Frontward 11 581 292 -0,305 (± 0,029) -27,1 (± 2,6)
90 kg - Backward 11 550 715 -0,260 (± 0,030) -33,5 (± 3,9)
90 kg - Frontward 11 908 357 -0,398 (± 0,035) -51,3 (± 4,5)
Table 1 : Results of the four series of deceleration tests
The results of the four series showed that, for a same mass,
F
b increased with the forward position of the additional mass, and for a same fore-and-aft position of the additional mass, the braking force increased with the mass value. Moreover, it appeared that theF
b standard deviation increased withF
b value, from 0.5 N to 4.5 N between the first and the last series. Besides,R
N1 seemed to be the main cause of the increase of theF
b value and standarddeviation.
The rolling coefficients
δ
1 (3,64 10-3 m) andδ
2 (0,45 10-3 m) were computed by a leastsquare linear regression of the results of all the deceleration tests. These coefficients were then divided by the front (0.07 m) and rear (0.30 m) wheels radii, respectively, in the computing equation of
F
b (r2= 0,90 ): 3 3 1 2 3.64 10 0.45 10 0.07 0.30 b N N F R R − − = − −Which finally gave:
1 2
0,0520 0,0015
b N N
F = − R − R
In the experimentation with the subject, the duration of the studied cycle was 1.376 second, that corresponded to a cycle frequency of 0.73 Hz (44 cycles/minute). The push and free wheeling phases lasted 0.472 second (34 % of the cycle time) and 0.634 second (66 % of the cycle time), respectively, whereas the wheelchair propulsion and the wheelchair deceleration phases lasted 0.712 second (52 % of the cycle time) and 0.664 second (48 % of the cycle time), respectively. These results showed a difference of 18 % between the durations of the push phase and the propulsion phase. This difference was logically the same between the durations of the free-wheeling phase and the deceleration phase.
Wheelchair velocity computed from the kinematic analysis (Figure 1) increased irregularly from 1.26 m.s-1 to 1.37 m.s-1 between the beginning and the end of the push phase and reached
a maximal value of 1.41 m.s-1 at 0.376 second. But wheelchair velocity increased again after
the end of the push phase during 0.232 second while the subject did not have any contact with the handrims, until reaching a maximal value of 1.50 m.s-1, which corresponded to the end of
the propulsion phase. Then, wheelchair velocity decreased down to its initial value (1.26 m.s -1) at the end of the propulsion cycle. The mean wheelchair velocity during the propulsion
cycle was 1.38 m.s-1.
hal-00643866, version 1 - 23 Nov 201
0,70 0,80 0,90 1,00 1,10 1,20 1,30 1,40 1,50 1,60 0 0, 08 0, 16 0, 24 0, 32 0,4 0, 48 0, 56 0, 64 0, 72 0,8 0, 88 0, 96 1, 04 1 ,1 2 1 ,2 1, 28 1, 36 time (s) (m/s) -40,00 -35,00 -30,00 -25,00 -20,00 -15,00 -10,00 -5,00 0,00 (N) Vw (m/s) Fb (N)
Push phase Free-wheeling phase
Deceleration phase Propulsion phase
Figure 1 : Time course of both the wheelchair velocity (left scale) and the resultant braking force (right scale) during an actual propulsion cycle with a manual wheelchair on the field.
From its definition, the resultant braking force is negative since it is opposed to the wheelchair displacement. However,
F
b is expressed in absolute value in order to facilitate the explanations. Throughout the push phase (Figure 1), the resultant braking force increased from 20.5 N until it reached its maximal value (25.4 N) slightly before the end of the wheelchair propulsion phase (t = 0.584 s). Then, it decreased until reaching 16.4 N at the end of the propulsion cycle. The difference between the initial and final values was 4.1 N, whereas the difference between the minimal and maximal values was 9 N. The mean value ofb
F was 21.5 N during the cycle. It was 22.3 N during the push phase and 21.0 N during the
free-wheeling phase, whereas it was 23.2 N during the propulsion phase and 19.5 N during the deceleration phase.
Since F is negative and b
V
w is positive, the drag force mechanical power (P
b) is logicallynegative; nevertheless,
P
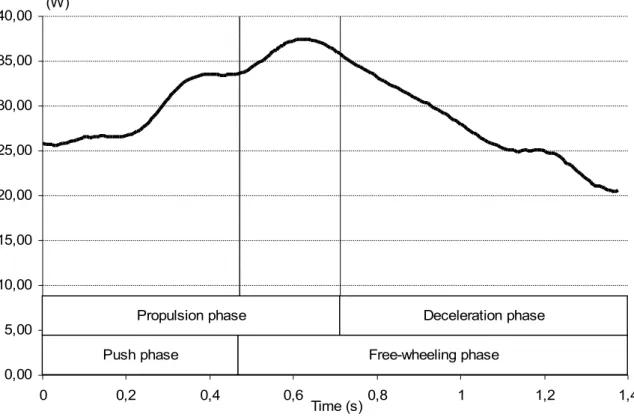
b results are expressed in absolute value to facilitate the explanations (Figure 2). During the propulsion cycle, the drag force mechanical power evolved similarly to the resultant braking force. During the push phase,P
b increased from 25.9 to 33.7 W, and continued to increase up to reach 34.5 W (t = 0.616 s) between the instants ofF
b andV
wmaxima. Then,
P
b decreased rather regularly until reaching 20.6 N at the end of the cycle. The mean power was 29.6 W during the cycle. It was 29.2 W during the push phase and 29.8 W during the free-wheeling phase, whereas it was 31.5 W during the propulsion phase and 27.5 W during the deceleration phase. The mean power differed from only 1 % (0.4 W) during the push phase in reference to the cycle mean power, whereas it differed from 6 % (1.9 W) during the propulsion phase.hal-00643866, version 1 - 23 Nov 201
0,00 5,00 10,00 15,00 20,00 25,00 30,00 35,00 40,00 0 0,2 0,4 0,6 0,8 1 1,2 1,4
Propulsion phase Deceleration phase
Push phase Free-wheeling phase
Time (s) (W)
Figure 2 : Time course of the instantaneous drag force mechanical power during an actual wheelchair propulsion cycle on the field.
The application of the F prediction model to the classical drag-test conditions where a b subject is sitting still upright in the wheelchair with a 60 % rear wheels distribution of the subject-and-wheelchair’s mass gave a result of 23.5 N. Considering the mean cycle velocity (1.38 m.s-1), the drag force mechanical power computed during the cycle was thus constant and equal to 32.4 W. In this case, the classical cycle mean power differed from 10 % with the instantaneous mean power.
Discussion
In agreement with de Saint Rémy et al. [16], the results of the deceleration tests performed in the present study showed that F increased both with the system total mass and with its b front wheels distribution. The increase of the F standard deviation with both the mass and its b forward distribution (R ) could be explained by the conditions of the deceleration tests. N1
Indeed, to generate the wheelchair initial velocity, the assistant must push it harder as the mass and the rolling resistance increase. It is then possible that he involuntarily created a light oscillation of the wheelchair-and-additional mass system that could have been be amplified by the elasticity of the ground surface (synthetic athletic track). This phenomenon could be at the origin of the deceleration variations within trials. Nevertheless, the correlation coefficient of the braking force prediction equation was very satisfactory (r ² = 0.90).
As it had been supposed, the coefficients associated to
R
N1 andR
N2 in theF
b predictionmodel – defined by the ratio of the wheel rolling coefficients (
δ
1 andδ
2) to the wheels radii (1
r
andr
2) – presented a noticeable difference between front and rear wheels. Indeed, ithal-00643866, version 1 - 23 Nov 201
appeared that
F
b was essentially determined by the front wheels resistance since theircoefficient (δ1/ r1) was more than 34 times higher than that of the rear wheels (δ2 / r2).
The kinematic results of the real propulsion cycle showed that the wheelchair velocity firstly increased and then deceased during the cycle, which has already been related in previous studies [17,18]. Wheelchair speed logically increased during the push phase but also during the beginning of the free-wheeling phase. This phenomenon has already been noticed by Vanlandewijck et al. [26] during a wheelchair treadmill study, and by de Saint Rémy [19] on the field, but not by Cooper [18] on a roller ergometer. The backward movement of the trunk during the free-wheeling phase had then been called to explain this second wheelchair acceleration that appeared while the subject did not applied any effort on the handrims. This phenomenon could explain the difference between the durations of the push phase, determined from dynamic measurements, and the wheelchair propulsion phase, determined from kinematic measurements. However, this propulsive action of the trunk exists only if the wheelchair is free, as it is the case on the field and on treadmill, whereas it cannot occur on a roller ergometer or on a wheelchair simulator because on both these devices, the wheelchair is fixed. This technical and methodological difference could explain the confusion in the wheelchair scientific literature between the definitions of the push phase and the wheelchair propulsion phase, on one hand, and between the free-wheeling phase and the deceleration phase, on the other hand.
In agreement with the results of de Saint Rémy [19] and Sauret at al. [20], the resultant braking force (
F
b) acting on the wheelchair during a field displacement was not constant throughout the propulsion cycle. Indeed,F
b increased during the propulsion phase anddecreased during the deceleration phase. During the cycle,
F
b showed a variation of 9 N, which represented 42 % of the cycle mean value (21.4 N). Moreover, the cycle mean value ofb
F
was far higher than most of those reported in previous studies [9,10,12,13,14,15,16], which ranged from 2.8 N [13] to 11 N [10]. Only one study reported a higher mean value (22.6 N) [27]. This highF
b value can be explained by the heavy mass of the experimentalwheelchair (38.5 kg) and by the softness of the floor (synthetic athletic track) on which this study was performed (see above). The difference between
F
b values at the beginning (20.5N) and at the end of the cycle (16.4 N) can also be explained by the fact that the subject was not a regular wheelchair user and his movements were certainly not very efficient.
As a consequence of the almost opposed variations of
F
b and V , the drag force w mechanical power (P
b) was not constant during the propulsion cycle. This result is contradictory to those of most previous studies, and requires some explanations. Indeed, during a classical deceleration test, the subject is sitting still upright in the wheelchair and the measured deceleration partly depends on the subject’s position on the wheelchair, as it was demonstrated in this study and in a few others [16,19,20]. During real propulsion, the subject’s position and movements on the seat influence theF
b cycle mean value, which can be different from that computed from a classical deceleration test. Thus, it can exist a difference between theF
b value measured by a classical deceleration test and its mean valueduring an actual propulsion cycle. This difference between the classical method and that using the instantaneous values of
F
b and V to compute wP
b, would logically be echoed on theF
bmechanical power and could reach 10 %, like in the present study. This analysis points out an essential methodological problem that was ignored in most of the previous studies, but that
hal-00643866, version 1 - 23 Nov 201
could have some influence on the biomechanical and physiological parameters measured or computed in scientific studies on manual wheelchair locomotion.
Conclusion
The kinematic and dynamic analysis of an actual propulsion cycle with a manual wheelchair on the field realized in the present study:
1. Enlightened a confusion source, often met in wheelchair scientific literature, between the definitions of the different phases of the propulsion cycle with respect to the experimental devices used (roller ergometer, simulator, wheelchair treadmill or field study) and to the type of the realized measurements (kinematic or dynamic);
2. Confirmed that wheelchair velocity on the field is not constant during the propulsion cycle, which has already been shown in a few former studies realized on different laboratory ergometers [17,18,26];
3. Showed that, on the field, the subject’s movements with respect to the wheelchair reference frame induce variation of the fore-and-aft distribution of the vertical force between the front and the rear wheels, thus creating a variation of wheelchair drag force during the propulsion cycle;
4. Checked the hypothesis that the drag force mechanical power is not constant during a field propulsion cycle, which is a logical consequence of the variations of both the wheelchair velocity and the resultant braking force.
The results of the present study showed that the assumptions on wheelchair locomotion usually admitted on laboratory ergometers cannot be applied in field studies. Indeed, since both the wheelchair velocity and the resultant braking force are not constant during the propulsion cycle, these parameters must be continuously measured for correctly evaluating the drag force mechanical power.
Moreover, the conclusions of this study questioned either the experimental validity of laboratory ergometers (roller ergometers, wheelchair simulators), or the methodology used to compute the different mechanical parameters of manual wheelchair locomotion. Indeed, since roller ergometers and wheelchair simulators are fixed, they do not allow measuring the wheelchair acceleration induced by the backward movement of the trunk during the recovery phase. In addition, since the subject’s movements induce variations of the resultant braking force during the field propulsion cycle, the drag force applied on a roller ergometer or a wheelchair simulator should also vary along with the subject’s movements on the ergometer. On wheelchair treadmills, the resultant braking force and the actual wheelchair velocity on the treadmill belt should be continuously measured, like in field studies.
Finally, since wheelchair velocity is not constant during the propulsion cycle, the variations of kinetic energy during the cycle propulsive phase – when the subject produces some work – cannot be null in any experimental situation. Consequently, the subject-and-wheelchair’s velocity should probably not remain constant, which induces that the subject’s mechanical work should not be equal to the only drag force work, but should also include the variations of the subject-and-wheelchair’s kinetic energy, according to the classical theorem of kinetic energy.
hal-00643866, version 1 - 23 Nov 201
References
1 van der Woude L.H., Veeger H.E., Dallmeijer A.J., Janssen T.W., Rozendaal L.A. Biomechanics and physiology in active manual wheelchair propulsion. Med Eng Phys 2001 ; 23, 10 : 713-733.
2 van der Woude L.H., de Groot S. Wheelchair propulsion: a straining form of ambulation. Indian J Med Res 2005; 121 : 719-722.
3 Nichols P.J., Norman P.A., Ennis J.R. Wheelchair user's shoulder? Shoulder pain in patients with spinal cord lesions. Scand J Rehabil Med 1979; 11, 1: 29-32.
4 Boninger M., Towers J.D., Cooper R.A., Dicianno B.E., Munin M.C. Shoulder imaging abnormalities in individuals with paraplegia. J Rehabil Res Dev 2001; 38, 4: 401-408.
5 Gellman H., Chandler D.R., Petrasek J., Sie I.H., Adkins R.H., Waters R.L. Carpal tunnel syndrome in paraplegic patients. J Bone Joint Surg 1988; 70a, 4: 517-519.
6 Hofstad M., Patterson P.E. Modelling the propulsion characteristics of a standard wheelchair. J Rehabil Res
Dev 1994; 31, 2: 129-137.
7 Rodgers M.M., Gayle G.W., Figoni S.F., Kobayashi M., Lieh J., Glaser R.M. Biomechanics of wheelchair propulsion during fatigue. Arch Phys Med Rehabil 1994; 75, 1: 85-93.
8 Veeger H.E., van der Woude L.H., Rozendal R.H. Within-cycle characteristics of the wheelchair push in sprinting on a wheelchair ergometer. Med Sci Sports Exerc 1991; 23, 2: 264-271.
9 Brubaker C.E., McLaurin C.A., McClay I.S. Effects of side slope on wheelchair performance. J Rehabil Res
Dev 1986; 23: 55-58.
10 van der Woude L.H., de Groot G., Hollander A.P., van Ingen Schenau G.J., Rozendal R.H. Wheelchair ergonomics and physiological testing of prototypes. Ergonomics 1986; 29, 12: 1561-1573.
11 Theisen D., Francaux M., Fayt A., Sturbois X. A new procedure to determine external power output during handrim wheelchair propulsion on a roller ergometer : A reliability study. Int J Sports Med 1996; 17: 564-571.
12 Hoffman M.D., Millet G.Y., Hoch A.Z., Candau R.B. Assessment of wheelchair drag resistance using a coasting deceleration technique. Am J Phys Med Rehabil 2003; 82, 11: 880-889.
13 Coutts K.D. Dynamic characteristics of a sport wheelchair. J Rehabil Res Dev 1991; 28, 2: 45-50. 14 Coutts K.D. Dynamics of wheelchair basketball. Med Sci Sports Exerc 1992; 24, 2: 231-234.
15 Coutts K.D. Drag and sprint performance of wheelchair basketball players. J Rehabil Res Dev 1994; 31, 2: 138-143.
16 de Saint Rémy N., Vaslin P., Dabonneville M., Martel L., Gavand A. Dynamique de la locomotion en fauteuil roulant manuel : influences de la masse totale et de sa répartition antéropostérieure sur la résultante des forces de freinage. Science & Sports 2003 ; 18, 3 : 141-149
17 Coutts K.D. Kinematics of sport wheelchair propulsion. J Rehabil Res Dev 1990 ; 27, 1 : 21-26.
18 Cooper R.A. An exploratory study of racing wheelchair propulsion dynamics. Adapt Phys Act Q 1990; 7: 74-85.
19 de Saint Rémy N. (2005) Modélisation et détermination des paramètres biomécaniques de la locomotion en fauteuil roulant manuel. [Ph.D. Thesis] Clermont-Ferrand : Université Blaise Pascal ; 2005, p 1-232.
20 Sauret C., de Saint Rémy N., Vaslin P., Cid M., Dabonneville M., Kauffmann P. Theoretical comparison of the resultant braking force applied on a manual wheelchair within a propulsion cycle on the field and on laboratory ergometers. AMSE journal Modelling C 2006; 67, supp Handicap 2006 : 43-52.
21 Vaslin P., Dabonneville M. Use of a 3D accelerometer for kinetic analysis of wheelchair propulsion. Proc XIIth Conference of the European Society of Biomechanics. 28-30 August 2000; Dublin ; Ireland ; 2000 ; p. 345.
22 Sauret C., Vaslin P., Dabonneville M., Cid M. Conséquence de la modélisation du tronc et des mouvements du sujet sur la résultante des forces de freinage lors de la propulsion en fauteuil roulant manuel. Proc. Journée Thematique de la société de biomécanique : "Biomécanique du mouvement et Handicap Moteur". 11 mai ; Lyon, France ; 2005.
23 Winter D.A. Anthropometry. In Biomechanics and motor control of human movement. Wiley Interscience Publication, New York ; 1990, p. 51-74.
24 DiGiovine C.P., Cooper R.A., DiGiovine M.M., Boninger M.L., Robertson R.N. Frequency analysis of kinematics of racing wheelchair propulsion. IEEE Trans Rehab Eng 2000; 8, 3: 385-393.
25 Cooper R.A., DiGiovine C.P., Boninger M.L., Shimada S.D., Koontz A.M., Baldwin M.A. Filter frequency selection for manual wheelchair biomechanics. J Rehabil Res Dev 2002; 39, 3: 323-336.
26 Vanlandewijck Y.C., Spaepen A.J., Lysens R.J. Wheelchair propulsion efficiency: movement pattern adaptations to speed changes. Med Sci Sports Exerc 1994 ; 26, 11 : 1373-1381.
27 Vinet A., Bernard P.L., Ducomps C., Selshow O., Le Gallais D., Micallef J.P. A field deceleration test to assess total wheelchair resistance. Int J Rehab Res 1998; 21: 397-401.
hal-00643866, version 1 - 23 Nov 201