This project is funded by the European Union under the 7th Research Framework Programme (theme SSH) Grant agreement nr 290752. The views expressed in this press release do not necessarily reflect the views of the European Commission.
Working Paper n° 46
B
RAZIL
’
S DEVELOPMENT COOPERATION
:
FOLLOWING IN
C
HINA
’
S AND
I
NDIA
’
S FOOTSTEPS
?
Kiel Institute for the World Economy ― IFW
Finn-Ole Semrau; Rainer Thiele
Brazil’s development cooperation: Following in China’s and India’s
footsteps?
by
Finn-Ole Semrau
Rainer Thiele*
Abstract: The increasing importance of donor countries operating outside of the OECD’s
Development Assistance Committee (DAC) challenges the existing international aid architecture. In particular, non-DAC donors are suspected to provide aid solely based on self-interest without caring about recipients’ need and merit. In this paper, we empirically investigate the aid allocation of one major non-DAC donor, Brazil. We find that Brazil’s development cooperation is still predominantly shaped by historic and cultural ties to the Lusophone world and Latin America, while broader political and economic motives play a negligible role. To some extent, Brazil also takes recipients’ need and governance into account. This broadly corroborates previous results for China and India, strengthening the conclusion that non-DAC donors are not as different from DAC donors regarding their aid motives as one might suspect.
* Corresponding Author: Kiel Institute for the World Economy
Kiellinie 66 D-24105 Kiel Germany Email: [email protected]
Funding from the European Commission under the 7th Research Framework Program (NOPOOR, grant agreement no. 290752) is gratefully acknowledged.
1 Introduction
The increasing importance of donor countries operating outside of the OECD’s Development Assistance Committee (DAC) challenges the existing international aid architecture. These donors may be unwilling to adhere to the rules and procedures of the DAC framework, but may rather follow their own strategies. In particular, non-DAC donors are suspected to provide aid unconditionally without caring about recipients’ need and governance. Naím (2007), for example, calls China a “rogue” donor only pursuing its economic and political self-interest. China is also the main driving force behind the recently founded BRICS bank1, which many see as a potential counterweight to established Western-dominated institutions such as the IMF and the World Bank. Brazil and India are further donors among the BRICS with an increasingly global reach of aid activities.
Against this background, the following research questions can be raised: Is the allocation of aid from non-DAC donors significantly different from that of DAC donors? And how do non-DAC donors differ from each other in their aid allocation decisions? While ample evidence on aid allocation exists for the group of DAC donors (e.g. Clist, 2011; Hoeffler and Outram, 2012), evidence is less encompassing for donors outside of the DAC. Most notably, two previous case studies for China and India (Dreher and Fuchs, 2016; Fuchs and Vadlamannati, 2013) suggest that the aid allocation by “new” and “old” donors appears to be more similar than one might suspect. Both donors do, for example, not indiscriminately support autocratic or otherwise badly governed countries. The remaining major donor among the BRICS – Brazil – has not yet been subject to a thorough quantitative investigation concerning its aid motives. Dreher et al. (2011) and Mwase (2011) have included Brazil in their pooled regressions, but cover only a very small subsample of Brazil’s foreign aid program. Their results can thus at best be regarded as suggestive.
This paper aims to fill the existing empirical research gap using project-level aid data from the AidData initiative (Tierney, et al., 2011). Brazil is an interesting case to study because of its particular foreign policy guidelines. On the one hand, it adheres to the principle of non-interference with the partner countries’ domestic affairs (Burges, 2014). On the other hand, it claims to be ready to take more responsibility for international development and to share its own experiences with successful social programs such Zero Fome or Bolsa Familia (IPEA, 2011). Brazil is not literally a new donor, but its development cooperation was traditionally limited to neighbors in Latin America and the PALOP2 countries. Only under Luiz Inácio Lula da Silva, who was president between 2003 and 2010, the
1The acronym BRICS stands for the five emerging economies Brazil, Russia, India, China and South Africa. 2
PALOP is the acronym for países africanos de língua oficial portuguesa. The PALOP is an interstate organization to support each other in culture, education, and to protect the Portuguese language. Members are: Angola, Mozambique, Guinea-Bissau, Cape Verde and, São Tomé and Principe. In 2014, the five African members founded a new institution FORPALOP, which includes the PALOP.
coverage of recipient countries increasingly broadened and development cooperation became a global foreign-policy tool (Cabral, et al., 2014, p. 187; De la Fontaine, 2013, pp. 142-144).
The remainder of the paper is structured as follows. Section 2 introduces the data employed in the empirical analysis and provides some descriptive statistics. Hypotheses concerning Brazil’s aid motives are derived in Section 3, while Section 4 explains the econometric approach and presents the regression results. Section 5 summarizes the main findings and discusses Brazil’s development cooperation in the context of the emerging international aid architecture.
2 Aid data and descriptive analysis
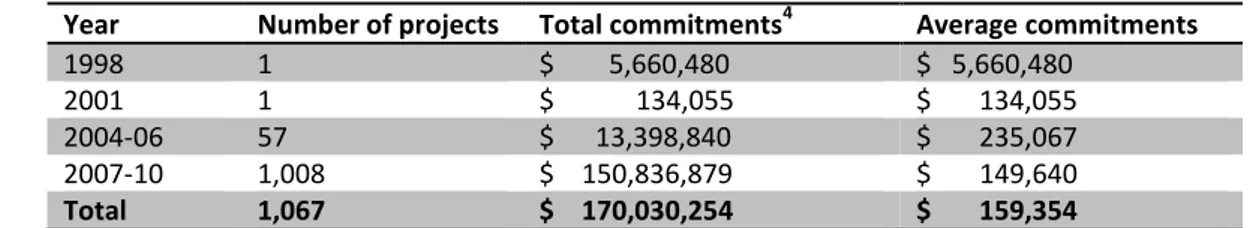
The dataset we use covers aid projects by Brazil until 2010; project-level data after 2010 is not available.3 Table 1 presents the number of projects, the total amount of commitments, and the average commitment amount of the projects in a particular time range. All amounts are in constant 2009 US$.
Table 1: Technical cooperation of the ABC
Year Number of projects Total commitments4 Average commitments 1998 1 $ 5,660,480 $ 5,660,480
2001 1 $ 134,055 $ 134,055 2004-06 57 $ 13,398,840 $ 235,067 2007-10 1,008 $ 150,836,879 $ 149,640 Total 1,067 $ 170,030,254 $ 159,354
Source: own calculations based on AidData 2.1.
The dataset covers 1,067 projects.5 All projects are financed by the ABC and belong to Brazil’s technical cooperation. According to Burges (2014, p. 357), technical cooperation is the part of Brazil’s international development cooperation most commonly associated with ODA. Hence, a focus on it should provide an accurate account of Brazil’s aid allocation. The projects add up to a volume of about US$ 170 million and have an average commitment amount of US$ 159,354. The amount is likely to underestimate the total amount of Brazil’s spending, because it does not include in-kind expenditures by many other Brazilian institutions. Based on two published surveys of the Instituto de
Pesquisa Econômica Aplicada (IPEA, 2011; IPEA, 2014), the OECD (2014a) estimates that Brazil spent
about US$ 500 million of ODA-like foreign aid in 2010. This renders it a medium-sized donor on a similar level as Poland, which spent US$ 472 million in 2013.
3
In response to our request for more recent project-level data, AidData representatives stated: “Unfortunately updates to the Brazil data are no longer available. We have been in contact with Brazil's ABC, but the agency has decided to no longer make project-level data available.”
4
For four projects the corresponding commitment amount is not included. In all cases the total project costs in constant 2009 US$ are used.
5 Nine projects are excluded, because the receiving countries were not on the list of ODA recipients in 2006. These projects were located in Japan, Bahamas, and France and add up to US$ 211,029.
Our analysis focuses on the time period 2007-2010. This excludes 57 projects which were implemented between 2004 and 2006. The reason for excluding these projects is severe measurement error: according to ABC reports Brazil implemented 283 technical cooperation projects between 2004 and 2006, which is clearly more than our dataset covers (Inoue & Vaz, 2012, p. 512). The dataset contains 566 projects for the year 2010. This large number partly reflects that AidData allocates all projects that were implemented before, but were still in execution in 2010, to that year. Hence, yearly commitments and number of projects are not directly interpretable. Projects may be included even though they were implemented before 2007. However, since ABC mainly focuses on projects with rather short-time horizons this should only constitute a minor drawback.
Brazil’s aid commitments between 2007 and 2010 as recorded by AidData correspond to an average yearly amount of US$ 37.7 million. For comparison, IPEA (2010, p. 21; 2014, p. 31) reckons that the amount spent was on average US$ 33 million between 2005 and 2009 and US$ 45.5 million in 2010. The small difference between the two sources indicates that our sample is representative of Brazil’s technical cooperation. A large gap between the mean of project commitment (US$ 149,640) and the median (US$ 34,461) points to the presence of outliers. The by far highest commitment - US$ 26.5 million to Mozambique - is about 179 times higher than the mean.
The time period covered falls into the presidency of Lula were Brazil expanded its aid program in terms of both committed amounts and regional coverage. The intensity map shown in Figure 1 illustrates the wide range of recipients of Brazilian foreign aid.
In financial terms, the PALOP members dominate with more than half of the total technical assistance channeled to them. Additionally, the Lusophone country Timor-Leste received 7 % of total commitments. The remaining budget was mainly directed to Latin American countries. In total, 405 projects with commitments of US$ 31.1 million were located in Latin America. Taken together, the Lusophone world and Latin America accounted for a share of about 83 % of total commitments. Another 11 % was channeled to other African countries.
Table 2 presents the top-20 recipient countries with respect to commitments. Furthermore, it shows whether or not a country is part of Latin America, and whether or not it is part of the Lusophone world. The ranking of recipients is based on to aid projects that can be traced back to specific countries and excludes regional projects. 82 different countries received aid from Brazil between 2007 and 2010. Mozambique was by far Brazil’s main recipient, receiving about 32 % of total commitments. Under the top-seven recipients Haiti is the only country where Portuguese is no official language. Only five of the top 20 recipients (Algeria, Senegal, Gabon, Benin, and Kenya) are neither located in Latin America nor part of the Lusophone world. Senegal has a special role among
these countries, as it is an associated observer of the Community of Portuguese Language Countries (CPLP), an intergovernmental organization for friendship and cooperation among Lusophone countries founded in 1996. In addition to Brazil, Portugal and the PALOP members, the CPLP also includes Timor-Leste and Equatorial Guinea. Equatorial Guinea only recently joined the CPLP in 2014 and received an amount of US$ 97,217 for two projects. However, Senegal and Equatorial Guinea are usually not classified as part of the Lusophone world, because Portuguese is only used to a limited extent and neither has been a colony of Portugal.
Figure 1: Intensity map of Brazil’s aid allocation between 2007 and 2010
Source: own calculations with ESRI (2011) based on DIVA-GIS (2011) and AidData 2.1.
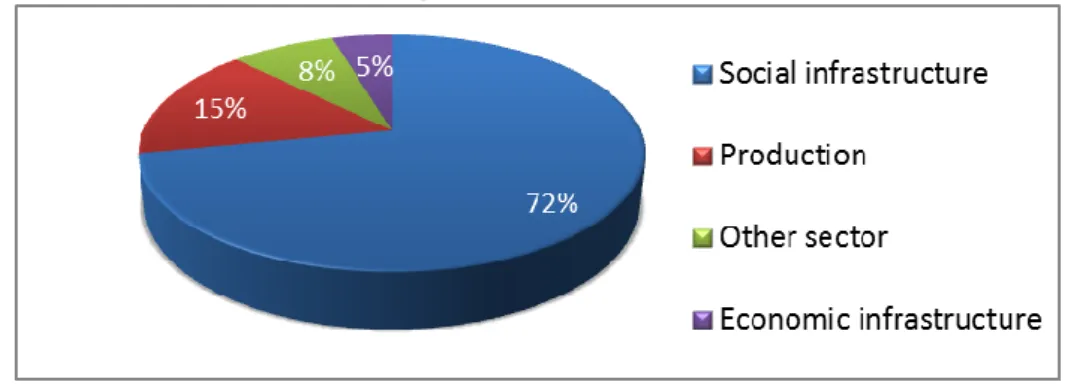
Table 3 displays the top 10 purposes for which Brazilian aid was used during the period under consideration. Brazil was clearly most active in education, health, and agriculture. One might argue that this is in accordance with Brazil’s own development experience. It has successfully implemented policies such as Bolsa Famila that successfully promote social development. And considering that Brazil is a leading exporter of agricultural goods, it has a comparative advantage in providing agricultural assistance over other donors (European Parliament, 2012, p. 11). Figure 2 illustrates Brazil’s strong focus on social infrastructure. About 72 % of the technical cooperation was directed to projects related to social infrastructure. This is a higher share than in any DAC donor country; on average, DAC donors allocated 38.7 % to the social sector (OECD, 2014a). The second largest recipient sector of Brazilian aid was production – predominantly agriculture – with a share of 15 %.
Other sectors only play a minor role. This sectoral pattern of aid allocation is in stark contrast to China’s and India’s, the other two major BRICS donors. China in particular spends a large part of its aid budget on economic infrastructure, which is in line with the announced focus of the new BRICS bank. To a lesser extent, this also applies to India, but the projects it supports are mainly related to hydropower in its own region and cross-border connections with a direct benefit for India.
Table 1: Top 20 recipients of Brazilian aid, 2007-2010
Recipient countries (2007-10) Commitment amount % of commitment Lusophone world Latin America Mozambique $ 48,332,688 33.31 % + / Haiti $ 13,465,233 9.28 % / +
São Tomé & Principe $ 13,021,748 8.98 % + / Timor-Leste $ 10,959,290 7.55 % + / Guinea-Bissau $ 8,492,891 5.85 % + / Cape Verde $ 7,038,839 4.85 % + / Angola $ 6,595,882 4.55 % + / Paraguay $ 3,999,263 2.76 % / + Algeria $ 3,326,652 2.29 % / / Senegal $ 2,794,873 1.93 % / / Uruguay $ 2,172,536 1.50 % / + Cuba $ 2,099,984 1.45 % / + Bolivia $ 1,934,430 1.33 % / + Benin $ 1,774,583 1.22 % / / Ghana $ 1,709,682 1.18 % / / Peru $ 1,262,742 0.87 % / + Kenya $ 1,179,128 0.81 % / / Argentina $ 1,160,006 0.80 % / + Costa Rica $ 1,124,527 0.78 % / + Panama $ 789,531 0.54 % / + … … … … … 82 countries $ 145,087,382 100 % 7 19
Source: own calculations based on AidData 2.1.
Table 2: Top 10 purposes of Brazil’s foreign aid allocation, 2007-2010
DAC 5 name and code (2007-10) Commitment amount % of commitment Number of projects % of projects Education, level unspecified (111) $ 29,081,178 19.68 % 27 2.72 % Agriculture (311) $ 16,334,816 11.05 % 167 16.85 % Basic health (122) $ 15,435,613 10.44 % 100 10.09 % Secondary education (113) $ 14,301,140 9.68 % 26 2.62 % Other social infrastructure and services (160) $ 13,053,716 8.83 % 72 7.27 % Government and civil society, general (151) $ 10,160,216 6.87 % 98 9.89 % Health, general (121) $ 9,309,804 6.30 % 76 7.67 % Other multisector (430) $ 5,841,133 3.95 % 51 5.15 % Basic education (112) $ 4,898,948 3.31 % 8 0.81 % Population policies/ programmes and
reproductive health (130)
$ 4,292,265 2.90 % 44 4.44 %
… … … … …
33 different purposes $147,797,7886 100 % 991 100 %
Source: own creation based on AidData 2.1.
6 For 17 projects, no information about the purpose was available. They add up to total commitments of US$ 3 million.
Figure 2: Sector allocation of Brazil’s foreign aid, 2007-2010
Source: own presentation based on AidData 2.1.
The fact that most spending was directed to projects of the social sector provides a first indication that Brazil takes recipient need into account when giving aid. In the next section, we derive various hypotheses concerning the motives behind Brazil’s aid allocation. The hypotheses are then tested econometrically.
3 Hypotheses on Brazil’s foreign aid allocation
We depart from the conventional aid allocation framework that distinguishes three kinds of donor motives. Indicators of need such as low per-capita income (recipient need) and local institutions and policies that may render aid more effective (recipient merit), together with the (economic and political) self-interest of donors constitute the core elements of this framework. In what follows we discuss whether these motives are likely to shape Brazil’s aid allocation.
Recipient need
In the official IPEA (2014, p. 25) report it is stated that Brazil’s technical cooperation “aims to produce positive impacts on populations, change and raise living standards, transform realities, promote sustainable growth and contribute to social development.” Its cooperation is supposed to be demand-driven and to offer solutions tailored to beneficiaries’ needs (Cabral, et al., 2014, pp. 188-189). Furthermore, the Brazilian government emphasizes that it is ready to share its knowledge with other countries (IPEA, 2011, pp. 9-16). This might help explain the strong focus on aid in social infrastructure, where Brazil has accumulated experience during its own recent development. The country has also responded to humanitarian needs during emergency situations. It was for instance one of the first countries that provided assistance after the earthquake in Haiti in 2010 (Burges, 2014). A regression analysis by Dreher et al. (2011) suggests that Brazil’s regard for recipient need is more than mere rhetoric. They find a negative relation between (log) GDP per capita in PPP and the amount of aid received, and positive relation between (log) people affected by disasters and the amount of aid received. Both explanatory variables are significant at the one percent level. However,
their estimates are based on a very small subsample of Brazil’s foreign aid program and can thus only be regarded as suggestive.
In sum, there is reason to believe that recipient needs affect Brazil’s aid allocation process. Hence, our first hypothesis is:
Hypothesis 1 - Brazil’s foreign aid is needs-oriented.
Recipient merit
According to John de Sousa (2010, p. 3), South-South Cooperation (SSC) remains a crucial element in Brazilian foreign policy. A guiding principle of SSC is to respect national sovereignty and not to interfere with the partners’ domestic affairs. Accordingly, the recipients’ institutional framework should play no role in the aid allocation decision. The foundation of the New Development Bank in 2014 by the BRICS may be viewed as the most recent manifestation of Brazil’s focus on SSC. Brazil has also hesitated to get involved in fora on global aid governance dominated by OECD countries; it is no signatory of the Paris Declaration in 2005 and the Accra Agenda in 2008. There are, however, indications that it has recently taken steps towards closer collaboration with traditional OECD/DAC donors, attending for instance the High Level Forum in Busan in 2011 (Cabral, et al., 2014, p. 185). The traditional donors have repeatedly stressed the importance of good governance for aid effectiveness, but their record of taking recipient merit into account when giving aid is weak (e.g. Hoeffler and Outram, 2011; Nunnenkamp and Thiele, 2013). This is unlikely to have provided a strong enough example to change Brazil’s view. By contrast, Brazil’s history – it turned from a military dictatorship to a democracy in 1985 and today respects basic values such as the protection of democratic and human rights – may have rendered it more inclined to give aid to countries that also respect these values (John de Sousa, 2010, p. 3). Hence,
Hypothesis 2:
Brazil’s aid allocation is not based on a general consideration of recipient merit, but may be guided by basic values such as democracy and human rights.
Political and commercial self-Interests
Various authors have expressed doubts concerning Brazil’s rhetoric of providing development assistance mainly for altruistic reasons. According to Burges (2014, p. 356), recipient need does not trump considerations of national interests. Likewise, Cabral and Weinstock (2010, p. 2) state that Brazil’s aid allocation is strongly driven by self-interests:
“Foreign policy and, to some extent, economic interests have played a major part in energizing Brazil’s development cooperation. The country wants a permanent seat on the UN Security Council and to have influence in international relations, in line with its successful economic trajectory.”
The suspicion that national interests determine Brazil’s foreign aid allocation is supported by the institutional setting of the aid allocation process. The ABC is responsible for the coordination of the technical cooperation, but as a department of the Ministry of Foreign Affairs (Itamaraty) without an own budget its autonomy is limited (Cabral & Weinstock, 2010, p. 2). While the ABC is physically separated from the Itamaraty, its head is a mid-career diplomat from the Itamaraty who has to report back in case of major decisions. For future career advancement the head must return to the Itamaraty (Burges, 2014, p. 357).
The descriptive analysis above reveals that most of Brazil’s technical cooperation between 2007 and 2010 was dedicated to Lusophone and Latin American countries. The main objectives of the Community of Portuguese Language Countries (CPLP) are in line with Kragelund’s (2008) assertion that Brazil’s development cooperation serves as a foreign-policy tool. It aims for example at political and diplomatic cooperation between its members to strengthen the community’s presence – and the use of the Portuguese language – in the international arena. As concerns Latin American countries, Brazil’s ambition is to be the leading regional power and to keep the United States and Canada out of Latin American affairs to the extent possible (Burges, 2014).7 It is less clear-cut why Brazil allocates small amounts of aid to numerous other recipient countries.8 One reason might be that Brazil’s aid program is a means of lobbying for a reform of the UN and a permanent seat in the UNSC (Sousa, 2010).
Beside political considerations, trade interests and access to resources might affect aid allocations. Trading volumes with most recipient countries are too small to expect a major impact donor decisions. This is also true for the Lusophone countries, only two of which – Angola and Mozambique – are among Brazil’s top 100 trading partners (IMF, 2015). Trade interests are potentially more likely to explain the focus on Latin America. Argentina is Brazil’s third biggest trading partner, and Venezuela, Chile, Panama, and Mexico are among the top ten. Yet, as shown in the descriptive analysis, none of these countries is among Brazil’s top 15 aid recipients. As concerns access to resources, it should be noted that Brazil itself has a large endowment of natural resources and its energy security is accomplished by a mix of renewables, mainly hydropower and fossil fuels. It also has oil reserves and about ten years ago further huge offshore oil fields were discovered (Viola &
7
A complementary explanation for Brazil’s focus on Lusophone and Latin American countries is that it has a comparative advantage in cooperating with these countries due to cultural and language ties.
8To assess whether Brazil has specific motives for giving aid to these countries, we run separate regressions below where we exclude all Latin American and Lusophone countries.
Basso, 2014). Brazil’s aid allocation is thus highly unlikely to be determined by a quest for natural resources.
In summary, we can state:
Hypothesis 3:
Brazil’s aid allocation is driven by political interests, aiming for regional leadership and more influence in international institutions; export promotion only plays a minor role and energy security does not influence Brazil’s aid allocation decision.
4 Econometric analysis
4.1 Estimation Method
We apply the Poisson Pseudo Maximum Likelihood (PPML) approach to estimate the determinants of Brazil’s aid allocation. Silva and Tenreyro (2006) show that PPML outperforms Tobit and OLS in the presence of heteroscedasticity and many zero observations, which is relevant for donors concentrating on a subset of potential recipient countries. The only major conceptual drawback of PPML is that as a one-step estimator it does not distinguish between the selection and the allocation stage of the donor’s decision. In principle, therefore, Heckman’s two-step estimator would be a superior option (Neumayer, 2003). Yet, we decided against using the Heckman procedure because it was impossible to come up with a convincing exclusion restriction, i.e. a variable that determines which recipients are selected but has no impact on the aid amounts given at the allocation stage. In the estimation, a cross-section rather than a time series approach is employed. This is mainly because aid commitments are volatile from year to year and the explanatory variables cannot be assumed to explain this volatility. Furthermore, due to the methodology of AidData 2.1 there is an overestimation of the number of projects implemented in 2010. Therefore, the aid commitments a particular recipient received between 2007 and 2010 are aggregated and the share of aid commitments of a recipient during this period is taken as the dependent variable. The estimated equation is:
𝑎𝑖𝑑𝑠ℎ𝑎𝑟𝑒𝑖 = 𝑒𝑥𝑝(𝑥𝑖⊺ß)𝜀𝑖 (1)
where 𝑎𝑖𝑑𝑠ℎ𝑎𝑟𝑒𝑖𝑗𝑡 is the share of total aid commitments a country i received from Brazil during the
time period t, here 2007-2010. Only countries on the DAC list of 2006 – 145 countries in total – are taken as possible recipients.𝑥𝑖𝑗𝑡 is a vector of explanatory variables for recipient i . The matrix ß
4.2 Explanatory variables
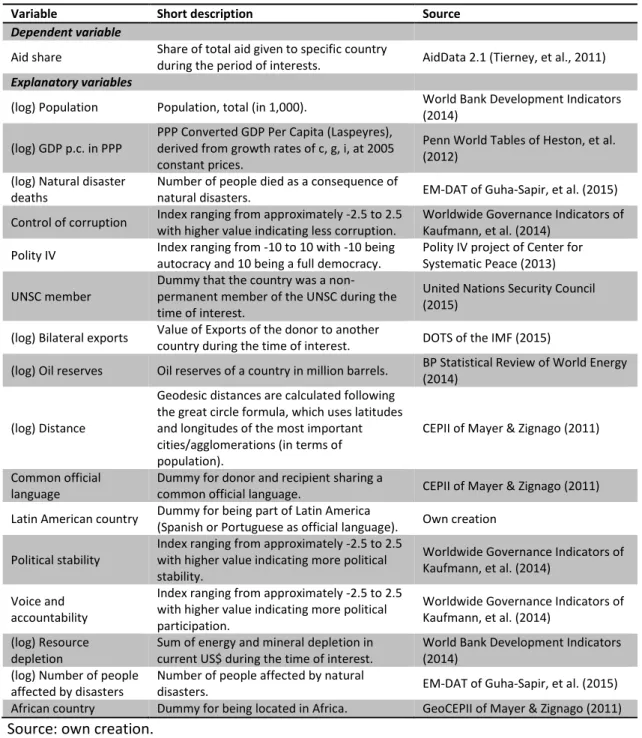
Our explanatory variables are grouped into the three categories mentioned above: recipient need, institutional framework, and commercial as well as political self-interests. The choice of variables is based on the established aid allocation literature. Table A1 shows a full variable list including the respective sources.
Recipient need
The most commonly used proxy of recipient need is GDP per capita in purchasing power parities (PPP). It is readily available and captures in general terms the extent to which recipient countries lack own resources. An altruistic donor may also give more aid to countries in emergency situations. As a second indicator of need, the (log) number of people who died as a result of natural disasters within the period 2007 to 2010 is therefore included. The Centre for Research on the Epidemiology of Disasters provides a dataset (EM-DAT) covering all disasters where at least 10 people died or 100 people were affected (Guha-Sapir, et al., 2015). The number of people who died in natural disasters is our preferred indicator, because it does better proxy the urgency of an emergency situation, but we also include the (log) number of people affected by natural disasters in a robustness check. The two variables are highly correlated – the correlation coefficient over the period under consideration is 0.71 – but to some extent measure different aspects of emergency situations.9
Institutional framework
We distinguish two dimensions of a recipient country’s institutional framework. On the one hand, donors often state that they honor democratic institutions in recipient countries when deciding on how much aid to give. On the other hand, donors may prefer recipients where governments are perceived to be fairly stable, efficient and clean. Both dimensions are often related to each other, but some countries are no democracies and nonetheless widely regarded as stable and efficient. Singapore is a case in point: it is ranked by Transparency International to be the seventh less corrupt country, but is classified by the polity IV measure as an autocratic regime (Transparency International, 2014; Center for Systematic Peace, 2013). To account for both dimensions, we employ the control of corruption index, one of the worldwide governance indicators developed at the World Bank (Kaufmann et al., 2014),10 and the polity IV measure of the Center for Systematic Peace (2013). The latter indicates where a recipient country is located between the extremes of full autocracy and full democracy. A correlation coefficient of only 0.32 between the two measures indicates that they
9 For example, of all people affected by disasters between 2007 and 2010, 17 % were affected by floods, whereas of all people who died in disasters only 4 % did so in a flood. A similar divergence is observable for droughts, which accounted for 20% of those affected by disasters and 3% of disaster deaths.
10Among the worldwide governance indicators, we opt for control of corruption as it is the element of governance that has been given particular attention by donors (e.g. Nunnenkamp and Thiele, 2013).
capture different aspects of institutional quality and can thus be included jointly in the regression analysis.
In a robustness check, we substitute the control of corruption index by the political stability measure of Kaufmann et al. (2014), which reflects perceptions of the likelihood that the government will be destabilized or overthrown by unconstitutional or violent means, including politically-motivated violence and terrorism. As an alternative to the polity IV measure we use the voice and accountability index, also part of the Kaufmann et al. (2014) indicators, which captures the extent to which a country's citizens are able to participate in selecting their government, as well as freedom of expression, freedom of association, and a free media.
Commercial and political interests
In the baseline model, a donor’s commercial interests are proxied by the value of exported goods to the recipient countries and the recipient’s proven oil reserves. Resource depletion, defined as the sum of the value of mineral and energy depletion of a recipient country, is alternatively used as a broader proxy of resource endowments.
To proxy Brazil’s political interests, we include the distance between donor and recipient country, a dummy for being part of Latin America, a dummy for having a common official language, and a dummy for membership in the United Nations Security Council (UNSC) in at least one year between 2007 and 2010 (Mayer & Zignago, 2011; United Nations Security Council, 2015). The distance variable partly overlaps with being part Latin America, indicated by a correlation coefficient of 0.55, but it has a distinct interpretation as a proxy for the costs of giving foreign aid, while the Latin America dummy reflects Brazil’s status as a regional power.11 The dummy for sharing a common language with Brazil is identical with being a former Portuguese colony for all potential recipients. It is thus meant to capture cultural and historic relations between Brazil and the Lusophone world. Membership in the UNSC is a variable that captures political interests at the global level. Ten of the 15 seats in the UNSC are held by rotating members serving two-years terms. Kuziemko and Werker (2006, p. 924) find that members of the UNSC get more foreign aid from the United States and the United Nations. By giving more foreign aid to UNSC members donors buy votes in the Security Council. This may also be relevant for Brazil as it is actively seeking allies at the global stage (see above).
In addition, we control for the size of the recipient countries’ population. This is mainly to account for the fact that, other things being equal, more populous recipients should receive a larger share of Brazil’s aid budget. Yet, the population variable also has a political interpretation. According to
11
We also test whether outside its main area of aid activities in Latin American and Lusophone countries, Brazil has a specific African focus as the descriptive analysis would suggest. This is done by introducing an Africa dummy.
Radelet (2006, p. 6), there is a systematic small country bias in aid allocations. Bueno de Mesquita and Smith (2009, p. 332) argue that it is more cost efficient to prefer small recipient countries when the donor objective is to seek political support.
Potential endogeneity of explanatory variables
All time-varying explanatory variables are lagged one year to mitigate endogeneity concerns. Specifically, reverse causality may be an issue to the extent that aid is effective in raising GDP per capita or improving governance. However, it is important to recall that we assess effects on aid commitments, rather than aid disbursements. Aid is often committed for projects spanning several years so that it is disbursed in several instalments throughout the project’s life. This means that, by using aid commitments, we implicitly account for longer lags than just one period between the observation of need or merit and the time of the arrival of disbursed aid. This does not necessarily resolve all our endogeneity problems, but given that the aid allocation literature in general ‘does not so far offer smoking-gun evidence regarding causality’ (Dreher et al. 2015: 476), we refrain from employing an instrumental variable approach. Accordingly, as usual in aid allocation studies, our regression results are not open to strong causal interpretations.
4.3 Results
Table 5 presents the main regression results with the share of total aid commitments to a particular recipient as dependent variable and standard errors in parentheses. Column 1 depicts the baseline model, while columns 2 to 6 report tests for the robustness of results employing alternative proxies as outlined in the previous section. The baseline model covers 117 observations. 28 observations are excluded, mostly small countries with missing values for the polity IV measure. Among them is one of Brazil’s major aid recipients, São Tomé & Principe. Nonetheless, the regression provides strong support for Brazil’s focus on Lusophone countries. The coefficient is statistically significant at the one percent level and also points to a sizeable quantitative effect: Switching from not being part of the Lusophone world to being part of it is associated with an increase in the average share of foreign aid received by 4.4 percentage points. Likewise, the Latin America dummy is significant at the one percent level. Latin American countries can on average expect to receive a share of Brazilian aid that is 2.3 percentage points higher than the share of non-Latin American countries. The significant results for these two groups hold across all specifications. In all regressions, the distance variable is statistically insignificant, suggesting that foreign aid is allocated to Latin American countries because of regional ties rather than low costs for providing aid.
Table 3: Determinants of Brazil’s aid allocation (2007-10), PPML
Source: own calculations.
The political considerations underlying Brazil’s foreign aid allocation appear to be limited to Latin American and Lusophone countries. This is illustrated by the lacking significance of the UNSC membership dummy. Furthermore, Brazil has no special focus on smaller countries, where it is cheaper to “buy” influence.
(1) (2) (3) (4) (5) (6)
VARIABLES Aid share Aid share Aid share Aid share Aid share Aid share
(log) Population 0.369** 0.430** 0.367** 0.097 0.395*** 0.337
(0.144) (0.179) (0.149) (0.169) (0.145) (0.218)
(log) GDP p.c. in PPP -0.412* -0.254 -0.407 -0.697*** -0.760*** -0.660**
(0.250) (0.390) (0.283) (0.245) (0.262) (0.302)
(log) Natural disasters deaths 0.120 0.119 0.150 0.111 0.082
(0.120) (0.127) (0.117) (0.141) (0.104) Control of corruption 0.150 0.090 -0.460 0.414 0.024 (0.277) (0.313) (0.595) (0.265) (0.255) Polity IV 0.010 0.018 0.013 0.011 0.007 (0.040) (0.046) (0.038) (0.044) (0.035) (log) Distance -0.544 -0.502 -0.625 -0.293 -0.363 -0.306 (0.412) (0.440) (0.397) (0.443) (0.410) (0.442) UNSC member -0.092 -0.150 -0.195 -0.207 -0.234 0.004 (0.443) (0.483) (0.437) (0.400) (0.449) (0.412) Common official language 4.415*** 4.365*** 4.029*** 4.081*** 4.378*** 4.482***
(0.404) (0.437) (0.411) (0.434) (0.412) (0.370)
(log) Bilateral exports -0.073 -0.122 -0.145 0.035 -0.024 0.024
(0.095) (0.119) (0.098) (0.084) (0.090) (0.075)
(log) Oil reserves -0.090* -0.097* -0.042 -0.019 -0.085*
(0.053) (0.051) (0.054) (0.081) (0.047)
Latin American country 2.285*** 2.605*** 2.328*** 2.160*** 2.652*** 2.676***
(0.699) (0.597) (0.679) (0.681) (0.814) (0.964)
African country 0.463
(0.764)
Political stability 0.390**
(0.168)
Voice and accountability 0.886
(0.879)
(log) Resource depletion -0.023
(0.021)
(log) People affected by natural disasters -0.005
(0.079) Constant 2,854 0.859 4,251 4,226 3,586 2,422 (3.127) (4.810) (3.100) (3.945) (3.399) (2.777) Observations 117 117 117 135 115 117 Pseudo R-squared 0.688 0.689 0.693 0.706 0.686 0.683 Log pseudolikelihood -74.36 -74.17 -73.19 -78.68 -74.55 -75.57 Chi-squared 386.8 433.6 512.3 476 278.7 538.3
Robust standard errors in parentheses *** p<0.01, ** p<0.05, * p<0.1
In accordance with hypothesis 3, the existence of commercial motives is not supported by the regression analysis. Neither the volume of Brazilian imports nor resource endowment appear to have an influence on the share of aid received. The coefficient of oil reserves is negative throughout and even significant in some specifications, while resource depletion, the alternative proxy of recipients’ resource endowments, is negative but insignificant (column 6).
As concerns recipient merit, the bulk of the evidence we obtain confirms the expectation that Brazil’s aid allocation is unaffected by recipient countries’ institutional framework (hypothesis 2): The coefficients of the control of corruption measure and the polity IV index are insignificant throughout. Also, voice and accountability has no significant impact (column 4). Political stability is the only governance indicator for which our results indicate a positive and significant association with received aid shares (column 3).
Evidence in support of a needs-based aid allocation is stronger. The coefficient of GDP per capita is always negative and significant in four out of six specifications, which is in line with hypothesis 1 and the rhetoric of Brazil’s government (Cabral, et al., 2014, pp. 188-189). The effect is fairly small, however: In the base specification, an increase of 10 % in GDP per capita reduces the share of foreign aid received by 0.039 percentage points.12 Column 2 includes an Africa dummy to account for Brazil’s coverage of many African recipients and to assess whether Brazil’s need-orientation is essentially a focus on Africa. The dummy is positive, but not significant, and GDP per capita loses significance. Hence, based on the regression it is not possible to state whether it is relatively low GDP per capita or being part of Africa that determines Brazil’s aid allocation decision. There does not seem to be a special focus of Brazil’s bilateral aid allocation on countries in emergency situations. Emergency as proxied by the number of people who died has a positive sign throughout, but is never significant at conventional levels, while the number of people affected by natural disasters (column 6) is insignificant with a negative sign. This does not mean, however, that there is no emergency aid at all from Brazil. According to Burges (2014, p. 363), most of Brazil’s emergency aid is channeled through UN organizations and not via its technical cooperation.
Overall, while the regression results point to some consideration of recipient need, regional, historical, and cultural ties to former Portuguese colonies and countries of Latin America appear to be the key determinants of Brazil’s aid allocation. The descriptive analysis above revealed that apart from these two groups many other countries (57 in total) are among Brazil’s aid recipients, even though they account for only 14 % of total spending on technical cooperation. This suggests that Brazil is only starting to act as a global player in development cooperation and may well scale up its activities outside the two traditional groups of recipients in the near future. It is therefore interesting
12
to examine whether one can already identify a pattern in Brazil’s aid allocation among these recipients.
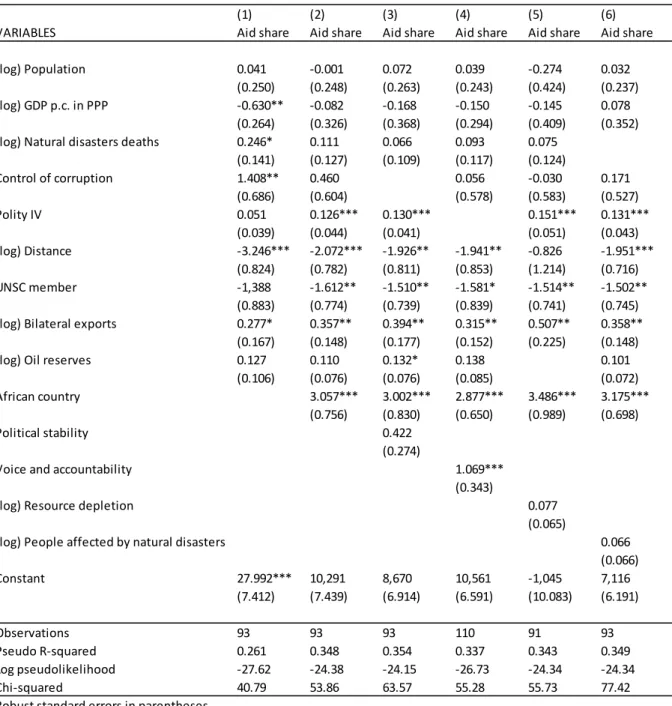
Table 4: Determinants of Brazil’s aid allocation (2007-10), outside of the Lusophone world and Latin
America, PPML
Source: own calculations.
Table 6 presents the regression results if all Lusophone and Latin American countries are excluded. This reduces the number of possible recipients to 120, of which 93 are covered in the first column.
(1) (2) (3) (4) (5) (6)
VARIABLES Aid share Aid share Aid share Aid share Aid share Aid share
(log) Population 0.041 -0.001 0.072 0.039 -0.274 0.032
(0.250) (0.248) (0.263) (0.243) (0.424) (0.237)
(log) GDP p.c. in PPP -0.630** -0.082 -0.168 -0.150 -0.145 0.078
(0.264) (0.326) (0.368) (0.294) (0.409) (0.352)
(log) Natural disasters deaths 0.246* 0.111 0.066 0.093 0.075
(0.141) (0.127) (0.109) (0.117) (0.124) Control of corruption 1.408** 0.460 0.056 -0.030 0.171 (0.686) (0.604) (0.578) (0.583) (0.527) Polity IV 0.051 0.126*** 0.130*** 0.151*** 0.131*** (0.039) (0.044) (0.041) (0.051) (0.043) (log) Distance -3.246*** -2.072*** -1.926** -1.941** -0.826 -1.951*** (0.824) (0.782) (0.811) (0.853) (1.214) (0.716) UNSC member -1,388 -1.612** -1.510** -1.581* -1.514** -1.502** (0.883) (0.774) (0.739) (0.839) (0.741) (0.745)
(log) Bilateral exports 0.277* 0.357** 0.394** 0.315** 0.507** 0.358**
(0.167) (0.148) (0.177) (0.152) (0.225) (0.148)
(log) Oil reserves 0.127 0.110 0.132* 0.138 0.101
(0.106) (0.076) (0.076) (0.085) (0.072)
African country 3.057*** 3.002*** 2.877*** 3.486*** 3.175***
(0.756) (0.830) (0.650) (0.989) (0.698)
Political stability 0.422
(0.274)
Voice and accountability 1.069***
(0.343)
(log) Resource depletion 0.077
(0.065)
(log) People affected by natural disasters 0.066
(0.066) Constant 27.992*** 10,291 8,670 10,561 -1,045 7,116 (7.412) (7.439) (6.914) (6.591) (10.083) (6.191) Observations 93 93 93 110 91 93 Pseudo R-squared 0.261 0.348 0.354 0.337 0.343 0.349 Log pseudolikelihood -27.62 -24.38 -24.15 -26.73 -24.34 -24.34 Chi-squared 40.79 53.86 63.57 55.28 55.73 77.42
Robust standard errors in parentheses *** p<0.01, ** p<0.05, * p<0.1
The loss of observations is again mainly driven by the exclusion of small countries, caused by missing values of the polity IV index. From the base specification in column 1, it appears that Brazil’s aid allocation to this group of countries is affected by considerations of recipient need. Both lower GDP per capita and a larger number of natural disaster deaths are associated with an increasing aid share. Yet, as shown in column 2, when including a regional dummy that represents the over 40 African recipients of Brazilian aid, the two variables lose their significance. The Africa dummy is significant at the one percent level and its inclusion markedly improves the fit of the regression. We therefore consider the model specification depicted in column 2 as our preferred one and accordingly also add the Africa dummy in columns 3-6. Our results reported in columns 2-6 consistently show that Brazil’s “residual” aid is targeted to Africa, the poorest continent, rather than focusing on specific needy recipients.
As concerns recipient merit, Brazil’s does not appear to take recipients’ governance efficiency into account when giving aid, which is in line with a policy of non-interference, but tends to prefer more democratic recipients, which may be related to its own fairly recent democratic transition. In all specifications including the Africa dummy, the polity IV index is significant at the one percent level. A one standard deviation increase of the polity IV measure in column 2 increases the expected share of foreign aid received by 0.775 percentage points.13 This corresponds to the difference between Côte d'Ivoire to Bangladesh. Likewise, the alternative democracy indicator, voice and accountability, is significant at the one percent level in the robustness check shown in column 3. By contrast, if the Africa dummy is included, neither control of corruption nor political stability (column 4) is associated with recipients’ aid shares at conventional levels of statistical significance.
In all specifications, export promotion is shown to be among Brazil’s foreign aid motives, confirming John de Sousa’s (2010, p. 2) assertion. As expected, energy security does not turn out to play a major role in Brazil’s aid allocation. The coefficient of oil reserves is marginally significant only in column 4, and if oil reserves are substituted by resource depletion (column 5), the relationship stays statistically insignificant. Our regression analysis does not detect political considerations as proxied by the dummy for recipient countries’ membership in the UNSC between 2007 and 2010; the coefficient of the proxy is even negative throughout. Even though Brazil most likely wants to get a permanent seat in the UNSC, it does not seem to express this by giving more foreign aid to countries with temporarily more global influence. Possibly, Brazil instead tries to forge alliances on the global stage by being present in a large number of developing countries. Spreading aid over many (small) recipients can be cost-effective way of exerting political influence (Bueno de Mesquita and Smith 2009). Cost
13
considerations may also explain why all regressions show that aid shares decline with increasing distance between Brazil and recipient countries.
5 Brazil’s aid allocation in perspective
The analysis above has shown that regional, historical, and cultural ties to former Portuguese colonies and Latin American countries appear to be the key determinants of Brazil’s aid allocation. India shows a similar pattern, concentrating on recipients in the South Asia region and with a common language (Semrau 2015). The aid activities of the major DAC donors and China, by contrast, have a truly global reach. The recent expansion of the set of countries receiving Brazilian aid suggests that Brazil may be moving in the same direction, even though its current economic and political crisis is likely to slow down the process at least temporarily.
Brazil’s aid allocation is partly driven by considerations of recipient need and merit, and partly by self-interest. Like most other donors, it gives more aid to poorer countries. An exceptionally large share of Brazilian aid is spent in the social sector, which is in stark contrast to China’s and India’s focus on economic infrastructure, but also clearly distinguishes Brazil from established DAC donors such as the United States or Japan. As concerns recipients’ institutions, Brazil rewards democratic countries while not accounting for levels of corruption, a pattern known from several DAC donors, and the opposite to China’s behavior. Beyond the two regional foci, export promotion is Brazil’s main selfish aid motive. The same applies to India, whereas China, for example, pursues a broader set of interests including resource security and global political influence.
All in all, our empirical analysis suggests that Brazil exhibits its own mix of selfish and altruistic motives when giving foreign aid, not strictly following the lead of other donors. It corroborates previous evidence from China and India that against widely held believes non-DAC donors are not exclusively pursuing economic and political interests. This strengthens the conclusion that these donors are not as different from DAC donors regarding their aid motives as one might suspect.
References
BP, 2014. BP Statistical Review of World Energy. [Online] Available at:
http://www.bp.com/content/dam/bp/excel/Energy-Economics/statistical-review-2014/BP-Statistical_Review_of_world_energy_2014_workbook.xlsx.
Bueno de Mesquita, B. & Smith, A., 2009. A Political Economy of Aid. International Organizations, 63(2), pp. 309-340.
Burges, S., 2014. Brazil's International Development Co-operation: Old and New Motivations.
Development Policy Review, 32(3), pp. 355-374.
Cabral, L., Russo, G. & Weinstock, J., 2014. Brazil and the Shifting Consensus on Development Co-operation: Salutary Diversions from the 'Aid-effectiveness' Trail?. Development Policy Review, 32(2). Cabral L. and J. Weinstock , 2010. ‘Brazilian technical cooperation for development: drivers,
mechanics and future prospects’, report for ABC and DFID. London: Overseas Development Institute. Center for Systematic Peace, 2013. Polity IV Annual Time-Series, 1800-2013. [Online] Available at: http://www.systemicpeace.org/inscr/p4v2013.xls.
Clist, P. , 2011. 25 Years of Aid Allocation Practice: Whither Selectivity? World Development 39(10): 1724-1734.
De la Fontaine, D., 2013. Neue Dynamiken in der Süd-Süd Kooperation. Indien, Brasilien und Südafrika
als Emerging Donors. Wiesbaden: Springer VS.
DIVA-GIS, 2011. Free Spatial Data. [Online] Available at: http://biogeo.ucdavis.edu/data/world/countries_shp.zip.
Dreher, A., & Fuchs, A., 2016. Rogue Aid? An empirical analysis of china’s aid allocation.
Canadian
Journal of Economics, forthcoming.
Dreher, A., Fuchs, A. & Nunnenkamp, P., 2013. New Donors. International Interactions: Empirical and
Theoretical Research in International Relations, 39(3): 402-415.
Dreher, A., Gehring, K. & Klasen, S., 2015. Gesture Politics or Real Commitment? Gender Inequality and the Allocation of Aid. World Development, 70: 464-480.
European Parliament, 2012. The Role of BRICS in the Developing World. [Online] Available at:
http://bookshop.europa.eu/de/the-role-of-brics-in-the-developing-world-
pbBB3112634/downloads/BB-31-12-634-EN-N/BB3112634ENN_002.pdf?FileName=BB3112634ENN_002.pdf&SKU=BB3112634ENN_PDF&Catalog ueNumber=BB-31-12-634-EN-N.
Fuchs, A., & Vadlamannati, K. C. ,2013. The Needy Donor: An Empirical Analysis of India’s Aid Motives. World Development, 44, 110-128.
Guha-Sapir, D., Below, R. & Hoyois, P., 2015. EM-Dat: International Disaster Database - www.emdat.be. Université Catholique de Louvain - Brussels - Belgium.
Heston, A., Summers, R. & Aten, B., 2012. Penn World Table Version 7.1. Center of Comparisons of
Production, Income and Prices at the Univertiy of Pennsylvania.
Hoeffler, A., & Outram, V. (2011). Need, Merit, or Self‐Interest—What Determines the Allocation of Aid?. Review of Development Economics, 15(2), 237-250.
Inoue, C. Y. A., & Vaz, A.C. (2012). Brazil as ‘Southern donor’: beyond hierarchy and national interests in development cooperation?. Cambridge Review of International Affairs, 25(4), 507-534.
IPEA, 2011. Brazilian Cooperation for International Development 2005-2009. IPEA, 2014. Brazilian Cooperation for International Development 2010.
IMF, 2015. Direction of Trade Statistics (DOTS) Query Builder. [Online] Available at: http://elibrary-data.imf.org/QueryBuilder.aspx?key=19784661&s=322 [Accessed 17 12 2015].
John de Sousa, S.-L., 2010. Brazil as an Emerging Actor in International Development. DIE Briefing
Paper.
Kaufmann, D., Kraay, A. & Mastruzzi, M., 2014. The Worldwide Governance Indicators - Aggregate
Indicators of Governance 1996-2013. [Online] Available at:
http://info.worldbank.org/governance/wgi/index.aspx#home [Accessed 17 12 2015]. Kragelund, P., 2008. The Return of Non-DAC Donors to Africa: New Prospects for African Development?. Development Policy Review, 26(5), pp. 555-584.
Kuziemko, I. & Werker, E., 2006. How much Is a Seat on the Security Council Worth? Foreign Aid and Bribery at the United Nations. Journal of Political Economy, 114(5), pp. 905-930.
Mayer, T. & Zignago, S., 2011. Notes on CEPII's distances measures: the GeoDist Database. CEPII
Working Paper, December.
Mwase, N., 2011. Determinants of Development Financing Flows from Brazil, Russia, India, and China to Low-Income Countries. IMF Working Paper, Issue WP/11/255.
Naím, M. (2007). Rogue Aid. Foreign Policy 159 (March/April): 95-96.
Nunnenkamp, P., & Thiele, R. (2013). Financing for development: The gap between words and deeds since Monterrey. Development Policy Review, 31(1), 75-98.
OECD, 2014. Statistics on resource flows to developing countries. [Online] Available at: http://www.oecd.org/dac/stats/documentupload/DCRSTAT2013en.zip.
Radelet, S., 2006. A Primer on Foreign Aid. Center for Global Development - Working Paper Number
92.
Semrau, F. , 2015. BRICS development cooperation: Why Brazil, China, and India give foreign aid and to whom. Unpublished Master Thesis.
Silva, J. S., & Tenreyro, S. (2006). The log of gravity. The Review of Economics and statistics, 88(4), 641-658.
Tierney, M. J. et al., 2011. More Dollars than Sense: Refining Our Knowledge of Development Finance Using AidData. World Development, 39(11), pp. 1891-1906.
Transparency International, 2014. Corruption Perception Index 2014. [Online] Available at:
http://files.transparency.org/content/download/1900/12610/file/CPI2014_ResultsSpreadsheet.xlsx. United Nations Security Council, 2015. Countries Elected Members of the Security Council. [Online] Available at: http://www.un.org/en/sc/members/elected.asp.
Viola, E., & Basso, L. (2014). Amazonian policy and politics, 2003–13: deforestation, hydropower and biofuels. NOREF–Norwegian Peacebuilding Resource Centre Report.
World Bank Development Indicators, 2014. The World Bank. [Online] Available at:
Table A1: Definition and sources of variables used in the empirical analysis
Variable Short description Source
Dependent variable
Aid share Share of total aid given to specific country
during the period of interests. AidData 2.1 (Tierney, et al., 2011)
Explanatory variables
(log) Population Population, total (in 1,000). World Bank Development Indicators (2014)
(log) GDP p.c. in PPP
PPP Converted GDP Per Capita (Laspeyres), derived from growth rates of c, g, i, at 2005 constant prices.
Penn World Tables of Heston, et al. (2012)
(log) Natural disaster deaths
Number of people died as a consequence of
natural disasters. EM-DAT of Guha-Sapir, et al. (2015) Control of corruption Index ranging from approximately -2.5 to 2.5
with higher value indicating less corruption.
Worldwide Governance Indicators of Kaufmann, et al. (2014)
Polity IV Index ranging from -10 to 10 with -10 being autocracy and 10 being a full democracy.
Polity IV project of Center for Systematic Peace (2013) UNSC member
Dummy that the country was a non-permanent member of the UNSC during the time of interest.
United Nations Security Council (2015)
(log) Bilateral exports Value of Exports of the donor to another
country during the time of interest. DOTS of the IMF (2015)
(log) Oil reserves Oil reserves of a country in million barrels. BP Statistical Review of World Energy (2014)
(log) Distance
Geodesic distances are calculated following the great circle formula, which uses latitudes and longitudes of the most important cities/agglomerations (in terms of population).
CEPII of Mayer & Zignago (2011)
Common official language
Dummy for donor and recipient sharing a
common official language. CEPII of Mayer & Zignago (2011) Latin American country Dummy for being part of Latin America
(Spanish or Portuguese as official language). Own creation Political stability
Index ranging from approximately -2.5 to 2.5 with higher value indicating more political stability.
Worldwide Governance Indicators of Kaufmann, et al. (2014)
Voice and accountability
Index ranging from approximately -2.5 to 2.5 with higher value indicating more political participation.
Worldwide Governance Indicators of Kaufmann, et al. (2014)
(log) Resource depletion
Sum of energy and mineral depletion in current US$ during the time of interest.
World Bank Development Indicators (2014)
(log) Number of people affected by disasters
Number of people affected by natural
disasters. EM-DAT of Guha-Sapir, et al. (2015)
African country Dummy for being located in Africa. GeoCEPII of Mayer & Zignago (2011)
Scientific Coordinator : Xavier Oudin ([email protected]) Project Manager : Delia Visan ([email protected])
Find more on www.nopoor.eu Visit us on Facebook, Twitter and LinkedIn