A Decision-Making Framework to Determine the
Value of On-Orbit Servicing Compared to
Replacement of Space Telescopes
by
Mark Baldesarra
B.A.Sc. Engineering Science
University of Toronto (2005)
Submitted to the Department of Aeronautics and Astronautics
in partial fulfillment of the requirements for the degree of
Master of Science in Aeronautics and Astronautics
at the
MASSACHUSETTS INSTITUTE OF TECHNOLOGY
June 2007
c
Massachusetts Institute of Technology 2007. All rights reserved.
Author . . . .
Department of Aeronautics and Astronautics
May 25, 2007
Certified by . . . .
David W. Miller
Professor of Aeronautics and Astronautics
Thesis Supervisor
Accepted by . . . .
Jaime Peraire
Professor of Aeronautics and Astronautics
Chair, Committee on Graduate Students
Dedicated to the astronauts of Apollo 1, Space Shuttle Challenger, and Space Shuttle Columbia, who gave their lives in the service of space exploration. May we never forget their sacrifice.
A Decision-Making Framework
to Determine the Value of On-Orbit Servicing
Compared to Replacement of Space Telescopes
by
Mark Baldesarra
Submitted to the Department of Aeronautics and Astronautics on May 25, 2007, in partial fulfillment of the
requirements for the degree of
Master of Science in Aeronautics and Astronautics
Abstract
The Hubble Space Telescope has demonstrated that on-orbit servicing can provide significant benefits for scientific space programs. Specifically, servicing missions can replace failed components to keep spacecraft operational, and can upgrade onboard components to improve spacecraft performance. Hubble was able to capture these benefits because it was designed to be serviceable; however, many other programs have excluded serviceability from the design due to cost considerations. Often, the value of serviceability cannot be quantitatively justified. This thesis develops a frame-work to determine the value of including serviceability in a space telescope.
Various principles to evaluate serviceability are proposed throughout the litera-ture, and this thesis incorporates three main principles to construct the framework. First, the costs and benefits of servicing are separated so that the “cost” of servicing is expressed as the maximum price the customer is willing to pay. Second, the value of serviceability will be determined by comparing a telescope servicing program to a telescope replacement program. Third, the value of flexibility provided by servicing is analyzed by a Monte-Carlo simulation and decision rule analysis.
A case study was performed to demonstrate how the framework is used, using representative data from Hubble. For a simple space telescope, the case study calcu-lated the increase in science return gained by servicing and the maximum price for servicing missions. The case study illustrated an important trade between science return and risk of telescope downtime. Finally, the principles and techniques used in this framework are more generally applicable to non-revenue generating spacecraft. Thesis Supervisor: David W. Miller
Acknowledgements
My research would not have been possible without the support of my research advisor, Professor Dave Miller. I am grateful for the opportunity he provided to investigate an area of research in which I am interested, and for the freedom he gave me to chart my own path, in the absence of a supporting organization. I would like to acknowledge The Aerospace Corporation library and Erik Nilsen from NASA Goddard for their contributions to my research.
I would like to thank two professors whose courses have provided the foundation for my research. First, to Professor Richard de Neufville, through his Engineering Systems Analysis for Design course. He introduced me to Real Options theory and provided the inspiration to apply real options techniques to determine the value of telescope servicing. Second, to Professor George Apostolakis, through his Reliability and Applications course. He provided the statistical tools needed to perform the reliability analysis that is critical to this framework.
My friends have made my experience here at MIT an enjoyable one and kept me on track throughout my studies, for which I must express my sincere thanks. To Bruce, for your always insightful guidance and sense of humour. To Rosie, for providing a safe harbour away from work and always being good for a laugh or two. To Zoe and Laslo, for keeping The Canadian Contingent alive and well. And to Angela and Jessica, back at home in Canada, for keeping me connected to my roots and sticking with me despite the distance between us.
And finally, my family has been critical to my success here at MIT and throughout my academic career. They kept me going while I tried to find my footing in first semester, and they have always provided advice on trials and tribulations, both large and small. I am grateful that they were always a phone call away whenever I needed them. Dad, Mom, and Lauren: I couldn’t have done it without you.
Contents
1 Introduction 17
2 The State of Research: Literature Review 21
2.1 What is Value? . . . 22
2.2 Options Theory . . . 24
2.2.1 Financial Options . . . 25
2.2.2 Real Options . . . 27
2.2.3 Servicing as a Real Option . . . 29
2.3 Benefits of Servicing . . . 31
2.4 Servicing and the HST Experience . . . 34
2.4.1 Preventive Maintenance . . . 35
2.4.2 Corrective Maintenance . . . 37
2.4.3 Bus Upgrades . . . 38
2.4.4 Instrument Upgrades . . . 38
2.4.5 Overall Impact . . . 40
2.5 Servicing Technology: The How of Servicing . . . 41
2.5.1 Servicing Technology Testbeds . . . 41
2.5.2 Technical Requirements for Servicing . . . 42
2.6 Previous Spacecraft Servicing Studies . . . 43
2.7 Previous Telescope Servicing Studies . . . 44
2.7.1 To Service a Space Telescope . . . 45
2.7.2 The SAFIR Experience . . . 47
3 Addressing the Gap: Framework Principles 51
3.1 Separating Costs and Benefits of Servicing . . . 51
3.2 Using Program Comparison to Calculate Value . . . 54
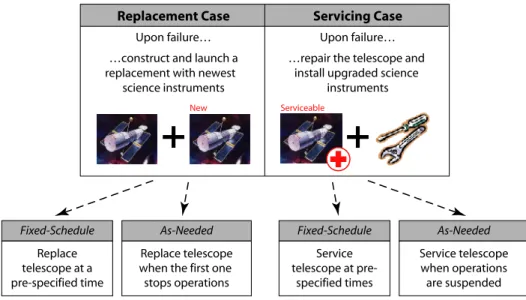
3.2.1 Comparison Cases . . . 54
3.2.2 Comparison Parameters . . . 57
3.3 Incorporating Flexibility and Decision-Making . . . 59
3.3.1 Methods from Financial Options . . . 59
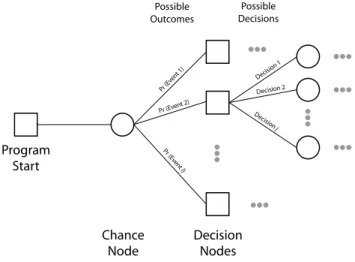
3.3.2 Decision Tree Analysis . . . 60
3.3.3 Decision Rules and Monte-Carlo Simulation . . . 61
3.4 Principles Summary . . . 64
4 Raising the Scaffolding: Framework Construction 65 4.1 Measuring Benefits: Telescope Science Return . . . 66
4.1.1 Productivity Rate . . . 67
4.1.2 Number of Papers . . . 67
4.1.3 Discovery Efficiency . . . 69
4.1.4 Modelling Technology Advancement . . . 70
4.1.5 Modelling Telescope Science Return . . . 71
4.2 Measuring Costs: Cost Models . . . 73
4.2.1 Initial Telescope Cost . . . 75
4.2.2 Instrument Costs . . . 77
4.2.3 Launch Costs . . . 79
4.2.4 Operations Costs . . . 82
4.2.5 Costs for the Replacement Case . . . 83
4.2.6 Costs for the Servicing Case . . . 84
4.2.7 Cost Model Summary . . . 85
4.3 Telescope Model . . . 86
4.4 Modelling Uncertainty: Stochastic Analysis . . . 88
4.5 Modelling Management: Decision Analysis . . . 89
4.5.2 Decision Stage Two: Mission Wait Time . . . 93
4.5.3 Decision Stage Three: Mission Execution . . . 93
4.6 Determining Value: Program Comparison . . . 95
4.7 Framework Summary . . . 98
5 Framework in Action: An HST-Based Case Study 101 5.1 Defining the System: Telescope Model . . . 102
5.2 Setting the Dials: Parameter Specification . . . 104
5.2.1 Technology Advancement Model . . . 104
5.2.2 Decision Model Parameters . . . 104
5.2.3 Cost Model Parameters . . . 107
5.2.4 Risk Parameters . . . 108
5.2.5 Parameter Specification Summary . . . 109
5.3 Rolling the Dice: Program Analysis . . . 111
5.3.1 Step 1: Replacement Case Analysis . . . 111
5.3.2 Step 2: Servicing Case Analysis . . . 116
5.3.3 Step 3: Program Comparison . . . 118
5.3.4 Program Analysis Summary . . . 121
5.4 Turning the Knobs: Sensitivity Analysis . . . 122
5.4.1 Sensitivity to PFO Threshold (min pfo) . . . 123
5.4.2 Sensitivity to Number of Components . . . 124
5.4.3 Sensitivity to Servicing Latency (serv latency) . . . 126
5.4.4 Sensitivity to Technology Advancement . . . 127
5.4.5 Sensitivity to Fabrication Fraction (fab fraction) . . . 128
5.4.6 Sensitivity to Servicing Failure Risk (serv risk fail) . . . . 129
5.4.7 Sensitivity to Serviceability Cost (serviceable inc) . . . 130
5.4.8 Sensitivity Analysis Summary . . . 132
5.5 Case Study Summary . . . 132
6 Conclusion 135 6.1 Questions Answered . . . 135
6.2 Future Work . . . 137
6.3 Final Thoughts . . . 139
A Simulation Code 141
A.1 Simulation Kernel . . . 143
A.2 Performance Models . . . 155
A.3 Cost Models . . . 165
List of Figures
1-1 HST being serviced by astronauts and the Space Shuttle . . . 18
2-1 The hierarchy of servicing research . . . 21
2-2 Example of focussing on benefits when discussing the value of servicing 23 2-3 Timeline of instruments installed on HST . . . 39
2-4 Science return from HST between 1990-2003 . . . 40
2-5 Probability distributions of telescope science return . . . 46
2-6 Aggregate HST reliability curve . . . 47
3-1 Cost savings with highly uncertain servicing costs . . . 52
3-2 Cost savings as the maximum price of servicing . . . 53
3-3 Summary of cases and subcases in the framework . . . 56
3-4 Structure of a decision tree . . . 61
3-5 Steps in a decision rule analysis . . . 62
3-6 An example probability distribution displayed as a histogram . . . 64
4-1 Number of refereed papers based on HST data by publication year . . 68
4-2 Discovery efficiency of select HST Instruments . . . 70
4-3 Discovery efficiency of state-of-the-art technology and the telescope . 73 4-4 Initial Cost as a function of MLEO . . . 76
4-5 Instrument Cost as a function of MLEO . . . 78
4-6 Launch vehicle families with trendlines . . . 81
4-7 Launch Cost as a function of MLEO . . . 81
4-9 Hierarchy of components in the telescope model . . . 86
4-10 Possible states and transitions for each component . . . 88
4-11 Decision Analysis Stage One . . . 91
4-12 Decision Analysis Stage Two . . . 93
4-13 Decision Analysis Stage Three . . . 94
5-1 Future projections of detector technology . . . 105
5-2 Discovery efficiency of state-of-the-art technology . . . 105
5-3 Primary metrics for the Fixed-Schedule replacement subcase . . . 112
5-4 Primary metrics for the As-Needed replacement subcase . . . 112
5-5 Failure time of the initial telescope . . . 113
5-6 Program Lifetime for both Replacement subcases . . . 114
5-7 Offline Time for both Replacement subcases . . . 114
5-8 Primary metrics for the Servicing Case / Fixed-Schedule subcase . . . 116
5-9 Primary metrics for the Servicing Case / As-Needed subcase . . . 116
5-10 End of Life (EOL) for both Servicing subcases . . . 118
5-11 Time offline for both Servicing subcases . . . 118
5-12 Legend for sensitivity analysis boxplots . . . 122
5-13 Sensitivity of results to changes in min pfo . . . 123
5-14 As-Needed servicing mission times as number of backups is increased 124 5-15 Increase in science return when number of backups is increased . . . . 125
5-16 Increase in lifecycle cost when number of backups is increased . . . . 125
5-17 Sensitivity of results to changes in serv latency . . . 126
5-18 Sensitivity to changes in technology advancement rate p . . . 127
5-19 Sensitivity of budget to changes in fab fraction . . . 128
5-20 Sensitivity of max servicing cost to changes in fab fraction . . . 129
5-21 Sensitivity of science return to changes in risk serv fail . . . 129
5-22 Sensitivity of results to changes in risk serv fail . . . 130
5-23 Sensitivity of budget to changes in serviceable inc . . . 131
List of Tables
2.1 Parameters for Financial Options and Analogues in Real Options . . 30
2.2 Benefits of servicing to Earth Observation Missions . . . 32
2.3 Summary of major HST components affected during servicing . . . . 36
2.4 Identified benefits of SAFIR servicing . . . 48
4.1 First-order cost models and their inputs . . . 74
4.2 Parameters for the Operations Cost model . . . 75
4.3 Cost of selected HST Instruments . . . 78
4.4 Launch vehicle family data . . . 80
4.5 Parameters for the Operations Cost model . . . 82
4.6 Input Parameters for the Simulation . . . 99
5.1 Cost sources for a telescope program . . . 103
5.2 Failure rate data used in the case study . . . 103
5.3 Parameter Settings for the Case Study . . . 110
5.4 Cases and subcases to be analyzed . . . 111
5.5 Science return of the Servicing subcases compared to baseline . . . . 119
5.6 Total cost of the Servicing subcases compared to baseline . . . 120
5.7 Summary of results for different numbers of As-Needed servicing missions121 5.8 Summary of nominal simulation results . . . 122
Chapter 1
Introduction
The Hubble Space Telescope (HST) has provided an unprecedented glimpse into the structure of the universe. Throughout its first eleven years of operation, HST has produced about 420,000 images, observed over 17,000 targets, and contributed to over 3,200 scientific papers [1]. The success of HST lies partly in the use of on-orbit servicing. Servicing is the act of physically replacing, modifying, and/or upgrading components on an operational spacecraft in its deployed environment. As of 2007, four servicing missions have been sent to HST, with a fifth currently scheduled for 2008. HST is serviced by astronauts through extra-vehicular activity (EVA) and supported by the Space Shuttle, as shown in Figure 1-1.
Figure 1-1: HST being serviced by astronauts and the Space Shuttle
Servicing can be used to maintain a spacecraft to keep it operational throughout its nominal mission duration, which is the minimum lifetime of the spacecraft mandated by its operators. Maintenance is required for complex spacecraft such as telescopes that are intended to last for an extended life, since it is infeasible and uneconomical to be designed to remain operational for decades without assistance; for example, HST was designed with a nominal mission duration of 20 years [1]. Each HST servicing mission replaced failed components with new, and often improved, components. As a result, HST has been almost continuously operational from its deployment in 1990 through to 2007.
Servicing can also upgrade components on the spacecraft to improve performance. In particular, the science instruments can be upgraded with new technology to in-crease their resolution and sensitivity. The HST servicing missions have replaced the instrument several times, and those currently installed on the telescope are orders of magnitude more accurate than the original instruments. This has kept HST on the cutting-edge of astronomical research, and continued servicing will keep it there for the foreseeable future. The net result of servicing is a telescope that has successfully operated throughout its mission and provided ever-increasing science capabilities.
These benefits of servicing do not come for free. The servicing missions themselves have considerable direct and indirect costs. The fifth servicing mission, which like the previous four will be Shuttle-based, has an expected price tag of $900M [2], and a
cancelled plan for a robotic servicing mission to HST would have cost between $1.7B and $2.4B1 [3]. In order to perform servicing on a telescope, it must first be designed
with serviceability, that is, the ability to be serviced by an external agent, whether human or robotic. HST was designed with doors to provide access to internal systems, the components were modularized to allow easy removal, and the instruments were designed to be swapped with new ones. Incorporating these design features incur additional costs before the telescope is launched, but without these features, it is extremely difficult (if not impossible) to service the telescope. Clearly, the decision to include serviceability in a telescope design must be made during the design phase. Serviceability has been excluded from telescope designs in the past because the cost of serviceability couldn’t be justified. The Chandra X-Ray Observatory was originally intended to operate in Low Earth Orbit (LEO) and be serviced via the Space Shuttle. When cost constraints required the mission to be descoped, the plan to service the telescope was abandoned, and the intended orbit was switched to a highly elliptical one instead of LEO [4]. This dilemma is at the heart of the issue of telescope servicing. Scientists, engineers, NASA administrators, and policy mak-ers all undmak-erstand the benefits associated with servicing telescopes, but they often cannot justify the added costs associated with enabling this benefit captures. When budgetary pressures appear, serviceability is dropped from designs.
What is needed is a method to quantitatively determine the value of serviceability, so engineers and program managers have the information needed to make the decision. For space systems that generate revenue as a benefit, the value of serviceability can
be easily calculated using standard economic valuation techniques. Consider the
example of a commercial communications satellite constellation. The benefits of the system are the revenues from subscribers to the service. Servicing operations can modify satellites to support more subscribers, which can potentially increase revenue
[5]. Since both the benefits and costs of servicing are measured using the same
units (dollars), the decision to service a satellite (and to design the satellites to be
1This was the estimated range from the team that developed an HST robotic servicing concept.
serviceable) can be made on a standard Net Present Value (NPV) analysis [6]. In this example, the question becomes: are the up-front costs of serviceability and the costs of servicing missions repaid by the increase in future cash flows due to the improved system performance?
In the case of space telescopes, however, the benefit that the system generates is science data, rather than revenues. Science data has no monetary equivalent, so a standard NPV analysis cannot be used; with the benefits and costs in different units, there is no direct way to combine these metrics into a single quantity that can guide the decision. Absent any budgetary restrictions, scientists would clamour to include serviceability in design and set aside funds to pay for servicing missions in the future to install new, advanced instruments. However, when budget pressures are applied, all telescope features are critically analyzed to determine if they should remain in the design or removed to save cost. Without a method to analyze the value of serviceability, it will often be dropped because the cost cannot be justified.
Furthermore, the telescope program is subject to many sources of uncertainty. For example, the mean time to failure for components can be calculated, but the telescope failure time is not known a priori. As well, the future instrument technology that is installed onboard depends on the time of servicing, which affects the overall science return of the telescope. Furthermore, the servicing missions themselves have
a likelihood of failure. The mission may fail to service the telescope, or it may
inadvertently disable or destroy the telescope; each of these events has a probability associated with it. Any method of calculating the value of serviceability must account for these sources of uncertainty.
There is a need for a method to analyze the value of including serviceability in the design of a telescope. The goal of this thesis is to develop a framework to perform this analysis. The current state of research will be discussed in Chapter 2, which will motivate the specific research questions that must be addressed. The general principles that will be used in the framework to answer these questions are described in Chapter 3. The framework itself will be constructed in Chapter 4. Finally, the framework will be demonstrated through a case study in Chapter 5.
Chapter 2
The State of Research:
Literature Review
This chapter will investigate research into telescope servicing, which is a specialized segment of the general on-orbit servicing field. On-orbit servicing in turn falls into the broader class of real options theory. This can be thought of as a funnel which narrows down towards telescope servicing, as illustrated in Figure 2-1.
This chapter is organized by starting at the top of the funnel and gradually working down to the specific field of telescope servicing, and specific areas of interest will be
Options Theory Spacecraft Servicing Telescope Servicing RESEARCH GAP
highlighted along the way. The topics investigated in this literature review are the following:
1. Define value as used in this thesis.
2. How can options theory be used to think about spacecraft servicing?
3. What are the benefits of servicing? How have these benefits been demonstrated on HST?
4. What are the costs of servicing?
5. Examine current research into the value of spacecraft servicing.
6. Examine current research into the value of telescope servicing in particular. 7. Identify the research gap that this thesis will address.
2.1
What is Value?
Spacecraft servicing has not been widely adopted partly as a result of misconceptions on the part of engineers about the concept of value. Although engineers may share the view that spacecraft servicing is “valuable”, in many cases this is confused with the concept that spacecraft servicing can generate many benefits.
This confusion can be seen even in programs where servicing has been clearly demonstrated as valuable. For example, in the NASA media guide for the fourth servicing mission to the Hubble Space Telescope (HST), a short section entitled “The Value of Servicing” states that:
Hubble’s visionary modular design allows NASA to equip it with new, state-of-the-art instruments every few years. These servicing missions en-hance the Telescope’s science capabilities, leading to fascinating new dis-coveries about the universe. Periodic service calls also permit astronauts to “tune up” the Telescope and replace limited-life components [1].
Figure 2-2: Example of focussing on benefits when discussing the value of servicing (from Lester [7])
Another example is from a presentation on the inclusion of serviceability in the design of a future space telescope. Most of the slides in the presentation discuss pro-posals for the servicing architecture and implications of serviceability on design, but one slide is devoted to the “value of servicing”, and shown in Figure 2-2. The value, according to the presenter, is clearly apparent from a graph of increasing instrument capabilities, implying that servicing can allow new and advanced instruments to be installed in the future [7]. This is correct; however the title of the slide, “Value of Servicing is Well Understood”, is somewhat misleading.
Both of these examples share a common issue: the “value” of servicing as presented ignores the cost of servicing. Serviceability is worthless (i.e., has no value) if servicing missions are prohibitively expensive, or the necessary modifications to the telescope to enable servicing are too extreme. No matter how much benefit can be gained from servicing, if the associated costs (monetary or otherwise) are too high, servicing is not
valuable. In addition, the benefits themselves are often expressed qualitatively. The graph in Figure 2-2 merely demonstrates that instrument technology will significantly improve. How does this change the science return of a telescope, and by how much? It is often unclear exactly how a telescope program will gain from servicing, save for a fuzzy notion that servicing will improve science capabilities.
The net result of these difficulties is that serviceability is often left out of telescope design studies. Even if it is included in the design, it is often removed when budgeting and scheduling pressures start to mount. If engineers cannot quantitatively justify the serviceability, it is unlikely to be present in the final design.
Clearly, a more satisfactory definition of value is needed, and there have been several proposed in the literature. Murman [8] defines value in terms of a business enterprise. He states that value comes from transactions that provide utility to an organization. Specifically, Murman defines value as:
How various stakeholders find particular worth, utility, benefit, or reward in exchange for their respective contributions to the enterprise.
These transactions both can provide utility (benefits) or payment for those benefits (costs). Likewise, Rouse and Boff define value in the context of systems engineering as “a fair return or equivalent in goods, services or money for something exchanged” [9]. The general theme in these definitions is that value comes from generating benefits while incurring associated costs, neatly summarized by Crawley as “value is benefit at cost” [10]. He states that a “good” architecture is one that delivers benefit at a competitive cost. Thus to calculate the value, one must evaluate both benefits and costs to determine if the benefits received justify the expense in generating them.
2.2
Options Theory
Serviceability can be considered as an option that is designed into a telescope program. In its most general sense, an option is the right, but not the obligation, to take an action in a specified time period and for a certain price [11]. Servicing fits well within
this framework: telescope serviceability gives managers the right (but no obligation) to service the telescope throughout its operational lifetime. However, serviceability must be designed into the system before it is launched, so engineers and program managers must decide to incorporate it into the initial telescope design. This section discusses the various types of options in use in the business world, which will motivate how the servicing option can be thought about.
2.2.1
Financial Options
Long before options were introduced as tools to analyze projects, they were used as financial instruments. A financial option is a contract between two parties where the option purchaser is given the right (but not the obligation) to either buy or sell an asset in the future at a certain time. The asset to which the option applies to is called the underlying asset. Underlying assets for options can be one of a wide variety of financial instruments, such as shares, bonds, mutual funds, and foreign currencies.
Options became widely used in finance and business to either profit from unex-pected gains or protect against risk. As a result, options were classified into two primary types: A call option is the right to perform an action to take advantage of a favourable opportunity, whereas a put option is the right to perform an action to limit losses in a bad situation [12]. In the case of a stock option, a call allows the holder to profit if the stock price goes high, and a put allows the holder to prevent losses if the stock price goes low.
When one performs the action that the option allows, it is called exercising the option. For both call and put options, purchasers spend money now to have the opportunity to exercise the option in the future as conditions warrant. To determine the value of an option, various mathematical treatments were developed, which are further described in Chapter 3. The goal of these analyses is to determine how much should be paid up-front to purchase the option and how much benefit can be realized. The value of a financial option can be determined using the following parameters:
• The initial cost of the option.
• The strike price of the underlying asset: the set price at which the asset must be traded when the option is exercised.
• The expiration date of the option: the time period over which the option can be exercised.
• The volatility of the underlying asset: the distribution of potential returns of the asset over the life of the option. [11].
With this terminology, the stock option example can be expressed more formally. A call option on a stock grants the purchaser the right to purchase the stock at the strike price on or before the expiration date. A put option on a stock grants the right to sell the stock at the strike price on or before the expiration date1 [6].
Financial options are attractive because their value is asymmetric. The option holder will only exercise it when it is advantageous; for a call option, the holder will only exercise it when the price of the asset (known as the spot price) is above the strike price. Conversely, if the spot price is below the strike price, the holder will not exercise the option, as it would lead to a net loss. So the holder can only have a net benefit from the option; the option is exercised when profitable, and it is not exercised if it would result in a loss [11]. The expected value of an option is always positive. This comes with the important caveat that the option itself must be purchased in the first place. Thus, if the option is not exercised, no loss is incurred, except for the initial cost of the option.
Options are more valuable when the underlying asset has higher volatility, which is defined in economics as the possible spread of the asset value [6]. In the case of financial options, the underlying asset is more volatile if the distribution of asset price is wider. Returning to the call option example, having a higher chance of the asset price increasing means a greater expected payoff when the option is exercised. Of
1This discussion has focussed on American options, which can be exercised at any time before
the expiration date, rather than European options, which can be exercised only on the expiration date. This distinction is not relevant to the discussion, so European options are omitted.
course, along with a higher chance of price increases comes a higher chance of price drops, but since the value of a call option (as with all options) is asymmetric, having a greater chance of low prices is of no importance because no loss is incurred if the price is low. Overall, the expected return of the option is greater for a more volatile underlying asset.
The key insight from financial options theory is that uncertainty and risk are not necessarily negative. In fact, uncertainty itself can be a source of value, since more uncertainty (i.e. volatility) provides a chance of larger payoffs with no downside risk. Options are instruments that can be used to capture this value. Again, this comes with the important caveat that the option must be purchased first. The remaining issue to be resolved with financial options is to determine if the up-front cost of purchasing the option is justified by the potential future payoff.
2.2.2
Real Options
Financial options are limited to actions on financial instruments, but the concept of creating an opportunity to perform actions in the future is more broadly applicable. In the business world, companies often structure contracts to include provisions to act if revenues or profits increase, or escape clauses that allows the company cut its losses if conditions deteriorate. More generally, large business operations, such as factories, refineries, and mines, are not designed and built to be static throughout their lifecycles: changes are made depending on how demand or other business factors evolve through time. Good designs are ones that allow for these changes to be made without incurring very large expenses. All of these examples can be considered as types of options, but instead of an option on a financial asset, these options are on business projects. Thus this particular class of options are called real options, so named because they act on real, tangible projects.
Similar to financial options, real options can be classified into one of two basic types: call-like and put-like. Call-like real options are those that can be exercised to capture benefits when the value of the project increases, such as the ability to increase production at a factory if demand increases. Put-like real options are exercised to
limit future losses, such as the ability to slow or halt production at a factory if demand decreases [11]. In both of these cases, expenses may be incurred in order to exercise the option. For the call option example, the factory manager may have to increase wages to increase production or spend capital to expand the plant. The option provides the opportunity to perform actions as future conditions warrant, and without it those actions may be impractical or prohibitively expensive.
Another, complementary classification for real options, proposed by Richard de Neufville, professor of Engineering Systems at MIT, concerns the level of knowledge about the project design that is needed to purchase the real option. Real options, of both the call-like and put-like varieties, can be considered either “on” or “in” a project [11]. Real options “on” a project are activities that can be performed at the project level without regard to its internal design, whereas a real option “in” the system is one that is built into the system design itself. For example, consider a mining project. If managers purchase land to provide a future opportunity to mine natural resources, this is a real option “on” the project, since it is independent of the eventual design of the mine. In contrast, if the mine is designed so that production can be increased if other nearby deposits are found, this is an option “in” the system since the design itself was altered.
This is similar to the ability of financial options to extract benefits from volatil-ity and uncertainty, but whereas financial options manage uncertainty in underlying assets, real options manage uncertainty in real projects. Furthermore, the value of a real option (as with a financial option) stems from the ability to make decisions in the future based on conditions as they happen. The ability to adapt to future events provides management with a measure of flexibility. Flexibility is defined in [13] as
The ability of a system to adapt and respond to changes in its initial objectives, requirements and environment occurring after the system is in operation in a timely and cost-effective manner.
The key here is that built-in flexibility provides managers the ability to make changes that are cost-effective. Many changes can be made after a project starts, but
without the real option, the change may be prohibitively expensive.
Just as flexibility is valuable where there is uncertainty, flexibility is worthless in a deterministic world. If future events are known in advance, the project can be designed to maximize utility given this set of events, and the ability to make changes is not valuable. In reality, the future contains uncertainty, so a real option provides the ability to make changes in the future when managers have more information and the uncertainty has been resolved. Furthermore, like their counterparts in the financial world, real options are more valuable with greater uncertainty. Call-like real options are more valuable when there is a higher chance that the conditions surrounding the project improve, and the option can be exercised to capture additional value. In contrast, put-like real options are valuable if there is a larger risk of negative events, and the option can be exercised to cut losses.
The key question that remains is to find the value of the real option so that planners know how much they should pay to incorporate the option into the project. As with financial options, the specific option valuation techniques will be discussed in Chapter 3.
2.2.3
Servicing as a Real Option
Servicing of space systems while deployed in orbit can be considered a real option because servicing provides the flexibility to perform actions to improve benefits or cut losses as future conditions warrant. The servicing real option can be loosely described by the four parameters that describe a financial option. The analogue between servicing as a real option and standard options are described in Table 2.1 and are discussed in more detail below.
First, the initial cost of the option corresponds to the cost of engineering, devel-opment and fabrication associated with enabling servicing in the space system. In the case of a serviceable satellite, the satellite must be designed with doors for ac-cess by astronauts or robotic servicing systems, the replaceable components must be modularized so that they can be removed and swapped easily, etc.
Table 2.1: Parameters for Financial Options and Analogues in Real Options
Parameter Financial Option Servicing Real Option
Analogue
Initial Cost Price of option contract on
purchase
Costs associated with incorpo-rating serviceability in the ini-tial design
Strike Price Price that the underlying asset
will be bought / sold when op-tion is exercised
Costs associated with perform-ing the servicperform-ing mission in the future
Expiration Date Latest time when the option
can be exercised
Time period over which the op-tion to service is available
Volatility Possible spread of asset prices
over life of option
Uncertainty in the
perfor-mance or other parameters of the space system
Second, the strike price of the financial option corresponds to the cost of exercising the servicing real option in the future. Although the servicing option was built in (or purchased) during the design phase, the servicing mission itself will not be free. Costs are incurred when the servicing mission is launched; including the cost of the servicing spacecraft, replacement components, launch, and operations. The costs incurred may not end after servicing is complete: the system may be modified and so the operations costs may change.
Third, both financial and real options have an expiration date because there may be only a fixed time interval over which the options can be exercised. Normally, a spacecraft can be serviced throughout its operational life, but there may be cases where servicing cannot be exercised past a certain time. For example, if a spacecraft requires a large amount of propellant to manoeuvre into position to be serviced, it may not be available later into the mission when fuel is depleted, although it still may be able to continue normal operations.
Finally, the volatility underlying a financial option corresponds to various sources of uncertainty in a telescope program. The value of the servicing real option increases
if the underlying uncertainty associated with the space system is high. Consider a space system whereby servicing missions are sent to repair components that failed prematurely. If there is no uncertainty in the failure rate, it is possible for a spacecraft to be designed with sufficient redundancy to last for the entire mission. In that case, the spacecraft would not require servicing, and the value of serviceability is zero. On the other hand, as the uncertainty in the failure time increases, so does the probability of premature failure, which makes the option to service more valuable.
2.3
Benefits of Servicing
The benefit of the servicing real option is the flexibility it provides to respond to future events. Nilchiani and others [14] categorizes three types of flexibility by the time frame over which these changes occur: , medium-, and long-term. In the short-term, components or the entire spacecraft may fail, which requires urgent repair or replacement to ensure that the overall performance of the system is not compromised. This is called emergency service flexibility. In the medium-term, changes in demand may require the system to be adapted to support these changes. This is called volume flexibility. In the long-term, the type of service demanded may change, requiring more substantial changes to the system to fit the new mission need. This is called mix flexibility.
These three flexibility types can be illustrated using the example of a constella-tion of communicaconstella-tions satellites, where the satellites provide service to terrestrial subscribers [5]. In the event that a satellite is damaged, emergency service flexibility allows the satellite to be repaired or replaced in order to maintain service. If demand from the subscriber base sharply increases, volume flexibility allows the constellation to be reconfigured by adding more satellites to meet demand. If subscribers demand different services over time (for example, a shift from telephony to Internet service), mix flexibility allows the satellites to be reconfigured to support the new service. To enable these different types of flexibility, the system must be designed with a real option that can be exercised as needed.
Table 2.2: Benefits of servicing to Earth Observation Missions Science Benefits
• The science data set is increased through more observation time. • The science data set can be used in conjunction with other missions. • Unique capabilities onboard a satellite can remain in operation
• Any unexpected science results gained during the nominal mission can be investigated further.
Operational Benefits
• The satellite may still be useful and provide valuable data.
• Satellite procedures and/or technology can be further demonstrated or validated.
• The satellite may be useful in future applications that are currently unan-ticipated.
In the context of scientific missions, flexibility has already been explicitly recog-nized as valuable for Earth observation missions (EOMs). At the end of the nominal mission duration of a scientific satellite, the program undergoes a Senior Review to determines if the satellite program should be extended past its nominal duration [15]. The National Academy of Sciences commissioned a report to investigate the circumstances in which EOMs should be extended. The report found seven benefits to extend EOMs, summarized in Table 2.2, categorized as either benefits related to the acquisition of science data, or benefits related to continued spacecraft operations. In addition to adding benefits to a program, flexibility can be used to protect programs against risk. Joppin [16] identifies four sources of risk are important for space systems that are deployed over medium- to long mission durations, which can be mitigated by incorporating flexibility into the system:
• Risk of system failure: The system fails prematurely due to component wearout, random failures, or design errors, and is unable to satisfy its intended mission duration without intervention.
• Risk of commercial obsolescence The actual market demand profile is drastically different than the assumed demand profile used during the design phase, and the system either cannot satisfy demand or has too much capacity.
• Risk of technology obsolescence: Technology on the spacecraft is made obsolete by new developments on the ground and so the spacecraft becomes less useful to customers.
• Risk of change in customer requirements: The desires of the customers change over time, and the new desires cannot be served by the system as originally designed [16].
These four risks can map onto the three types of flexibility described by Nilchiani. System failure is a short-term issue that can be immediately addressed via emergency service flexibility. Commercial obsolescence can either be an inability to meet the level of demand (which can be remedied by volume flexibility) or an inability to provide the demanded type of service (remedied by mix flexibility). For both technological obsolescence and requirements changes, the system needs to be reconfigured, which is possible only with mix flexibility.
In a later paper, Joppin [17] analyzes the value of flexibility specifically for scien-tific missions. She identifies four primary areas where the ability to service a science mission can provide value over the mission lifetime:
• Mission salvage: The system is damaged before becoming operational. Without the ability to service, the mission is an immediate failure.
• Repair and maintenance: As components on the spacecraft fail, servicing mis-sions can replace these components to ensure it can continue to operate. This applies to both expected (wearout) failures and unexpected (random) failures. • Instrument upgrades The instruments can be replaced to improve the science
return with newer technology. Also, if the objectives of principal investigators change, the installed instruments may not be sufficient. For example, if an
instrument is optimized for the infrared wavelength band but scientists want to focus more on ultraviolet, the instrument must be replaced in order to satisfy this new demand profile.
• Bus component upgrades: The supporting equipment, such as power systems, onboard computers, or environment control, can be upgraded to drastically improve science return even with the same instruments.
In summary, flexibility provided by servicing can theoretically provide a wide range of benefits to a space mission. Servicing can both protect against bad conditions (failures and risks) and provide increased benefits under good conditions (installation of new technology through upgrades).
2.4
Servicing and the HST Experience
Previous sections have shown that the flexibility to perform servicing can potentially provide significant benefits, but it is difficult to accurately quantify these benefits. Fortunately, the Hubble Space Telescope (HST) has clearly demonstrated these ben-efits on an actual telescope. HST was intended to replicate a ground observatory in orbit [18]. Ground observatories are designed to be flexible so that they can be upgraded with new instruments to remain on the leading edge of technology. This is possible because ground observatories are readily accessible for maintenance, repair, and upgrade activities. As well, the scientific instruments are generally kept sepa-rate from the optical bench, so they can be removed and replaced as needed. An observatory in orbit is more advantageous due to the more stable platform that space provides: free from local vibrations, earthquakes, and most importantly, atmospheric interference [19]. However, a space telescope is much more inaccessible than ground telescopes due to its location, and components must be more integrated to save mass, volume and cost. Despite these difficulties, the advantages of flexibility that are seen with ground telescopes are still valid for space telescopes.
HST was initially intended to be returned to Earth via the Shuttle to undergo periodic maintenance, but in the end HST was designed to allow servicing in orbit by astronauts performing extra-vehicular activity (EVA) [17]. The internal components were modularized and designed such that they could be repaired or replaced by as-tronauts during servicing missions, which were planned to occur approximately once every three years [20]. As of 2007, four servicing missions have been sent to HST, with a fifth mission scheduled for 2008 [21]. Table 2.3 provides a summary of the components replaced by the four servicing missions [21, 22].
The flexibility to perform servicing operations on HST granted NASA the ability to perform four categories of tasks:
• Preventive maintenance: Replace components subject to wearout before they fail and cause suspension of HST operations.
• Corrective maintenance: Replace components if they fail prematurely and repair flaws detected after deployment.
• Bus upgrades: Replace engineering components with improved hardware to improve the lifetime and/or utility of HST.
• Instrument upgrades: Replace onboard scientific instruments with more ad-vanced instruments [16].
These four categories are discussed in more detail below. Although both types of maintenance (preventive and corrective) is usually considered together as one cate-gory, the distinction is made between these two types by Waltz [23] since they are each performed under different circumstances.
2.4.1
Preventive Maintenance
Components on HST do not last indefinitely. If the telescope is to operate for its intended 15-year mission duration, these components need to be maintained or re-placed. For example, HST depends on a set of six Rate Sensing Units (RSUs). Each
Table 2.3: Summary of major HST components affected during servicing Servicing Mission 1
• Replaced 4 of 6 Rate Sensing Units • Replaced 2 of 2 Magnetometers
• Upgraded the flight computer coprocessor • Replaced solar arrays
• Replaced solar array drive electronics Servicing Mission 2
• Replaced 1 of 3 Fine Guidance Sensors • Replaced 1 of 4 Reaction Wheel Assemblies
• Installed Optical Control Electronics Enhancement Kit • Replaced Solar Array Drive Electronics
• Replaced Tape Recorder with Solid State Recorder Servicing Mission 3A
• Replaced 6 of 6 Rate Sensing Units • Replaced 1 of 3 Fine Guidance Sensors
• Installed Voltage/Temperature Improvement Kits • Installed new computer (Intel 486)
• Upgraded Solid State Recorder • Replaced thermal insulation blankets Servicing Mission 3B
• Replaced 1 of 4 Reaction Wheel Assemblies • Replaced solar arrays
RSU contains gyroscopes and electronics to detect the orientation of HST and pro-vide data for the reaction wheels to point the telescope [24]. Three of the six RSUs are required to be functional for science operations. Since gyroscopes are subject to wearout, the backup RSUs are brought online when the primaries fail, but without intervention the number of functioning RSUs will eventually drop below the min-imum of three, at which point telescope will cease operations. Servicing missions were planned accordingly to replace gyroscopes as they wear out and to prevent the number of functioning gyroscopes from dropping below three [25].
2.4.2
Corrective Maintenance
Not all events can be foreseen, so corrective maintenance operations perform repairs on unexpected failures. The infamous example from HST was the error in the primary mirror discovered immediately after launch, when the first images captured by HST had a lower resolution than expected. After an investigation, NASA concluded that the primary mirror had a slight spherical aberration flaw caused by manufacturing errors, which caused light entering the telescope to converge away from the focal plane [26]. To correct this problem, engineers designed the Corrective Optics Space Telescope Axial Replacement (COSTAR) optics package, which was installed on the first servicing mission to return HST to its designed specifications.
Corrective maintenance was also useful later into the life of HST. The gyroscopes inside the RSUs wore out much sooner than anticipated, and by 1999 only two gy-roscopes were functional. This caused HST to go into standby mode and suspend science operations. A servicing mission was originally scheduled to launch in 2000 to perform preventive maintenance on the RSUs. Since the components failed ear-lier than expected, the servicing mission was split in two, and the RSU replacement portion of the mission was bumped up to December 1999. The original preventive maintenance mission became a corrective one once HST ceased operations due to hardware failure [25].
In both of these cases, the ability to perform corrective maintenance saved HST from having a less productive and shorter lifetime than it has had so far.
2.4.3
Bus Upgrades
Maintenance operations alone would keep HST running at its designed specifications with no increase in science return. To act as a true observatory like its ground-based counterparts, HST components were upgraded during servicing missions. Compo-nents such as onboard processors, data storage, solar arrays, and control systems were upgraded with new technology. These upgrades increased the overall telescope performance by improving the characteristics of the supporting systems. For exam-ple, upgrades to the onboard computer systems increased the data storage capability from 3 GB at launch to 21 GB at present, which enabled better management of data gathered by the instruments [27]. Furthermore, combinations of bus upgrades can lead to systemic telescope improvements. For example, upgrades to the structure and control systems reduced the peak jitter from 39 mas at launch to 14 mas at present [27]. Clearly, both component-level and system-level improvements to the supporting bus improved the science return of HST.
2.4.4
Instrument Upgrades
From the astronomer’s perspective, perhaps the most exciting type of servicing oper-ation is the installoper-ation of new telescope instruments. HST has five bays for instru-ments that can be accessed by astronauts so that instruinstru-ments can be replaced during servicing missions. Three of the four HST servicing missions included the installation of new, state-of-the-art science instruments, and the fifth servicing mission planned for 2008 will install two more. Figure 2-3 shows a timeline of the progression of sci-ence instruments throughout the life of HST. Successive generations of instruments have yielded an enormous increase in resolution and sensitivity in many wavelength bands. For example, the Advanced Camera for Surveys (ACS) is a third generation instrument currently installed on HST. Compared to the first generation instrument that was replaced, the instrument resolution has doubled and the field of view is over 40 times greater [28]. The net result is a huge increase in science return, both in data quantity and quality.
2.4.5
Overall Impact
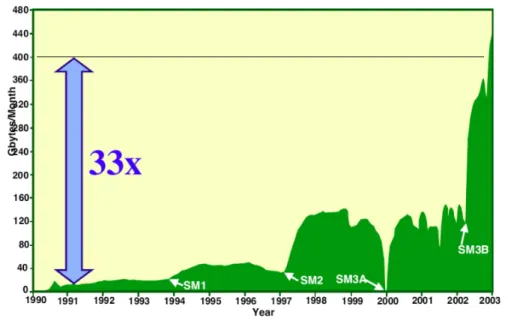
Through maintenance and upgrades, the servicing missions have significantly in-creased the science return of the telescope from its original design. Figure 2-4 shows the amount of science data generated by HST per month.
American Institute of Aeronautics and Astronautics 12
Table 3 – Improvements in Key Observatory Performance Parameters
Parameter Launch 4/1990 SM1 12/1993 SM2 2/1997 SM3A 12/1999 SM3B 3/2002 Data Storage (G bits) 3 No Change 12 21 No Change Processing Power (MIPS) .4 4.6 No Change 91 No Change Total Available Power (W) 2495 2495 2270 2150 2835 Power Available to Sis (W) 1080 1190 1035 1000 1760 Power Required by Sis (W) 500 465 690 655 1260 Cryogenic Cooling None None Frozen
nitrogen 70K
None Mechanical Cryocooler
74K Peak Science Jitter (mas,
60-second rms) due to all disturbances
39 21 No Change No Change 14
Quiescent Science Jitter (mas, 60-second rms) 3 30% of orbit time 3 35% of orbit time No Change No Change 3 95% of orbit time Aft Shroud Heat Transport
- Radiated 531 466 566 No Change 695
Aft Shroud Heat Transport - Conducted
0 No Change No Change No Change 695
B. Science Data Production
Each servicing mission, except for the third or SM3A, has installed new instruments. Successive instruments for HST were built for less than the proceeding generation. New instruments increased the observing capability by between one and two orders of magnitude across the entire spectrum. The ACS installed on SM3B provided a ten-fold increase in capability over its predecessor. The ability to upgrade science instruments and data systems with developing technology has increased the science data volume by a factor of 33 since the early 1990s. Figure 4 shows the increase in science data returns over the first thirteen years of life of HST.
Figure 4 - Science Data Production
Figure 2-4: Science return from HST between 1990-2003 (from Dedalis [27])
Some important insights from the figure are:
• After each servicing mission, the amount of science data returned increases dramatically. This is because the servicing missions restored HST to full health (via maintenance) and increased the science return (via upgrades).
• By 1999, science operations were halted because four of six RSUs had failed. If servicing were unavailable, HST would not have been repaired, the mission would have ceased, and none of the science data from the year 2000 onwards would have been collected.
The experience of HST has clearly demonstrated that servicing telescopes provided enormous contributions to the scientific community. The benefit of servicing is no longer a theoretical concept.
2.5
Servicing Technology: The How of Servicing
Most spacecraft servicing research has been directed towards the technology of servic-ing. This research has shown that, in order to render a spacecraft serviceable, various requirements are imposed on the system. Satisfying these requirements takes time and costs money. The following is a brief survey of current and planned servicing vehicles and technology demonstrators, which will motivate some of these requirements.
2.5.1
Servicing Technology Testbeds
As of 2007, there are four major programs that are intended to develop and demon-strate technologies that are required for spacecraft servicing.
1. ETS-7 (1997) was a Japanese testbed to demonstrate docking technologies. It consisted of two spacecraft: a target and a chaser. The target was a cooperative satellite, which means it maintained attitude control and had markers painted on the satellite to aid the chaser in its approach. The chaser used a combination of GPS and LIDAR to approach a target satellite from up to several kilometres away, and optical sensors to detect the markers on the target for final docking
procedures within 2 metres. The test demonstrated technologies needed to
perform operations such as refuelling, structural deployment, and component replacement. [30, 31, 32]
2. Demonstration for Autonomous Rendezvous Technology (2005), or DART, was a NASA testbed for proximity algorithms and operations. The DART spacecraft was to perform a sequence of manoeuvres around a pre-deployed MUBLCOM satellite. MUBLCOM acted as the target and was equipped with retroreflectors as navigation aids for the servicer. The mission was a par-tial success, but the DART spacecraft inadvertently collided with the target and ended the mission prematurely. [33, 34]
3. Orbital Express (2007) is a DARPA/Boeing spacecraft to test orbital servicing technologies. The mission consists of two spacecraft: a servicer (ASTRO) and a
target (NEXTSat). ASTRO is a servicing technology testbed, and NEXTSat is a prototype for future serviceable spacecraft. The main servicing tasks that will be tested include fuel replenishment and replacement of modularized spacecraft components [34].
4. Spacecraft for the Universal Modification of Orbits (2010), or SUMO, is a DARPA spacecraft that can dock with satellites without specialized mark-ings or fixtures. It uses a large set of cameras to detect the target satellite and uses multiple robotic arms to attach itself to launch fixture holes on the target. SUMO is often called an “orbital tow truck”: it will dock with satellites in GEO and provide sufficient delta-v to modify their orbits. SUMO operates autonomously due to the large time delay between Earth and GEO, which pre-cludes teleoperation of the precise, time-dependent motions that the spacecraft is required to perform [35, 36].
2.5.2
Technical Requirements for Servicing
The programs described above have demonstrated that the target spacecraft have several requirements placed on them in order to enable servicing, including:
• Failure Identification: The target spacecraft must be able to determine which components failed, so that the servicer can repair all necessary components. • Docking Mechanism: The target spacecraft must allow the servicer to dock with
it. Generally this is accomplished by attaching a docking interface to the target spacecraft exterior.
• Docking Cooperation: The target spacecraft must be equipped with docking aids to assist the servicer during proximity operations. Docking aids can either be passive (retroreflectors, optical targets, etc) or active (sensors, beacons). • Attitude Control : The target spacecraft must be stabilized prior to servicer
inertial space (as telescopes often do), or the target can control its attitude in tandem with the approaching servicer spacecraft. If the target is free-floating (which may occur as a result of a major systems failure), it is very difficult for the servicer to dock, and the servicer would require very specialized equipment to attempt docking.
• Accessibility: The target spacecraft must grant the servicer access to internal systems. This may include ports for fuel and electrical power, as well as external doors to provide access to internal components that will be repaired.
• Modularization: Replaceable components onboard the target must be designed to be removeable by the servicer. Modular designs must consider the capabilities of the system that perform the replacement, whether it is robotic or an astronaut on EVA. Note that modularization may incur cost and mass penalties due to a lower packing efficiency and an increased number of interfaces.
The lesson here is that servicing places major design requirements on a serviceable spacecraft. Satisfying these requirements will incur additional mass and costs in the design phase. If these costs cannot be justified, then program managers will drop serviceability from the spacecraft design.
2.6
Previous Spacecraft Servicing Studies
Servicing operations are invariably expensive, so to be incorporated in future space programs, servicing must be economically justified to program managers, particularly when faced with budget and schedule pressures. Various studies have attempted to analyze the economics of servicing. Reynerson [37] created a mathematical model to analyze the value of servicing for a constellation of satellites. The constellation includes multiple satellites in different orbits and planes, and it is serviced by a reusable servicer spacecraft which transfers to the orbit of the satellite needing repair. Servicing operations consist of replacing a percentage of the satellite mass, either by
component replacement or by refuelling. When the servicer is not in use, it is parked at an orbital servicing depot, which contains replacement units and extra fuel.
Reynerson uses the metric of lifecycle cost savings to determine whether or not servicing is valuable for a particular combination of constellation and servicing ar-chitectures. In the model, servicing operations can both increase and decrease the lifecycle cost of the constellation. On the one hand, servicing extend the life of satel-lites in the constellation. To maintain the constellation at full capacity, satelsatel-lites that fail must be replaced by spares launched from Earth, so over the life of the program, if the satellites operate for longer, less spares must be sent into orbit. As less spares are needed, the constellation lifecycle cost goes down. On the other hand, the de-velopment and deployment of the servicing spacecraft and orbital depot themselves incur additional costs. If the overall effect of these two cost drivers is to decrease the lifecycle cost of the mission, then servicing is declared valuable.
This is a common approach used to analyze servicing, but it suffers from two limitations. First, it does not account for any benefits associated with satellite up-grades. The analysis implicitly assumes that servicing maintains the constellation at its original capacity, with no regard for changes to the constellation that could increase benefits. Indeed, Joppin notes that maintenance operations alone generally cannot justify servicing programs [16]. Second, the approach explicitly requires the cost of servicing to be modelled. Servicing technology, particularly robotic servicing, is highly uncertain because it is still under development, so cost models of servicing missions also have a high degree of uncertainty. Thus, if the value calculation uses a servicing cost quantity, then the results are suspect. Modellers must aim to avoid including the cost of servicing in order to decrease the uncertainty in the results.
2.7
Previous Telescope Servicing Studies
Most research on the value of servicing has been for programs with revenue-generating satellites, since standard Net Present Value (NPV) calculations can be applied on such programs. Space telescopes do not generate revenue, and as such there are fewer
studies that have focussed on the value of telescope servicing. There have been a few notable studies, which are described in this section.
2.7.1
To Service a Space Telescope
Joppin [17] developed a computer simulation to determine the change in telescope science return over its lifetime with different types of servicing operations. Three servicing types were considered:
• Repair any failed components,
• Upgrade bus instruments when new technology becomes available, and • Upgrade the science instruments when new technology is available.
Joppin determined the increase in science return with combinations of the above tasks as compared to a baseline case where the telescope receives no servicing.
The simulation captures the effect of both uncertainty and management decision-making on science return. It incorporates four sources of uncertainty: failure time of the telescope, failure of servicing mission, arrival time of new bus technology, and arrival time of new science instrument technology. As well, the simulation captures the actions of program managers through a decision model. The decision model evaluates the program at discrete time steps and determines when servicing missions are sent based on a set of pre-defined decision rules.
The result of the simulation was a set of probability distributions of the cumulative science return of the telescope program for each servicing type. Figure 2-5 shows the probability distribution for two cases. In both cases, the science return is normalized to one, which corresponds to the return of a telescope with no servicing. Case (a) is where servicing includes both repairs and upgrades, and the mean science return is about 300 with a maximum return of 2100. Case (b) is where servicing includes repair only (no upgrades), and the mean science return is about 5 and with a maximum return of 14. Joppin concludes that servicing for the purposes of maintenance alone

![Figure 2-2: Example of focussing on benefits when discussing the value of servicing (from Lester [7])](https://thumb-eu.123doks.com/thumbv2/123doknet/14670374.556671/23.918.176.747.92.545/figure-example-focussing-benefits-discussing-value-servicing-lester.webp)

![Figure 2-3: Timeline of instruments installed on HST (adapted from NASA [29])](https://thumb-eu.123doks.com/thumbv2/123doknet/14670374.556671/39.918.239.690.241.853/figure-timeline-instruments-installed-hst-adapted-nasa.webp)
![Figure 2-6: Aggregate HST reliability curve (from Joppin [17])](https://thumb-eu.123doks.com/thumbv2/123doknet/14670374.556671/47.918.243.677.111.423/figure-aggregate-hst-reliability-curve-joppin.webp)