HAL Id: hal-02946896
https://hal.archives-ouvertes.fr/hal-02946896
Submitted on 24 Sep 2020
HAL is a multi-disciplinary open access
archive for the deposit and dissemination of
sci-entific research documents, whether they are
pub-lished or not. The documents may come from
teaching and research institutions in France or
abroad, or from public or private research centers.
L’archive ouverte pluridisciplinaire HAL, est
destinée au dépôt et à la diffusion de documents
scientifiques de niveau recherche, publiés ou non,
émanant des établissements d’enseignement et de
recherche français ou étrangers, des laboratoires
publics ou privés.
Dany Jaffuel, Claudio Rabec, Carole Philippe, Jean-Pierre Mallet, Marjolaine
Georges, Stefania Redolfi, Alain Palot, Carey Suehs, Erika Nogue, Nicolas
Molinari, et al.
To cite this version:
Dany Jaffuel, Claudio Rabec, Carole Philippe, Jean-Pierre Mallet, Marjolaine Georges, et al.. Patterns
of adaptive servo-ventilation settings in a real-life multicenter study: pay attention to volume!.
Res-piratory Research, BioMed Central, 2020, 21, pp.243. �10.1186/s12931-020-01509-7�. �hal-02946896�
R E S E A R C H
Open Access
Patterns of adaptive servo-ventilation
settings in a real-life multicenter study: pay
attention to volume!
Adaptive servo-ventilation settings in real-life conditions
Dany Jaffuel
1,2*, Claudio Rabec
3†, Carole Philippe
4†, Jean-Pierre Mallet
1,2, Marjolaine Georges
4, Stefania Redolfi
3,
Alain Palot
5, Carey M. Suehs
1,6, Erika Nogue
7, Nicolas Molinari
6,8and Arnaud Bourdin
1,2Abstract
Backgrounds: To explain the excess cardiovascular mortality observed in the SERVE-HF study, it was hypothesized that the high-pressure ASV default settings used lead to inappropriate ventilation, cascading negative
consequences (i.e. not only pro-arrythmogenic effects through metabolic/electrolyte abnormalities, but also lower cardiac output). The aims of this study are: i) to describe ASV-settings for long-term ASV-populations in real-life conditions; ii) to describe the associated minute-ventilations (MV) and therapeutic pressures for servo-controlled-flow versus servo-controlled-volume devices (ASV-F Philips®-devices versus ASV-V ResMed®-devices).
Methods: The OTRLASV-study is a cross-sectional, 5-centre study including patients who underwent ASV-treatment for at least 1 year. The eight participating clinicians were free to adjust ASV settings, which were compared among i) initial diagnosed sleep-disordered-breathing (SBD) groups (Obstructive-Sleep-Apnea (OSA), Central-Sleep-Apnea (CSA), Treatment-Emergent-Central-Sleep-Apnea (TECSA)), and ii) unsupervised groups (k-means clusters). To generate these clusters, baseline and follow-up variables were used (age, sex, body mass index (BMI), initial diagnosed Obstructive-Apnea-Index, initial diagnosed Central-Apnea-Index, Continuous-Positive-Airway-Pressure used before ASV treatment, presence of cardiopathy, and presence of a reduced left-ventricular-ejection-fraction (LVEF)). ASV-data were collected using the manufacturer’s software for 6 months.
(Continued on next page)
© The Author(s). 2020 Open Access This article is licensed under a Creative Commons Attribution 4.0 International License, which permits use, sharing, adaptation, distribution and reproduction in any medium or format, as long as you give appropriate credit to the original author(s) and the source, provide a link to the Creative Commons licence, and indicate if changes were made. The images or other third party material in this article are included in the article's Creative Commons licence, unless indicated otherwise in a credit line to the material. If material is not included in the article's Creative Commons licence and your intended use is not permitted by statutory regulation or exceeds the permitted use, you will need to obtain permission directly from the copyright holder. To view a copy of this licence, visithttp://creativecommons.org/licenses/by/4.0/. The Creative Commons Public Domain Dedication waiver (http://creativecommons.org/publicdomain/zero/1.0/) applies to the data made available in this article, unless otherwise stated in a credit line to the data.
* Correspondence:[email protected]
†Claudio Rabec and Carole Philippe contributed equally to this work. 1
Department of Respiratory Diseases, Univ Montpellier, CHU Montpellier, 371, Avenue Doyen Giraud, 34295 Montpellier Cedex 5, France
2PhyMedExp, Univ Montpellier, CNRS, INSERM, CHU Montpellier, Montpellier,
France
(Continued from previous page)
Results: One hundred seventy-seven patients (87.57% male) were analysed with a median (IQ25–75) initial
Apnea-Hypopnea-Index of 50 (38–62)/h, an ASV-treatment duration of 2.88 (1.76–4.96) years, 61.58% treated with an ASV-V. SDB groups did not differ in ASV settings, MV or therapeutic pressures. In contrast, the five generated k-means clusters did (generally described as follows: (C1) male-TECSA-cardiopathy, (C2) male-mostly-CSA-cardiopathy, (C3) male-mostly-TECSA-no cardiopathy, (C4) female-mostly-elevated BMI-TECSA-cardiopathy, (C5) male-mostly-OSA-low-LVEF). Of note, the male-mostly-OSA-low-LVEF-cluster-5 had significantly lower fixed end-expiratory-airway-pressure (EPAP) settings versus C1 (p = 0.029) and C4 (p = 0.007). Auto-EPAP usage was higher in the male-mostly-TECSA-no cardiopathy-cluster-3 versus C1 (p = 0.006) and C2 (p < 0.001). MV differences between ASV-F (p = 0.002) and ASV-V (p < 0.001) were not homogenously distributed across clusters, suggesting specific cluster and ASV-algorithm interactions. Individual data suggest that the hyperventilation risk is not related to the cluster nor the ASV-monitoring type.
Conclusions: Real-life ASV settings are associated with combinations of baseline and follow-up variables wherein cardiological variables remain clinically meaningful. At the patient level, a hyperventilation risk exists regardless of cluster or ASV-monitoring type, spotlighting a future role of MV-telemonitoring in the interest of patient-safety. Trial registration: The OTRLASV study was registered on ClinicalTrials.gov (Identifier:NCT02429986). 1 April 2015. Keywords: Adaptive servo-ventilation, Setting, Minute volume, Tidal volume, Pressure, Cluster, Cardiopathy, Sleep-disordered breathing
Introduction
Adaptive Servo-Ventilation (ASV) is a non-invasive ven-tilatory therapy that provides positive expiratory airway pressure and inspiratory pressure support based on servo-controlled-flow or -volume monitoring [1–4]. At the beginning of the 2000s, ASV was mainly developed for the treatment of central sleep apnea (CSA) associated with Chronic Heart Failure (CHF) and reduced Left Ventricular Ejection Fraction (LVEF, i.e. LVEF ≤45%) [5]. Unlike preliminary data demonstating short term benefits in terms of symptoms and physiology [6], the randomized SERVE-HF study reported an unexpected increase in cardiovascular mortality with ASV-treatment [7]. To explain these conflicting results, it was hypothe-sized that the high-pressure ASV default settings used in the SERVE-HF study could lead to an inappropriate ven-tilation with cascading negative consequences (i.e. not only pro-arrythmogenic effects through alkalosis and hypocapnia related to hyperventilation, but also a direct lower cardiac output through ASV-pressurization) [8– 10]. In these CHF patients with reduced LVEF, the detri-mental cardiovascular effects of alkalosis and hypocapnia consecutive to the ASV related hyperventilation remains theoretical. Indeed, no published study describing simul-taneously measured ASV minute-volume (MV) and physiopathological data currently exists, despite a related passionate debate [11–14]. However, the potential nega-tive effects of posinega-tive airway pressure support on car-diac output have been clearly demonstrated [15–19]. In this context, a specific warning against the use of high expiratory positive airway pressure (EPAP) in reduced LVEF patients exists [20]. Simultaneously, the auto-EPAP modes developed by ASV-manufacturers are
available in daily practice, but lack an evidence base for superiority on fixed-EPAP in clinical and bench studies [2, 21], and consensual recommendations are clearly absent. The potential for cardiac output wors-ening due to specific pressure levels is not always counterbalanced by the neurovegetative response [19,
20, 22] and at-risk patients are likely those with a low pulmonary capillary wedge pressure [18] and a right ventricular dysfunction [19].
Notwithstanding the physiopathologic reasons for the observed cardiovascular mortality in the SERVE-HF study, whether the SERVE-HF results (a study per-formed with a volume monitored ASV (ASV-V)), can be extrapolated to non-SERVE-HF patients and/or patients treated with a flow monitored ASV (ASV-F) remains un-known. This is all the more important since the SERVE-HF “phenotype” (i.e. patients with CSA and a LVEF ≤45%) represents only 5.8 to 13.5% of the ASV-treated population [23–26].
Paradoxically, real-life data describing ASV-settings and their associated flow- versus volume- controlled monitoring are sparse [27, 28], and current recommen-dations [29, 30] do not mention ASV-setting guidelines of any kind. As a consequence, ASV-settings are empir-ical in nature and left to each physician’s discretion. In particular, how two important factors, (i) patient aetiol-ogies/comorbidities and (ii) servo-monitoring type, com-bine and simultaneously impact ASV-settings is unknown and therefore, ASV settings remain expertise-dependent.
OTRLASV (Observational Transversal Real-life Study of ASV) is a multicentric cross-sectional study describ-ing a cohort of patients who have undergone ASV for at
least 1 year in real-life conditions. In a previous publica-tion [24], we described the clinical characteristics and cardiological/pulmonary monitoring of these patients. With the objective of filling the literature gap left by the under-reporting of ASV-settings, the primary objective of the present paper is to describe the latter according to aetiologies/comorbidities. Secondarily, we describe and compare the related MV and therapeutic pressures for flow- versus volume-monitored ASV to explore a poten-tial ASV-monitoring type effect.
Methods
Study design
The OTRLSAV study is an observational, cross-sectional, five-expert-centre study conducted on an ex-haustive cohort of consecutive patients treated for at least 1 year with ASV for sleep apnea (ClinicalTrials.gov
Identifier: NCT02429986). The protocol complied with the Declaration of Helsinki and was reviewed and ap-proved by an independent ethics committee (Comité de Protection des Personnes “Sud Méditérannée III”; refer-ence number 2014.11.04).
Detailed data about the global study design, proce-dures, demographic or sleep characteristics have been previously published [24]. The complementary ASV-setting analyses reported here focus on the unpublished ASV-treatment modalities of the 177-patient population. There were no ASV-setting recommendations estab-lished among the 5 centres and the 8 participating clinicians were free to choose ASV-brands and adjust ASV-settings as they saw fit.
Study population
The study flow chart is depicted in Additional file 1. Two analyses of ASV settings and software-measured data were performed. Considering that initial diagnosis may impact ASV-settings and in line with our previous report [24], the first analysis was based on the initial di-agnosed sleep-disordered breathing (SBD) groups (i.e., Central-Sleep-Apnea (CSA), Obstructive-Sleep-Apnea (OSA), and Treatment-Emergent-Central-Sleep-Apnea (TECSA) groups). How SDB groups were determined is detailed in Additional file 2 and previous reports [24,
25]. Because our previous publication demonstrated that ASV-settings could be modified over time consecutive to polygraphy/oxymetry monitoring [24], the second ana-lysis was made on unsupervised groups created via a clustering algorithm combining baseline and follow-up variables (further details are given in the statistics section).
Clinical data
The clinical information collected for the analysis in-cluded age, sex, anthropometry, the apnoea-hyponoea
index (AHI; determined by initial polysomnography (PSG) or respiratory polygraphy (PG)), and the Epworth Sleepiness Scale (ESS). The presence/absence of (i) a continuous positive airway pressure (CPAP) trial prior to ASV initiation, (ii) cardiomyopathy and (iii) an altered LVEF were also noted.
Device-collected data
Included patients were treated either by an ASV-F de-vice (the BiPAP autoSV Advanced Sytem One or the BiPAP auto SV Advanced Dreamstation (Philips Respironics®, Murrysville, PA, USA)), or an ASV-V de-vice (the Resmed AirCurve 10 CS PaceWave or the ResMed S9 AutoSet CS (a device without auto-adjusting expiratory positive airway pressure (EPAP), which is similar to the S9 VPAP Adapt used in ASV mode with fixed EPAP, historically marketed in the United States), Resmed®, Sydney, Australia)).
ASV data were collected using the manufacturer’s soft-ware. Data downloads were performed for the 6 months preceding the inclusion date regardless of the ASV-initiation date. Settings were detailed as follows: expira-tory positive airway pressure (EPAP; fixed or minimum/ maximum), inspiratory pressure support (IPS, minimum and maximum), maximum pressure, fixed backup re-spiratory rate (RR) or auto backup RR, and for the Philips Respironics device, the inspiratory support mini-mum pressurization time and slope level. The associated device-reported outcomes were summarized as follows: usage reported as the average hours/night for 6 months, residual AHI (AHIflow), a centrality measure for residual
leaks (mean percentage of important leaks for Philips Respironics® devices, median unintentional leaks for Resmed® devices), mean/median RR, mean/median minute-ventilation (MV), and therapeutic pressures. In addition, we collected the interface type, and the pres-ence of a heated humidifier/breathing tube.
Tidal volumes were obtained by dividing the measured volume-minute by device-RR. The theoretical tidal vol-ume was calculated using an 8 ml/kg of ideal weight for-mula. Ideal weights were calculated according to the Lorentz equation [31].
Statistical analyses
Continuous data were expressed as medians and inter-quartile ranges (IQ25–75). Qualitative parameters were
expressed as numbers and percentages. Group compari-sons were performed using ANOVA or Kruskal-Wallis tests for quantitative data. Qualitative variables were compared using Chi-square or Fisher exact tests. In case of a significant global effect, pairwise comparisons were performed using Holm corrections for multiple compari-sons. A bilateral p value of < 0.05 was considered as indicating statistical significance. Data were pooled for
ASV-setting variables common to both manufacturers (EPAP (fixed or minimum/maximum); IPS (minimum and maximum), maximum pressure, RR or auto RR). Otherwise, for IPS slope level and minimum inspiratory time, the data concerned only Philips Respironics devices.
Clustering methods were performed on standardized data after mean-imputation of missing values. Ascending hierarchical classification (AHC) using Ward’s method was used to determine the optimal number of clusters (k). Subsequently, k-means clustering, initialized from the barycentres of the AHC partition, was performed to divide the population into k homogeneous groups. The variables used to establish clusters were: age, sex, body mass index (BMI), initial PG/PSG Obstructive Apnea Index (OAI/h), initial PG/PSG Central Apnea Index (CAI/h), CPAP previously used before ASV treatment, presence of cardiopathy, and presence of reduced LVEF.
All analyses were conducted by the Department of Re-search and Medical Information at the Montpellier Uni-versity Hospitals using statistical software (SAS Enterprise Guide, version 7.3; SAS Institute; Cary, North Carolina, USA).
Results
The 177 patients (87.6% male) analysed had a median age of 71 (IQ25–75: 65–77) years, a median body mass index of 29.9 (26.6–34.0) kg/m2
, and a median initial AHI of 50/h (38–62). Sixty-eight patients (38.42%) were treated with F devices, and 109 (61.58%) via ASV-V devices. The median duration of ASASV-V treatment was 2.88 years (1.76–4.96).
SDB group comparisons
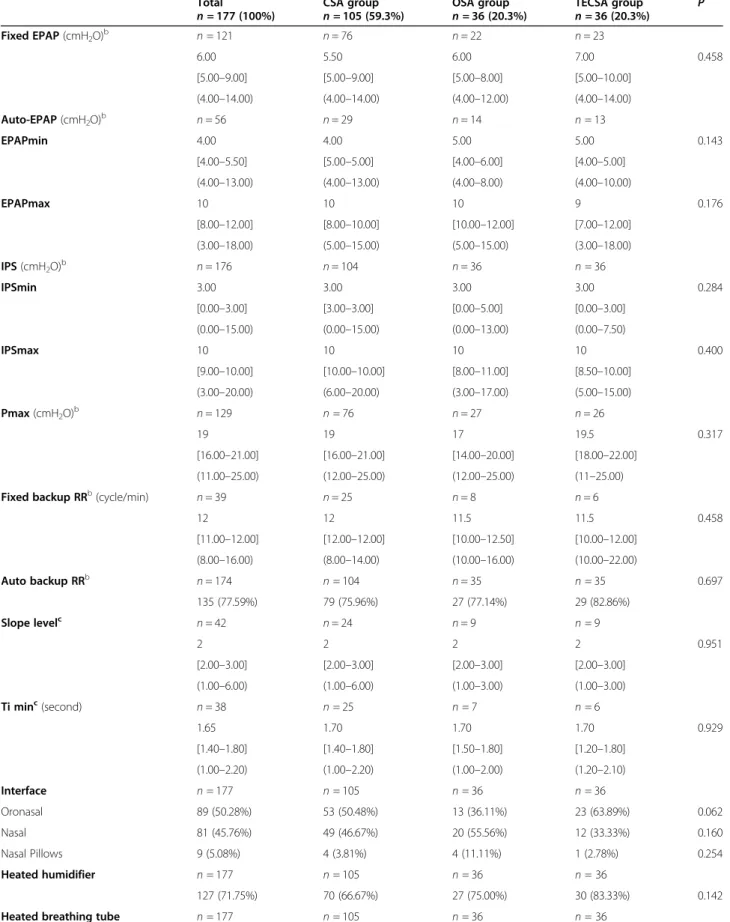
Table 1 summarises ASV-settings data for the SDB groups (CSA, OSA, and TECSA groups). No significant differences were found between SDB groups except for the presence/absence of heated breathing tube usage, which was more prevalent in the OSA group than in the CSA group. Of note, auto-EPAP usage was similar be-tween the SDB groups (p = 0.369).
Table2 summarizes ASV-software MV data according to manufacturers and Additional file 3 reports ASV-software measured data. For a given manufacturer, no significant SDB group differences were found for MV or therapeutic pressures.
K-means cluster comparisons
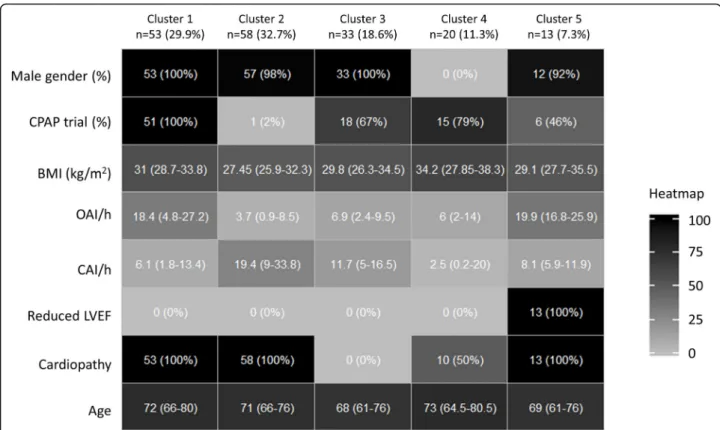
Five patient clusters were determined and Fig.1presents a heatmap indicating descriptive statistics for each “con-struction variable” per cluster. These variables were used to create the clusters, and so logically differed.
The first cluster is composed of male patients initialy treated with a CPAP device for a mixed sleep apnea
syndrome (with a majority of obstructive apnea); these patients present a cardiopathy without reduced LVEF. Cluster 2 is predominantly composed of male patients without an initial CPAP trial for a mixed sleep apnea syndrome (with a majority of central apnea); these pa-tients also present a cardiopathy without altered LVEF. Cluster 3 is composed of male patients without cardiop-athy, but a mixed sleep apnea syndrome (with a majority of central apnea); 66.67% of these patients had an initial CPAP trial. Cluster 4 is composed of female patients with an initial CPAP trial (78.95%) for a mixed sleep apnea syndrome (with a majority of hypopnea); these pa-tients present an increased BMI, and 50% a cardiopathy without altered LVEF. Cluster 5 is predominantly com-posed of male patients with reduced LVEF, initialy treated with a CPAP device (46.15%) for a mixed sleep apnea syndrome (with a majority of obstructive apnea).
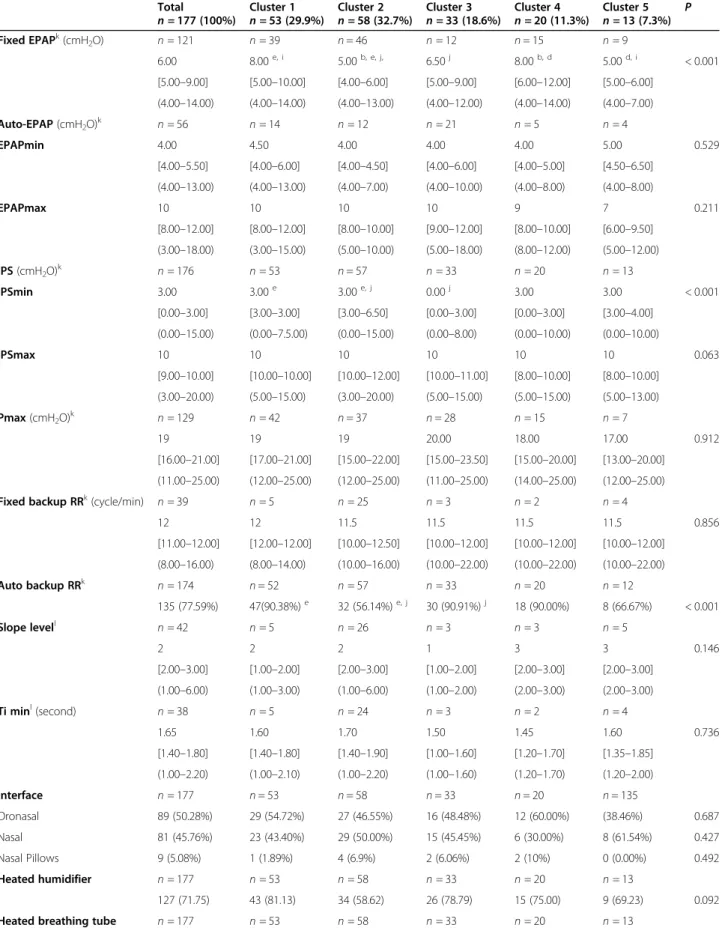
Additional file 4 and Table 3 respectively summarize the general/sleep characteristics and the ASV-settings data for these patient clusters. Statistical differences be-tween clusters were found for the following “non-con-structive” variables: fixed EPAP, minimum IPS and auto backup RR. In particular, reduced-LVEF-cluster-5 was associated with a significantly lower fixed EPAP level in comparison with clusters 1 (p = 0.029) and 4 (p = 0.007). Auto-EPAP usage also differed between the 5 clusters (p < 0.001) with pairwise comparisons demonstrating higher auto-EPAP use in the “no cardiopathy”-cluster-3 in comparison with “presence of cardiopathy”-clusters 1 and 2 (respectively p = 0.006 and < 0.001). Versus cluster-3, cluster-1 is characterized by a higher OAI/h and a higher initial CPAP-trial rate (respectively p = 0.04 and < 0.001).
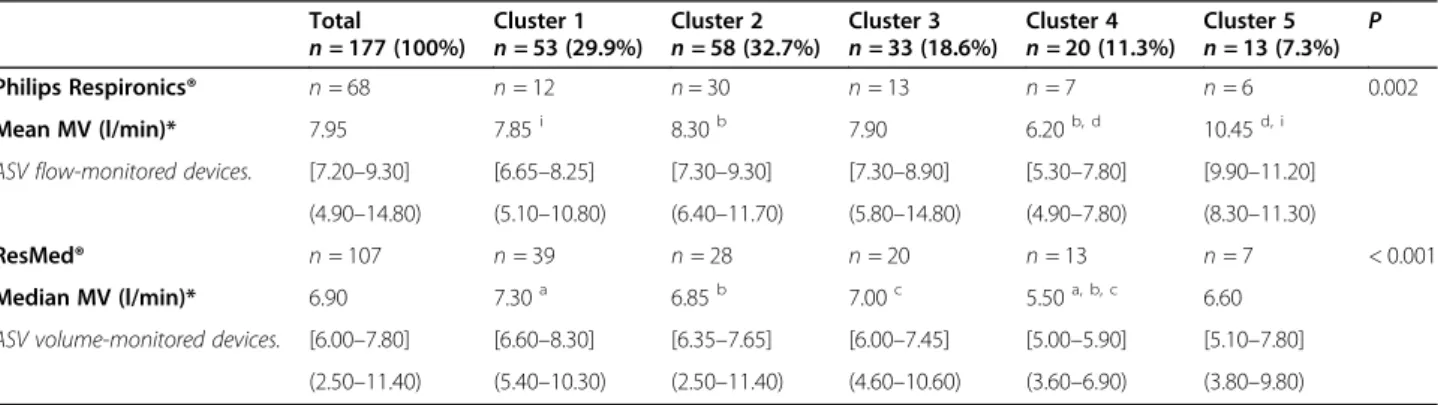
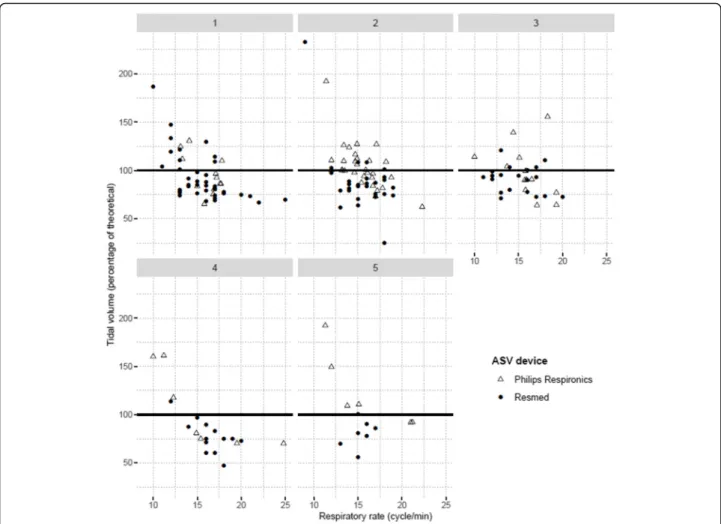
Table 4 depicts MV depending on ASV-monitoring-based and cluster-ASV-monitoring-based groups. For ASV-F (Philips Respironics® Devices) and ASV-V (Resdmed® devices), cluster MV differences exist (respectively p = 0.002 and p < 0.001), but the latter are not identical. Indeed, for ASV-F treated patients, reduced-LVEF-cluster-5 was as-sociated with a higher MV than clusters 1 (p = 0.019) and 4 (p = 0.001), and cluster-2 was associated with higher MV than cluster-4 (p = 0.016). For ASV-V treated patients, a lower MV exists for cluster-4 versus clusters 1 (p < 0.001), 2 and 3 (both p = 0.004). Figure 2 depicts per-patient respiratory rates versus tidal volume (as a percentage of theorical tidal volume). All clusters dem-onstrate the presence of standardized tidal volumes over 100%, indicating a corresponding, homogenously-present risk for hyperventilation. Additional file 5 re-ports ASV-software measured data for EPAPs, IPSs and RR. Significant cluster differences again exist for Philips Respironics devices, but not for ResMed devices. In par-ticular, the measured mean 90th EPAP is higher for cluster-3 versus cluster-2 (p = 0.001) and mean IPS is
Table 1 Adaptive servo-ventilation settings for the OTRLASV population based on initial sleep-disordered-breathing diagnostic
groups
Total
n = 177 (100%) CSA groupn = 105 (59.3%) OSA groupn = 36 (20.3%) TECSA groupn = 36 (20.3%) P Fixed EPAP (cmH2O)b n = 121 n = 76 n = 22 n = 23 6.00 5.50 6.00 7.00 0.458 [5.00–9.00] [5.00–9.00] [5.00–8.00] [5.00–10.00] (4.00–14.00) (4.00–14.00) (4.00–12.00) (4.00–14.00) Auto-EPAP (cmH2O)b n = 56 n = 29 n = 14 n = 13 EPAPmin 4.00 4.00 5.00 5.00 0.143 [4.00–5.50] [5.00–5.00] [4.00–6.00] [4.00–5.00] (4.00–13.00) (4.00–13.00) (4.00–8.00) (4.00–10.00) EPAPmax 10 10 10 9 0.176 [8.00–12.00] [8.00–10.00] [10.00–12.00] [7.00–12.00] (3.00–18.00) (5.00–15.00) (5.00–15.00) (3.00–18.00) IPS (cmH2O)b n = 176 n = 104 n = 36 n = 36 IPSmin 3.00 3.00 3.00 3.00 0.284 [0.00–3.00] [3.00–3.00] [0.00–5.00] [0.00–3.00] (0.00–15.00) (0.00–15.00) (0.00–13.00) (0.00–7.50) IPSmax 10 10 10 10 0.400 [9.00–10.00] [10.00–10.00] [8.00–11.00] [8.50–10.00] (3.00–20.00) (6.00–20.00) (3.00–17.00) (5.00–15.00) Pmax (cmH2O)b n = 129 n = 76 n = 27 n = 26 19 19 17 19.5 0.317 [16.00–21.00] [16.00–21.00] [14.00–20.00] [18.00–22.00] (11.00–25.00) (12.00–25.00) (12.00–25.00) (11–25.00) Fixed backup RRb(cycle/min) n = 39 n = 25 n = 8 n = 6
12 12 11.5 11.5 0.458 [11.00–12.00] [12.00–12.00] [10.00–12.50] [10.00–12.00] (8.00–16.00) (8.00–14.00) (10.00–16.00) (10.00–22.00) Auto backup RRb n = 174 n = 104 n = 35 n = 35 0.697 135 (77.59%) 79 (75.96%) 27 (77.14%) 29 (82.86%) Slope levelc n = 42 n = 24 n = 9 n = 9 2 2 2 2 0.951 [2.00–3.00] [2.00–3.00] [2.00–3.00] [2.00–3.00] (1.00–6.00) (1.00–6.00) (1.00–3.00) (1.00–3.00) Ti minc(second) n = 38 n = 25 n = 7 n = 6 1.65 1.70 1.70 1.70 0.929 [1.40–1.80] [1.40–1.80] [1.50–1.80] [1.20–1.80] (1.00–2.20) (1.00–2.20) (1.00–2.00) (1.20–2.10) Interface n = 177 n = 105 n = 36 n = 36 Oronasal 89 (50.28%) 53 (50.48%) 13 (36.11%) 23 (63.89%) 0.062 Nasal 81 (45.76%) 49 (46.67%) 20 (55.56%) 12 (33.33%) 0.160 Nasal Pillows 9 (5.08%) 4 (3.81%) 4 (11.11%) 1 (2.78%) 0.254 Heated humidifier n = 177 n = 105 n = 36 n = 36 127 (71.75%) 70 (66.67%) 27 (75.00%) 30 (83.33%) 0.142 Heated breathing tube n = 177 n = 105 n = 36 n = 36
higher for cluster-2 versus cluster-1 (0.043). For a given manufacturer brand, there is no significant difference between clusters for AHIflow, leaks and ASV-observance.
Discussion
The SERVE-HF study raised serious concerns about ASV safety [7]. It was hypothesized that the hyper-ventilation associated with high-pressure ASV default settings in SERVE-HF could explain the higher car-diovascular mortality observed [8–10]. To the best of our knowledge, we report herein in long-term pa-tients treated with different ASV servo-controlled monitoring type, the first real life description of dif-ferences in ASV-settings and the resulting minute-ventilations/therapeutic pressures associated with un-supervised patient-clusters. Our multicentre study spotlights four main results: i) certain clusters are as-sociated with different ASV-settings; ii) certain clus-ters are associated with differences in MV; iii) MV differences between ASV-F and ASV-V are not homo-genously distributed across clusters, suggesting spe-cific cluster and ASV-algorithm interactions; iv) individual data suggest that at the patient-level, the
risk of hyperventilation is present regardless of cluster or ASV servo-controlled monitoring type.
ASV-setting associations with initial SDB-diagnostic-based groups and aetiology/comorbidity-based clusters
To date, there are no ASV-settings mentioned in rele-vant recommendations [29, 30]. In pratice, for ventilation-naive patients, clinicians have the choice between manufacturer default ASV-settings and patient-individualized ASV-settings. There are also no contemporary long-term clinical trials comparing these two modalities, but results from a bench test study are in favor of manually implementing individu-alized ASV-settings [2]. For previously CPAP-treated patients, starting the ASV-setting titration at or near the CPAP level was proposed (the EPAP pressure level was adjusted up to a maximum of 10 cmH2O
and the manufacturer default inspiratory pressure range was allowed to vary between 5 and 10 cmH2O
above the EPAP) [32].
In our study, the 8 expert clinicians were free to adjust ASV-settings as they saw fit. We report herein that pa-tient ASV-settings do not differ between initial
SDB-Table 1 Adaptive servo-ventilation settings for the OTRLASV population based on initial sleep-disordered-breathing diagnostic
groups (Continued)
Total
n = 177 (100%) CSA groupn = 105 (59.3%) OSA groupn = 36 (20.3%) TECSA groupn = 36 (20.3%) P 47 (26.55%) 20 (19.05%)a 18 (50.00%)a 9 (25.00%) 0.001 Quantitative variables were summarized using medians, [IQ25–75] and (min– max), while categories were described by numbers and (%). The total percentage for
interfaces is > 100% because multiple interfaces were used by 2 patients Significant pairwise comparisons with Holm corrections are presenteda
for CSA vs. OSA groups
CSA Central sleep apnea, EPAP Expiratory positive airway pressure, IPS Inspiratory pressure support, max maximum, min minimum, OSA Obstructive sleep apnea, Pmax maximum pressure, RR Respiratory rate, TECSA Treatment emergent central sleep apnea, Ti min Inspiratory support minimum pressurization time
b
For ASV-setting variables shared by both manufacturers, the data were pooled (EPAP (fixed or minimum/maximum); IPS (minimum and maximum), Pmax, RR or auto RR)
c
For slope level and minimum inspiratory time, the data concern only Philips Respironics devices
Table 2 Minute-ventilation mean/medians for adaptive servo-ventilation treatment according to initial sleep-disordered-breathing
diagnostic groups and device types
Total
n = 177 (100%) CSA groupn = 105 (59.3%) OSA groupn = 36 (20.3%) TECSA groupn = 36 (20.3%) P Philips Respironics® n = 68 n = 36 n = 18 n = 14 0.156
Mean MV (l/min)* 7.95 7.85 8.20 7.85
ASV flow-monitored devices. [7.20–9.30] [7.20–8.95] [7.50–10.40] [6.20–9.60] (4.90–14.80) (4.90–11.70) (5.80–14.80) (5.10–11.20)
ResMed® n = 107 n = 68 n = 18 n = 21 0.258
Median MV (l/min)* 6.90 7.00 6.50 6.60
ASV volume-monitored devices. [6.00–7.80] [6.30–7.75] [5.80–7.50] [5.90–8.50] (2.50–11.40) (3.60–11.40) (2.50–10.10) (3.80–10.40) Variables were summarized using medians, [IQ25–75] and (min– max)
*Note that for Philips Respironics® devices, the minute-ventilation is expressed as“mean” in the manufacturer software whereas for ResMed® devices, the minute-ventilation is expressed as“median” (thus preventing direct comparisons between these device types)
diagnostic-based groups (i.e. OSA, CSA or TECSA). This is not surprising if we consider that: i) our ASV-population consists of long-term treated-patients (me-dian ASV duration is 2.88 years, 25% treated for more than 4.96 years); ii) regardless of the the ASV-initiation date, we have previously reported that 34.4% of the pa-tients were monitored (polygraphy/oximetry) for 6 months preceding inclusion with a consecutive ASV-settings change performed among 18.2% of them [24]; and iii) the initial difference between SDB-diagnostic-based groups was the initial apnea pattern, whereas these patients also presented hypopnea events with un-defined central or obstructive patterns.
Our study spotlights the real-life choices made by expert-clinicians. First, for patients presenting both reduced-LVEF and an initial obstructive apnea diagnosis pattern (Cluster-5 in our study), the majority of our ex-perts chose “safety first,” i.e. they chose a significantly lower EPAP level in comparison with clusters paradoxic-ally characterized by a lower OAI/h. The latter was likely meant to prevent deleterious hemodynamic effects on cardiac output [16,17,33,34]. Importantly for cluster-5, the choice of a lower EPAP was not associated with a significant increase in the residual IAHflow, suggesting
that a“safety-first” attitude did not sacrifice efficacity for
these patients. The second interesting choice concerns the auto-EPAP usage in real life by the experts. In the latter mode, the EPAP is automatically adjusted by spe-cific manufacturer algorithms meant to correct obstruct-ive disordered breathing [3, 35]. To date, in terms of correcting obstructive events, the superiority of the auto-EPAP mode over the fixed-EPAP mode for ASV-device has not been demonstrated [2,21,36,37]. In this context, it is important to underline that the auto-EPAP-usage by the experts was significantly different between the five clusters, with pairwise comparisons demonstrating a higher auto-EPAP use in the “no car-diopathy”-cluster-3 in comparison with “presence of cardiopathy”- clusters 1 and 2. Again, this suggests a “safety-first” attitude among the expert clinicians par-ticipating in the study and is supported by AASM and French guidelines recommending not using auto-Positive-Airway-Pressure devices in CHF populations [38–40]. The OTRLASV population is characterized by 59.36% CHF and 30.46% atrial fibrillation. For these cardiologic phenotypes and ASV-treated pa-tients, the deployment of auto-EPAP requires a higher level of evidence. In this context, the scientific com-munity is eagerly awaiting the results of the ADVE NT-HF trial [41].
Fig. 1 Heat map with descriptive statistics for variables used to construct k-means clusters. Quantitative variables were summarized using
medians, [IQ25–75] and (min – max), while categories were described by numbers and (%). Each line represents a variable color-coded from 0 (white; minimum observed value) to 100% (black; maximum observed value). BMI: Body Mass Index; CAI: Central Apnea Index; CPAP: Continuous Positive Airway Pressure; LVEF: left ventricular ejection fraction; OAI: Obstructive Apnea Index
Table 3 Adaptive servo-ventilation settings for the OTRLASV population based on k-means clusters
Total
n = 177 (100%) Cluster 1n = 53 (29.9%) Cluster 2n = 58 (32.7%) Cluster 3n = 33 (18.6%) Cluster 4n = 20 (11.3%) Cluster 5n = 13 (7.3%) P Fixed EPAPk(cmH 2O) n = 121 n = 39 n = 46 n = 12 n = 15 n = 9 6.00 8.00e, i 5.00b, e, j, 6.50j 8.00b, d 5.00d, i < 0.001 [5.00–9.00] [5.00–10.00] [4.00–6.00] [5.00–9.00] [6.00–12.00] [5.00–6.00] (4.00–14.00) (4.00–14.00) (4.00–13.00) (4.00–12.00) (4.00–14.00) (4.00–7.00) Auto-EPAP (cmH2O)k n = 56 n = 14 n = 12 n = 21 n = 5 n = 4 EPAPmin 4.00 4.50 4.00 4.00 4.00 5.00 0.529 [4.00–5.50] [4.00–6.00] [4.00–4.50] [4.00–6.00] [4.00–5.00] [4.50–6.50] (4.00–13.00) (4.00–13.00) (4.00–7.00) (4.00–10.00) (4.00–8.00) (4.00–8.00) EPAPmax 10 10 10 10 9 7 0.211 [8.00–12.00] [8.00–12.00] [8.00–10.00] [9.00–12.00] [8.00–10.00] [6.00–9.50] (3.00–18.00) (3.00–15.00) (5.00–10.00) (5.00–18.00) (8.00–12.00) (5.00–12.00) IPS (cmH2O)k n = 176 n = 53 n = 57 n = 33 n = 20 n = 13 IPSmin 3.00 3.00e 3.00e, j 0.00j 3.00 3.00 < 0.001 [0.00–3.00] [3.00–3.00] [3.00–6.50] [0.00–3.00] [0.00–3.00] [3.00–4.00] (0.00–15.00) (0.00–7.5.00) (0.00–15.00) (0.00–8.00) (0.00–10.00) (0.00–10.00) IPSmax 10 10 10 10 10 10 0.063 [9.00–10.00] [10.00–10.00] [10.00–12.00] [10.00–11.00] [8.00–10.00] [8.00–10.00] (3.00–20.00) (5.00–15.00) (3.00–20.00) (5.00–15.00) (5.00–15.00) (5.00–13.00) Pmax (cmH2O)k n = 129 n = 42 n = 37 n = 28 n = 15 n = 7 19 19 19 20.00 18.00 17.00 0.912 [16.00–21.00] [17.00–21.00] [15.00–22.00] [15.00–23.50] [15.00–20.00] [13.00–20.00] (11.00–25.00) (12.00–25.00) (12.00–25.00) (11.00–25.00) (14.00–25.00) (12.00–25.00) Fixed backup RRk(cycle/min)
n = 39 n = 5 n = 25 n = 3 n = 2 n = 4 12 12 11.5 11.5 11.5 11.5 0.856 [11.00–12.00] [12.00–12.00] [10.00–12.50] [10.00–12.00] [10.00–12.00] [10.00–12.00] (8.00–16.00) (8.00–14.00) (10.00–16.00) (10.00–22.00) (10.00–22.00) (10.00–22.00) Auto backup RRk n = 174 n = 52 n = 57 n = 33 n = 20 n = 12 135 (77.59%) 47(90.38%)e 32 (56.14%)e, j 30 (90.91%)j 18 (90.00%) 8 (66.67%) < 0.001 Slope levell n = 42 n = 5 n = 26 n = 3 n = 3 n = 5 2 2 2 1 3 3 0.146 [2.00–3.00] [1.00–2.00] [2.00–3.00] [1.00–2.00] [2.00–3.00] [2.00–3.00] (1.00–6.00) (1.00–3.00) (1.00–6.00) (1.00–2.00) (2.00–3.00) (2.00–3.00) Ti minl(second) n = 38 n = 5 n = 24 n = 3 n = 2 n = 4 1.65 1.60 1.70 1.50 1.45 1.60 0.736 [1.40–1.80] [1.40–1.80] [1.40–1.90] [1.00–1.60] [1.20–1.70] [1.35–1.85] (1.00–2.20) (1.00–2.10) (1.00–2.20) (1.00–1.60) (1.20–1.70) (1.20–2.00) Interface n = 177 n = 53 n = 58 n = 33 n = 20 n = 135 Oronasal 89 (50.28%) 29 (54.72%) 27 (46.55%) 16 (48.48%) 12 (60.00%) (38.46%) 0.687 Nasal 81 (45.76%) 23 (43.40%) 29 (50.00%) 15 (45.45%) 6 (30.00%) 8 (61.54%) 0.427 Nasal Pillows 9 (5.08%) 1 (1.89%) 4 (6.9%) 2 (6.06%) 2 (10%) 0 (0.00%) 0.492 Heated humidifier n = 177 n = 53 n = 58 n = 33 n = 20 n = 13 127 (71.75) 43 (81.13) 34 (58.62) 26 (78.79) 15 (75.00) 9 (69.23) 0.092 Heated breathing tube n = 177 n = 53 n = 58 n = 33 n = 20 n = 13
Pending the results of future ASV-studies, our data suggest that “safety first” strategies are currently driving physician-chosen ASV-settings (i.e. a low EPAP level and a low auto-EPAP usage for patients with a reduced LVEF and cardiopathy, respectively). Pragmatically, it would be helpful i) to verify the impact of ASV-settings on heart function using echocardiography [17, 19, 20], digital photoplethysmography [42] or bioimpedance-based monitorings [19]; ii) to perform night-monitoring of ASV-settings with polysomnography, transcutaneous capnometry and simultaneous non-invasive measures of diastolic blood pressure / heart rate variation in order to evaluate not only ASV effects on AHI and sleep but also the absence of negative ASV effects on sympathovagal balance [22].
Relationships between minute-volume, SDB-diagnosis-based groups, aetiology/cormorbidity clusters, and flow-versus volume-controlled monitoring
In their short-term study (mean follow-up time was 8.2 ± 3.0 weeks), Westhoff and Litterst describe the
relationship between patient phenotypes and the associ-ated MV resulting from an ASV-V device (Auto-CS-2 ResMed®) [28]. Neither MV nor therapeutic pressure dif-ferences were observed between TECSA (without ele-vated BNP/NT-pro-BNP) versus mixed apnea patients (with predominantly central pattern and elevated BNP/ NT-pro-BNP). Based on our initial SDB-diagnostic-based group comparisons, we report similar results for both ASV-V and ASV-F devices.
Knitter et al. previously attempted to describe MV dif-ferences between ASV-F and ASV-V devices in TECSA patients with preserved LVEF [4]. The latter study con-sisted of a randomized cross-over study comparing 4 de-vices (each used for one night only) and concluded that the ResMed S7 VPAP Adapt (an ASV-V device) was as-sociated with a higher MV than ASV-F devices. The au-thors directly compared ASV-F and ASV-V devices, which is a major difference with the present study as we considered it statistically impossible to compare the MV measures provided by the manufacturer software (be-cause one is expressed as a mean (Philips Respironics®
Table 3 Adaptive servo-ventilation settings for the OTRLASV population based on k-means clusters (Continued)
Total
n = 177 (100%) Cluster 1n = 53 (29.9%) Cluster 2n = 58 (32.7%) Cluster 3n = 33 (18.6%) Cluster 4n = 20 (11.3%) Cluster 5n = 13 (7.3%) P 47 (26.55) 14 (26.42)f 8 (13.79)j 19 (57.58)f, j, h 5 (25.00) 1 (7.69)h < 0.001
Quantitative variables were summarized using medians, [IQ25–75] and (min– max), while categories were described by numbers and (%). The total percentage for
interfaces is > 100% because multiple interfaces were used by 2 patients
Significant (p < 0.05) post-hoc pairwise comparisons after Holm correction (within lines) were presented using labelsa, b, c, d, e, f, g, h, I, j
. Labela
indicates a significant difference between Cluster 1 and Cluster 4, labelb
indicates a significant difference between Cluster 2 and Cluster 4, labelc
indicates a significant difference between Cluster 3 and Cluster 4, labeld
indicates a significant difference between Cluster 4 and Cluster 5, labele
indicates a significant difference between Cluster 1 and Cluster 2, labelfindicates a significant difference between Cluster 1 and Cluster 3, labelgindicates a significant difference between Cluster 2 and Cluster 5, labelh
indicates a significant difference between Cluster 3 and Cluster 5, labeli
indicates a significant difference between Cluster 1 and Cluster 5, labelj
indicates a significant difference between Cluster 2 and Cluster 3
CSA Central sleep apnea, EPAP Expiratory positive airway pressure, IPS Inspiratory pressure support, max maximum, min minimum, OSA Obstructive sleep apnea, Pmax maximum pressure, RR Respiratory rate, TECSA Treatment emergent central sleep apnea, Ti min inspiratory support minimum pressurization time
k
For ASV-setting variables shared by both manufacturers, the data were pooled (EPAP (fixed or minimum/maximum); IPS (minimum and maximum), Pmax, RR or auto RR).l
For slope level and minimum inspiratory time, the data concern only Philips Respironics devices
Table 4 Minute-ventilation mean/medians for adaptive servo-ventilation treatment according to k-means clusters and device type
Total
n = 177 (100%) Cluster 1n = 53 (29.9%) Cluster 2n = 58 (32.7%) Cluster 3n = 33 (18.6%) Cluster 4n = 20 (11.3%) Cluster 5n = 13 (7.3%) P Philips Respironics® n = 68 n = 12 n = 30 n = 13 n = 7 n = 6 0.002 Mean MV (l/min)* 7.95 7.85i 8.30b 7.90 6.20b, d 10.45d, i
ASV flow-monitored devices. [7.20–9.30] [6.65–8.25] [7.30–9.30] [7.30–8.90] [5.30–7.80] [9.90–11.20] (4.90–14.80) (5.10–10.80) (6.40–11.70) (5.80–14.80) (4.90–7.80) (8.30–11.30)
ResMed® n = 107 n = 39 n = 28 n = 20 n = 13 n = 7 < 0.001 Median MV (l/min)* 6.90 7.30a 6.85b 7.00c 5.50a, b, c 6.60
ASV volume-monitored devices. [6.00–7.80] [6.60–8.30] [6.35–7.65] [6.00–7.45] [5.00–5.90] [5.10–7.80] (2.50–11.40) (5.40–10.30) (2.50–11.40) (4.60–10.60) (3.60–6.90) (3.80–9.80) Variables were summarized using medians, [IQ25–75] and (min– max)
*Note that for Philips Respironics® devices, the minute-ventilation is expressed as“mean” in the manufacturer software whereas for ResMed® devices, the minute-ventilation is expressed as“median” (thus preventing direct comparisons between these device types)
ASV Adaptive servo-ventilation, MV minute-ventilation
Significant (p < 0.05) post-hoc pairwise comparisons after Holm correction (within lines) were presented using labelsa, b, c, d, I
. Labela
indicates a significant difference between Cluster 1 and Cluster 4, labelb
indicates a significant difference between Cluster 2 and Cluster 4, labelc
indicates a significant difference between Cluster 3 and Cluster 4, labeld
indicates a significant difference between Cluster 4 and Cluster 5, labeli
indicates a significant difference between Cluster 1 and Cluster 5
devices, ASV-F) and the other as a median (ResMed® de-vice, ASV-V)). A further statistical limitation is that these results are expressed as “measured MV or mea-sured tidal volume”, whereas theoretical percentages would be more appropriate. Indeed, at the individual pa-tient level, hyperventilation status is better determined by a theoretical percentage of what is normal for a pa-tient, and not by brute measures. This is why our study additionally presents theoretical tidal volumes based on ideal weight and an expected 8 ml/kg theoretical tidal volume. To date, it is difficult to go further in the inter-pretation of our results because there is no robust evi-dence base defining the patient normal MV. It is however quite surprising to observe that a servo-controlled volume monitoring device can be associated with hyperventilation whereas its algorithm targets only 90 to 95% of the recent average ventilation calculated [3]. For some patients, one must consider the possibility that a raise in MV could be indicative of a CHF
exacerbation, independent of the device. In this regard, paying attention not only to MV but also to the respira-tory rate and the percentage of respirarespira-tory cycles trig-gered by the patient may have an interest similar to that described for patients with exacerbating severe chronic obstructive pulmonary disease [43].
Although we did not perform direct comparisons be-tween ASV-F and a ASV-V devices, our K-means clus-tering analysis demonstrated that MV differences between ASV-F and ASV-V are not homogenously distributed across clusters, indicating a cluster and ASV-algorithm interaction. The latter observation is import-ant when considering the ASV debate over“class-effects” versus “device-effects” as an explanation for the cardio-vascular mortality seen in the SERVE-HF study [8–10]. Our results are in favour of the simultaneous presence of both types of effect. The occurrence of a higher-than-expected tidal volume on an individual basis, regardless of cluster or the type of ASV algorithm used, emphasizes
Fig. 2 Individual tidal volume (% theoretical) versus respiratory rate measures for each cluster. For each patient, the theoretical tidal volume is
calculated using an 8 ml/kg formula and the ideal weight is calculated according to the Lorentz equation. Measured tidal volume is obtained by dividing the measured minute-ventilation by respiratory rate. Note that for Philips Respironics® devices, the minute-ventilation is expressed as “mean” in the manufacturer software whereas for ResMed® devices, the minute-ventilation is expressed as “median” (thus preventing direct comparisons between these device types). Data are collected using the manufacturer’s software for a continuous 6-month period
the crucial need for individual MV monitoring. In this regard, MV telemonitoring as part of a safety-first strat-egy deserves consideration, as least for patients with reduced-LVEF (like cluster-5 in the present study, which has higher MV when patients are treated with ASV-F).
Limits of the study
Because real-life data describing ASV-settings and their associated flow- versus volume- controlled monitoring are sparse, our study was exploratory and descriptive in nature, without predefined hypotheses to be tested. Assessing the effects or interactions between ASV-settings, servo-controlled-flow or -volume monitoring types, and patient-phenotypes is complicated consider-ing that the patient characteristics and the physician pre-scriptions are scalable. However, our study design (clinically stable and long-term treated patients, annual planned consultation corresponding to the inclusion date) limits in as much as possible such confounders.
Our patients were included from March 13, 2015 to December 31, 2016. The SERVE-HF safety announce-ment was made on May 13, 2015. As a consequence, the ASV-data collected result from a mix of before and after SERVE-HF physician behaviors (with a majority of post-SERVE-HF inclusions). In addition, we were unable to generate a complete patient-group with a SERVE-HF like pattern because of the post SERVE-HF restrictions by regulators that occurred only 3 months after our study started. The absence of a SERVE-HF-group limits a direct comparison between the latter and our three groups based on initial diagnosed sleep-disordered breathing. For similar reasons, it was impossible for us to constitute a group of patients with a SERVE-HF pat-tern and undergoing CPAP treatment. Indeed, the indi-cation of a CPAP treatment for these patients became consensual in France in 2017 subsequent to the European Respiratory Task Force Report [30].
In relation with our cross-sectional study design/inclu-sion criteria, another study limitation is that we are able to report only the hyperventilation risk in real life ASV-treated patients, and not longitudinal cardiovascular mortality. In addition, the reader should keep in mind that this cross-sectional study is a non-randomized real life study with potential unknown sources of bias. To limit this risk, a multicentre design without predefined ASV-rules or ASV-brand requirements was used. An im-portant further limitation results from the impossibility of making direct comparisons between F and ASV-V. Because of our long-term design, it was impossible for us to deploy an independent pneumotachograph MV and therapeutic pressure measures, and we therefore used manufacturer software as in previous clinical publi-cations [4,28]. However, based on the ASV bench-study published by Zhu et al. [2], which used an independent
pneumotachograph and demonstrated device-differences in MV and therapeutic pressures, one can assume that such machine related heterogeneity exists in real life.
Conclusion
Real-life, long-term ASV-settings are not associated with the initial SDB-diagnosis-based group but are rather as-sociated with combinations of baseline and follow-up variables wherein reduced-LVEF remains clinically meaningful. EPAP-pressures and auto-EPAP usage are lower in the reduced-LVEF cluster even when a predom-inant obstructive pattern is present. Crucially, the latter choices did not result in increased residual IAHflow. MV
differences exist between clusters. Simultaneously, MV differences between devices (ASV-F versus ASV-V) vary with clusters. Importantly, a higher-than-expected tidal volume can occur independently of ASV monitoring type or cluster, suggesting a need for individual MV tele-monitoring in ASV patients.
Supplementary information
Supplementary information accompanies this paper athttps://doi.org/10. 1186/s12931-020-01509-7.
Additional file 1. Study flow chart. ASV-settings/software measured data
were analysed i) between initial sleep-disordered-breathing diagnostic based groups (CSA, OSA, and TECSA) and ii) between unsupervised based groups (created via a clustering algorithm). AHC: Ascending Hierarchical Classification; ASV: Adaptive Servo-Ventilation; CSA: Central Sleep Apnea; OSA: Obstructive Sleep Apnea; OTRLASV: Observational Transversal Real-life Study of ASV; SDB: Sleep Disordered Breathing; TECSA: Treatment Emergent Central Sleep Apnea.
Additional file 2. Initial sleep-disordered-breathing diagnostic based
groups For the SDB group analysis, three patient groups were generated (the central sleep apnea (CSA), obstructive sleep apnea (OSA) and treatment-emergent central sleep apnea (TECSA) groups). In line with our recent publication and those from Malfertheiner et al. [1,2], we chose to differentiate central versus obstructive groups using the predominant apnea pattern during the initial polygraphy (PG) or polysomnography (PSG) diagnosis. Central apnea was scored if respiratory effort was absent. This latter criteria was chosen because it represented a consensus be-tween the different centers and recommendations for scoring. Patients with an initial diagnosis of OSA treated with Continuous Positive Airway Pressure (CPAP) but secondarily treated with ASV were classified in the (TECSA) group. The detailed algorithm is included in our initial publica-tion [1].
Additional file 3. Software-measured data for the 6 months preceding
the study inclusion. Philips Respironics® and ResMed® (grey line) device-reported outcomes based on initial sleep-disordered-breathing diagnostic groups.
Additional file 4. General and sleep characteristics of the OTRLASV
population and for k-means clusters.
Additional file 5. Software measured data for the last 6 months
preceding the study inclusion. Philips Respironics® and ResMed® (grey line) device-reported outcomes based on the cluster analysis.
Abbreviations
AASM:American Academy of Sleep Medicine; AHI: Apnea Hypopnea Index; AHIflow: Residual Apnea–Hypopnea-Index measured by the ASV device; ASV: Adaptive Servo-Ventilation; ASV-F: Flow monitored ASV; ASV-V: Volume monitored ASV; BMI: Body Mass Index; CAI: Central Apnea Index;
CSA: Central Sleep Apnea; ESS: Epworth Sleepiness Scale; HCA: hierarchical clustering approach; HI: Hypopnea Index; IQ25–75: Medians and interquartile ranges; LVEF: Left Ventricular Ejection Fraction; MAI: Mixed Apnea Index; OAI: Obstructive Apnea Index; OSA: Obstructive Sleep Apnea;
OTRLASV: Observational Transversal Real-life Study of ASV; PG: Respiratory polygraphy; PSG: Polysomnography; TECSA: Treatment Emergent Central Sleep Apnea; SA: Sleep Apnea; SDB: Sleep-Disordered Breathing; SD: Standard deviations; WP: Whole population
Acknowledgements
The OTRLASV investigators gratefully recognize the vital input and support of the home care providers: Agevie (José Suarez), APARD Adene Group (Julien Bauchu, Frédéric Bousquet), ARARD Group (Florian Varielle), Home Air Agiradom Group (Frédéric Gil), LVL medical (Thierry Lefort)). Authors’ contributions
DJ had access to the data and takes responsibility for the integrity and accuracy of the analysis. Docteur Carole Philippe and Claudio Rabec have equally contributed to this work. All authors contributed to and approved the final submitted manuscript. DJ: study design, data collection, analysis, and manuscript preparation; CP: data collection, manuscript preparation; CR: data collection, manuscript preparation; JPM: data collection, analysis, manuscript preparation; MG: data collection, manuscript preparation; SF: data collection, manuscript preparation; AP: data collection, manuscript preparation; CMS: results interpretation and manuscript preparation, EN: data analysis; NM: study design, data analysis, manuscript preparation; AB: study design, data analysis and manuscript preparation.
Funding
The authors have no support nor funding to report in relation with the present study.
Availability of data and materials
The datasets used and/or analyzed during the current study are available from the corresponding author on reasonable request.
Ethics approval and consent to participate
The OTRLASV study is registered onClinicalTrials.gov(Identifier:
NCT02429986). The protocol complied with the Declaration of Helsinki and was reviewed and approved by an independent ethics committee (Comité de Protection des Personnes “Sud Méditérannée III”; reference number 2014.11.04).
Consent for publication Not applicable. Competing interests
- Dr. Dany Jaffuel has performed lecturing at sponsored meetings for the following companies in the last 5 years: Apard, Bastide, Loewenstein Medical, Philips, SEFAM. He has sat on advisory boards for the following companies in the last 5 years: Lowenstein Medical, SEFAM. He has received sponsorship support to attend academic meetings in the last 5 years from Lowenstein Medical, Resmed, Philips and SEFAM.
- Dr. Alain Palot has performed lecturing at sponsored meetings for the following companies in the last 5 years: ARARD, Resmed, Philips. He has sat on advisory boards for the following company in the last 5 years: Resmed. - Dr. Claudio Rabec has performed lecturing at sponsored meetings and/or participated in boards for the following companies in the last 5 years: Resmed, Philips, Lowenstein, Air Liquide Medical Systems.
- Pr. Arnaud Bourdin reports grants, personal fees, non-financial support and other from AstraZeneca, grants, personal fees, non-financial support and other from Boeringher Ingelheim, grants, personal fees, non-financial support and other from GlaxoSmithKline, personal fees, non-financial support and other from Novartis, personal fees and non-financial support from Teva, per-sonal fees, non-financial support and other from Regeneron, perper-sonal fees, non-financial support and other from Chiesi Farmaceuticals, grants, personal fees, non-financial support and other from Actelion, personal fees from Gil-ead, non-financial support and other from Roche, other from Nuvaira, from null, outside the submitted work.
- Dr. Carey Suehs reports one grant from AstraZeneca, outside the submitted work.
CP, EN, JPM, NM, MG, SR report no conflicts of interest in relation to the present work.
Author details
1Department of Respiratory Diseases, Univ Montpellier, CHU Montpellier, 371,
Avenue Doyen Giraud, 34295 Montpellier Cedex 5, France.2PhyMedExp, Univ
Montpellier, CNRS, INSERM, CHU Montpellier, Montpellier, France.3Pulmonary
Department and Respiratory Critical Care Unit, University Hospital Dijon, Dijon, France.4Centre des pathologies du sommeil, Hôpital Universitaire de
la Pitié Salpêtrière, AP-HP, Paris, France.5Clinique des Bronches, Allergies et
du Sommeil, Assistance Publique Hôpitaux de Marseille, France et INSERM U1067, CNRS UMR 7333 Aix Marseille Université, 13015, Marseille, France, Hôpital Saint-Joseph, 26, boulevard de Louvain, 13285 Marseille, France.
6Department of Medical Information, Univ Montpellier, CHU Montpellier,
Montpellier, France.7Clinical Research and Epidemiology Unit (URCE), Univ
Montpellier, CHU Montpellier, Montpellier, France.8IMAG, CNRS, Univ Montpellier, CHU Montpellier, Montpellier, France.
Received: 16 June 2020 Accepted: 13 September 2020
References
1. Bradley TD. SERVE-HF on-treatment analysis: does the on-treatment analysis SERVE its purpose? Eur Respir J. 2017;50:1701516.
2. Zhu K, Kharboutly H, Ma J, Bouzit M, Escourrou P. Bench test evaluation of adaptive servoventilation devices for sleep apnea treatment. J Clin Sleep Med. 2013;9:861–71.
3. Javaheri S, Brown LK, Randerath WJ. Positive airway pressure therapy with adaptive servoventilation: part 1: operational algorithms. Chest. 2014;146: 514–23.
4. Knitter J, Bailey OF, Poongkunran C, Martinez AF, Martinez L, Kobayashi U, et al. Comparison of physiological performance of four adaptive servo ventilation devices in patients with complex sleep apnea. Am J Respir Crit Care Med. 2019;199:925–8.
5. Teschler H, Döhring J, Wang YM, Berthon-Jones M. Adaptive pressure support servo-ventilation: a novel treatment for Cheyne-stokes respiration in heart failure. Am J Respir Crit Care Med. 2001;164:614–9.
6. Oldenburg O. Cheyne-stokes respiration in chronic heart failure. Treatment with adaptive servoventilation therapy. Circ J. 2012;76:2305–17.
7. Cowie MR, Woehrle H, Wegscheider K, Angermann C, d’Ortho M-P, Erdmann E, et al. Adaptive servo-ventilation for central sleep apnea in systolic heart failure. N Engl J Med. 2015;373:1095–105.
8. Bradley TD, Floras JS. Adaptive servo-ventilation and the treatment of central sleep apnea in heart failure. Let’s not throw the baby out with the bathwater. Am J Respir Crit Care Med. 2016;193:357–9.
9. Javaheri S, Brown LK, Randerath W, Khayat R. SERVE-HF: more questions than answers. Chest. 2016;149:900–4.
10. Yamauchi M, Combs D, Parthasarathy S. Adaptive servo-ventilation for central sleep apnea in heart failure. N Engl J Med. 2016;374:689. 11. Naughton MT. PRO: persistent central sleep apnea/hunter-Cheyne-stokes
breathing, despite best guideline-based therapy of heart failure with reduced ejection fraction, is a compensatory mechanism and should not be suppressed. J Clin Sleep Med. 2018;14:909–14.
12. Javaheri S, Brown LK, Khayat R. CON: persistent central sleep apnea/hunter-Cheyne-stokes breathing, despite best guideline-based therapy of heart failure with reduced ejection fraction, is not a compensatory mechanism and should be suppressed. J Clin Sleep Med. 2018;14:915–21.
13. Javaheri S, Shukla R, Wexler L. Association of smoking, sleep apnea, and plasma alkalosis with nocturnal ventricular arrhythmias in men with systolic heart failure. Chest. 2012;141:1449–56.
14. Javaheri S, Corbett WS. Association of low PaCO2 with central sleep apnea and ventricular arrhythmias in ambulatory patients with stable heart failure. Ann Intern Med. 1998;128:204–7.
15. Bradley TD, Holloway RM, McLaughlin PR, Ross BL, Walters J, Liu PP. Cardiac output response to continuous positive airway pressure in congestive heart failure. Am Rev Respir Dis. 1992;145:377–82.
16. Oldenburg O, Bartsch S, Bitter T, Schmalgemeier H, Fischbach T, Westerheide N, et al. Hypotensive effects of positive airway pressure ventilation in heart failure patients with sleep-disordered breathing. Sleep Breath. 2012;16:753–7.
17. Combes N, Jaffuel D, Cayla G, Granier M, Borel JC, Corne P, et al. Pressure-dependent hemodynamic effect of continuous positive airway pressure in severe chronic heart failure: a case series. Int J Cardiol. 2014;171:e104–5. 18. Asakawa N, Sakakibara M, Noguchi K, Kamiya K, Yamada S, Yoshitani T, et al.
Adaptive servo-ventilation has more favorable acute effects on hemodynamics than continuous positive airway pressure in patients with heart failure. Int Heart J. 2015;56:527–32.
19. Spießhöfer J, Fox H, Lehmann R, Efken C, Heinrich J, Bitter T, et al. Heterogenous haemodynamic effects of adaptive servoventilation therapy in sleeping patients with heart failure and Cheyne-stokes respiration compared to healthy volunteers. Heart Vessel. 2016;31:1117–30. 20. Imamura T, Nitta D, Kinugawa K. Optimization of pressure settings during
adaptive servo-ventilation support using real-time heart rate variability assessment: initial case report. BMC Cardiovasc Disord. 2017;17:11. 21. Oldenburg O, Spießhöfer J, Fox H, Prib N, Horstkotte D. Performance of
conventional and enhanced adaptive servoventilation (ASV) in heart failure patients with central sleep apnea who have adapted to conventional ASV. Sleep Breath. 2015;19:795–800.
22. Gorbachevski M, Spiesshoefer J, Arzt M, Oldenburg O, Becker S, Tuleta I, et al. Adaptive servo-ventilation therapy does not favourably alter sympatho-vagal balance in sleeping patients with systolic heart failure and central apnoeas: preliminary data. Int J Cardiol. 2020;315:59–66.
23. Brill A-K, Pichler Hefti J, Geiser T, Ott SR. The SERVE-HF safety notice in clinical practice - experiences of a tertiary sleep center. Sleep Med. 2017;37:201–7.
24. Jaffuel D, Philippe C, Rabec C, Mallet J-P, Georges M, Redolfi S, et al. What is the remaining status of adaptive servo-ventilation? The results of a real-life multicenter study (OTRLASV-study): adaptive servo-ventilation in real-life conditions. Respir Res. 2019;20:235.
25. Malfertheiner MV, Lerzer C, Kolb L, Heider K, Zeman F, Gfüllner F, et al. Whom are we treating with adaptive servo-ventilation? A clinical post hoc analysis. Clin Res Cardiol. 2017;106:702–10.
26. Randerath W, Schumann K, Treml M, Herkenrath S, Castrogiovanni A, Javaheri S, et al. Adaptive servoventilation in clinical practice: beyond SERVE-HF? ERJ Open Res. 2017;3:00078.
27. Cantero C, Adler D, Pasquina P, Uldry C, Egger B, Prella M, et al. Adaptive servo-ventilation: a comprehensive descriptive study in the Geneva Lake area. Front Med. 2020;7:105.
28. Westhoff M, Litterst P. Ventilation parameters under adaptive servo ventilation: a comparison on behalf of CSA-pattern, BNP/NT-pro-BNP, and ejection fraction. Respir Int Rev Thorac Dis. 2018;96:240–8.
29. Aurora RN, Chowdhuri S, Ramar K, Bista SR, Casey KR, Lamm CI, et al. The treatment of central sleep apnea syndromes in adults: practice parameters with an evidence-based literature review and meta-analyses. Sleep. 2012;35:17–40. 30. Randerath W, Verbraecken J, Andreas S, Arzt M, Bloch KE, Brack T, et al.
Definition, discrimination, diagnosis and treatment of central breathing disturbances during sleep. Eur Respir J. 2017;49:1.
31. Bénézet S, Guimbaud R, Chatelut E, Chevreau C, Bugat R, Canal P. How to predict carboplatin clearance from standard morphological and biological characteristics in obese patients. Ann Oncol. 1997;8:607–9.
32. Kuzniar TJ, Golbin JM, Morgenthaler TI. Moving beyond empiric continuous positive airway pressure (CPAP) trials for central sleep apnea: a multi-modality titration study. Sleep Breath. 2007;11:259–66.
33. Carnevale C, Georges M, Rabec C, Tamisier R, Levy P, Pépin J-L. Effectiveness of adaptive servo ventilation in the treatment of hypocapnic central sleep apnea of various etiologies. Sleep Med. 2011;12:952–8.
34. Philippe C, Stoïca-Herman M, Drouot X, Raffestin B, Escourrou P, Hittinger L, et al. Compliance with and effectiveness of adaptive servoventilation versus continuous positive airway pressure in the treatment of Cheyne-stokes respiration in heart failure over a six month period. Heart. 2006;92:337–42. 35. Javaheri S, Brown LK, Randerath WJ. Clinical applications of adaptive
servoventilation devices: part 2. Chest. 2014;146:858–68.
36. Pépin J-LD, Woehrle H, Liu D, Shao S, Armitstead JP, Cistulli PA, et al. Adherence to positive airway therapy after switching from CPAP to ASV: a big data analysis. J Clin Sleep Med. 2018;14:57–63.
37. Javaheri S, Goetting MG, Khayat R, Wylie PE, Goodwin JL, Parthasarathy S. The performance of two automatic servo-ventilation devices in the treatment of central sleep apnea. Sleep. 2011;34:1693–8.
38. Kushida CA, Chediak A, Berry RB, Brown LK, Gozal D, Iber C, et al. Clinical guidelines for the manual titration of positive airway pressure in patients with obstructive sleep apnea. J Clin Sleep Med. 2008;4:157–71.
39. Morgenthaler TI, Aurora RN, Brown T, Zak R, Alessi C, Boehlecke B, et al. Practice parameters for the use of autotitrating continuous positive airway pressure devices for titrating pressures and treating adult patients with obstructive sleep apnea syndrome: an update for 2007. An American Academy of sleep medicine report. Sleep. 2008;31:141–7.
40. Société de Pneumologie de Langue Française, Société Française d’Anesthésie Réanimation, Société Française de Cardiologie, Société Française de Médecine du Travail, Société Française d’ORL, Société de Physiologie, et al. Recommendations for clinical practice. Obstructive sleep apnea hypopnea syndrome in adults. Rev Mal Respir. 2010;27:806–33. 41. Lyons OD, Floras JS, Logan AG, Beanlands R, Cantolla JD, Fitzpatrick M, et al.
Design of the effect of adaptive servo-ventilation on survival and cardiovascular hospital admissions in patients with heart failure and sleep apnoea: the ADVENT-HF trial. Eur J Heart Fail. 2017;19:579–87.
42. Yumino D, Kasai T, Kimmerly D, Amirthalingam V, Floras JS, Bradley TD. Differing effects of obstructive and central sleep apneas on stroke volume in patients with heart failure. Am J Respir Crit Care Med. 2013;187:433–8. 43. Borel J-C, Pelletier J, Taleux N, Briault A, Arnol N, Pison C, et al. Parameters
recorded by software of non-invasive ventilators predict COPD exacerbation: a proof-of-concept study. Thorax. 2015;70:284–5.
Publisher’s Note
Springer Nature remains neutral with regard to jurisdictional claims in published maps and institutional affiliations.