DAM FILTERS: PHYSICAL BEHAVIOR, PROBABILITY OF MALFUNCTIONING,
AND DESIGN CRITERIA by
YUSUKE HONJO
Ko-Gaku-Shi, Nagoya Institute of Technology (1973)
Ko-Gaku-Shu-Shi, Kyoto University Graduate School (1975)
S.M., Massachusetts Institute of Technology (1983)
SUBMITTED IN PARTIAL FULFILLMENT OF THE REQUIREMENTS FOR THE
DEGREE OF
DOCTOR OF PHILOSOPHY at the
MASSACHUSETTS INSTITUTE OF TECHNOLOGY January, 1985
c Yusuke Honjo
The author hereby grants to M.I.T. permission to reproduce and to distribute copies of this thesis document in whole or in part.
Signature of Author
Department of Civil Encineering/, J nuary 31, 1985 Certified by
Thesis Supervisor Accepted by
Chairman, Departmental Committee o Graduate Students OF TECHNOLOGY
JUN 171985
~ n I, -- ,
PROBABILITY OF MALFUNCTIONING, AND DESIGN CRITERIA
by
YUSUKE HONJO
Submitted to the Department of Civil Engineering on Jan-uary 29, 1985 in partial fulfillment of the requirements for the Degree of Doctor of Philosophy.
ABSTRACT
Dam filters are studied first through a physical model of soil particle transport, and then through
stat-istical analysis of laboratory data. The former model is useful in understanding physical factors involved in the
soil particle transport phenomenon. However, the very complex nature of the phenomenon prevents one from re-liably evaluating the parameters of physical models. The latter method identifies soil parameters that are stat-istically significant in explaining the behavior of fil-ters. Its main drawback is that it is sometimes
dif-ficult to give a physical interpretation to the obtained parameters. In this study, the two methods are used
interactively by using the understanding from the physical model to evaluate and to interpret the results of stat-istical analysis.
It is found that DF15/DB85, which is the parameter used in the conventional Terzaghi's criteria, is the
single most significant parameter in predicting filter performance. A secondary parameter, DB95/DB75, is found to be also significant. This parameter is linked to the capability of the base soil's intrinsic stability property
(i.e., the self-healing capability.
The implication of the present findings is that the conventional design criteria (DF15/DB85 < 5) is conserva-tive for the case of base soils with low DB95/DB75, but unconservative for soils with high DB95/DB75 (for base soils with widely graded coarser portions).
The proposed filter design criterion is calibrated so that the probability of filter malfunctioning is the same as that provided by the conventional criteria in the case of uniformly graded base soils. The proposed
criterion has some spread in the higher DB95/DB75 range due to the scarceness of the data (see Fia. 3.29); its average is given as
DFl5 < 5.6 - 0.6 DB95 (for DB95 < 5)
DB85 DB75 DB75
-A method is also proposed to evaluate the probability of filter malfunctionina for an entire dam. The method
is based on a generalization of the weakest link model to a t;.o-dimensional continuum. A case study using
construc-tion records of Carter's Dame, Georgea, is used to il-lustrate this method.
Thesis Supervisor: Dr. Daniele Veneziano
Item TITLE PAGE--- ABSTRACT---TABLE OF CONTENTS--- ACKNOWLEDGEMENT---LIST OF TABLES ---LIST OF FIGURES---CHAPTER I. INTRODUCTION---1.1 Current
Practice---1.2 Current Issues in Filter---1.2.1 Studies on the Mechanism of
Filtering and Related Problems 1.2.2 Cracking, Leakage, Erosion and
Filters----1.3 Purpose of the Present Study ---CHAPTER II. PHYSICAL ASPECTS OF SOIL
PARTICLE
TRANSPORT---2.1
Introduction---2.2 Modeling of Soil Particle
Transport---2.2.1 Conservation of
Mass---2.2.2 Momentum Equation ---2.2.3 Absorption and Release ---2.2.4 Distance Lag Effect ---2.2.5
Dispersion---2.2.6 Proposed Model
---2.2.7 Method for Solving Eqs. (2.2.14) and (2.2.15) --- ---Page No. 1 2 4 7 9 11 19 19 21 21 36 43 59 59 61 61 63 64 68 70 72
Table of Contents (cont'd)
Page No. 2.3 Numerical Examples of Their
Physical Interpretations ---2.3.1 Self-Healing Process of
Base
Soil---2.3.2 Internal Stability of Base
Soil---2.3.3 Clogging of
Filters---2.4 Summary and Conclusions ---III. STATISTICAL ANALYSIS OF
LABORATORY
DATA---3.1 Data
Base---3.1.1 Definitions and
Notation---3.1.2 Soil Parameters in the
Data Base
---3.1.3 Preliminary Considerations on
the Data Base ---3.2 Logistic Regression Model ---3.2.1 Regression with a Binary
Resronse
Variable---3.2.2 Regression Statistics ---3.2.3 Indicator Variables and
Stepwise
Regression---3.3 Results of Statistical Analysis---3.3.1 Preliminary Analysis to
Eval-uate Conventional Filter
Criteria
---3.3.2 Investigation of Each Data Set
3.3.3 Improvement of Filter Criteria---77 78 83 89 92 131 131 131 134 135 137 137 139 144 146 147 151 153 Item CHAPTER
Item
3.4 Summary and Conclusions ---CHAPTER IV. PROBABILITY OF FILTER SYSTEM
MALFUNCTIONING: GENERALIZED
WEAKEST LINK MODEL
---4.1
Introduction---4.2 Review of Lattice
Models---4.2.1 Simultaneous and Conditional Autorearessive Models in
I-D and 2-D: Continuous Case ---4.2.2 General Specification of
Conditional Lattice Models---4.2.3 The Ising Model ---4.2.4 Statistical Analysis of Binary
Variables on 2-D Lattice---4.3 Derivation of the Model---4.3.1 Homogeneous Field:
E[x(s)] = const.---4.3.2 Non-Homogeneous Field ---4.4 Numerical Simulation and
Discussion ---4.5 Summary and Conclusions ---CHAPTER V. SUMMARY AND CONCLUSIONS---APPENDIX A. DESCRIPTION OF FILTER
EXPERIMENTS---APPENDIX B. LIMITS OF EQ. (4.3.9) AND
EQ. (4.3.23)---APPENDIX C. CASE STUDY: PROBABILITY OF
MAL-FUNCTIONS OF THE FILTER OF
CARTERS DAM--- REFERENCES---Page No. 174 227 228 229 230 237 243 245 250 251 257 261 264 284 295 326 333 373
ACKNOWLEDGEMENT
The author would very much like to acknowledge his thesis Supervisor, Professor Daniele Veneziano, whose contributions to this research are too many to point out. Without his critical advice, this study would not have
been completed.
He also gratefully appreciates the interested mem-bers of his thesis committee, Professor Robert V. Whit-man, Erik H. Vanmarcke and Gregory B. Baecher, all of whom have contributed to this research.
His stay at M.I.T. for three and a half years has been supported by Takenaka Doboku Co., Ltd., Tokyo. This support is gratefully acknowledged.
The author is indebted to many people in the course of this achievement. Among them he would like to express his heartfelt thanks to Mr. M. Endo and Mr. T. Kawasaki who strongly helped him in obtaining the scholarship,and
to Professor M. Matsuo for his arrangement for the author's enrollment at M.I.T.
In the statistical analysis done in this thesis, ob-taining the literature was one of the critical issues. Thev author acknowledges the help provided by Dr. Y. Esashi
and Mr. A. Whittle in this respect.
A special appreciation goes to Ms. Cathy Lydon for her quick and accurate typing of this manuscript under a
by drafting many of the figures in Chapter II with his excellent skill. This help is acknowleged.
The friendships he has obtainedduring his stay at M.I.T. are one of the most fruitful outcomes that he will enjoy tr the remainder of his life. K. Ayan, L. Chouinard, M. Heidari, S. Liao, S.Paikowsky and M. Suzuki are some of the people has has shared more things than his office with.
The author acknowledges the morale support of his parents towards this goal.
Finally, he would like to give his heartfelt ack-nowledgement to Yurie, his wife, and Kota and Michiko, his children. The pain and frustration (and also joys) we have experienced these three and one half years were not easy ones. I would not have been able to achieve this goal without their help. I know the endurance, encourage-ment and love of Yurie was essential and I would like to
9
LIST OF TABLES
No. Page
2.1 Equilibrium Absorption Models with
Single Species --- 97 2.2 Dynamic Absorption/Release Model with
Single Species --- 98 2.3 Summary of Compaction Conditions --- 99 2.4 Summary of the Results of Southworth's
Experiment --- 100 2.5 Characteristics of Soil Used in the
Num-erical Experiment --- 101 3.1 Basic Characteristics of the Data Base ---- 181 3.2 Models Used in Binary Response Regression-- 182 3.3 Preliminary Analysis --- 183 3.4 Regression on DF50/DB50 (Analysis
I-3 & I-4) --- 184 3.5(a) Analysis on Laboratory Difference 185
(Analysis II-1)---3.5(b) Analysis on Laboratory Difference
(Analysis II-2) --- 186 3.6(a) Analysis of Significant Grain Sizes
(Analysis III-1) --- 187 3.6(b) Analysis of Significant Grain Sizes
(Analysis III-2) --- 188 3.6(c) Analysis of Significant Grain Sizes
(Analysis III-3) --- 189 3.6(d) Analysis of Significant Grain Sizes
(Analysis III-4) --- 190 3.7 Analysis of Significant Grain Size
Ratios (Analysis IV-1) --- 191 3.8 Analysis of Significant Grain Size
No. Page 3.9 Final Analysis: DF15/DB85-DB95/DB75
(Analysis V) --- 194
3.10 Final Analysis: log (DFl5/DB85 -DB95/DB75 (Analysis VI) --- 195
4.1 Correlation Coefficient vs. Size of Patches --- 266
A.1 Leading Parameters of Cases in the Data Base --- 318
C.1 Leading Dimensions of Carters Dam --- 348
C.2 List of Soil Test Data Available --- 349
C.3 Summary of the Clustering Results --- 350
C.4 Calculated Results of the Filter Malfunctioning for the Whole Structure --- 351
11
LIST OF FIGURES
No. Page
1.1 Method to Judge Internal Stability
of Soils --- 47 1.2 Sieve and Sand Combination - Series
3S Tests (after Soares, 1980) --- 48 1.3 Test Results - Series 3S (after Soares,
1980) --- -- 49 1.4 Sieves and Gap Graded Sands
Combina-tions - Series 4S test (after Soares
1980) --- 50 1.5 Test Results - Series 4S (after Soares,
1980) --- 51 1.6 Sieve and Sands Combination (after
Mendez 1982) --- 52 1.7(a) Test Results for Sieve and Sands
Com-bination (after Mendez 1982) --- 53 1.7(b) Test Results for Gap-Graded Sands
(after Mendez 1982) --- 54 1.8 Results of Southworth's Tests of
Soil Against Screen --- 55 1.9 Formation of Soil Filter Behind the
Geotextile Filter (after Lawson) --- 56 1.10 Spatial Variation of Grain Sizes (after
Witt and Browns, 1984) --- 57 1.11 The Organization of the Thesis --- 58 2.1 Conservation of Mass of Free Particles
in Element (x,x+dx) --- 102 2.2 A Conceptual View of the Distance Lag
Effect: The Condition of Particles at x are Controlled by the Condition of the
Medium at x+Ax --- 103 2.3 Flow Chart for the Backward Calculation
of the Proposed Soil Particle Transport
No. Page 2.4 Grain Size Distribution of Soil Used
in Southworth (1980)'s Experiment --- 105 2.5 Assumptions Employed in the
Calcula-tion --- 106
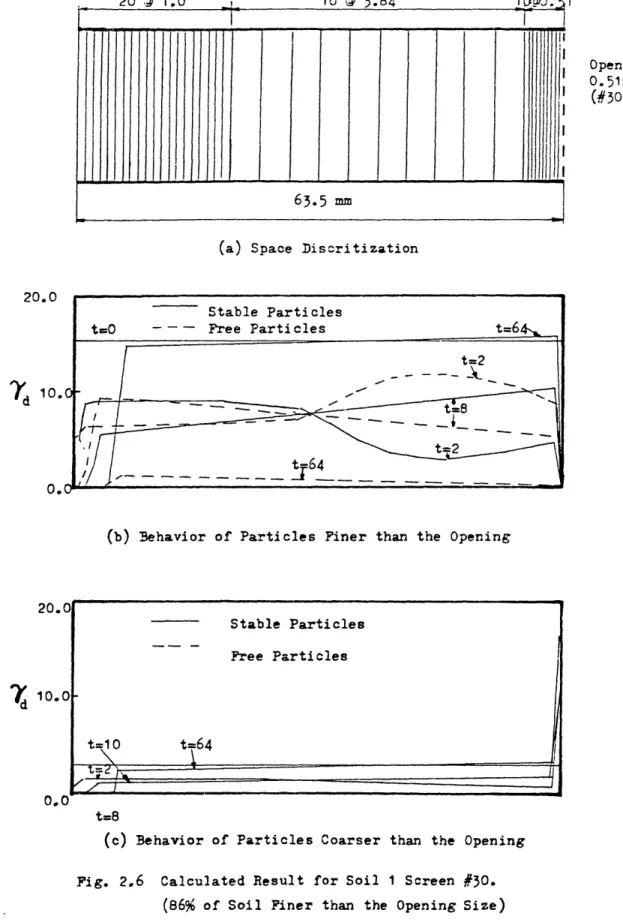
2.6 Calculated Result for Soil 1 Screen #30 (86% of Soil Finer than the
Opening Size) --- 107 2.7 Conceptual Diagram of Self-Healing
Filter Formed inCohesionless Soil
(after Southworth, 1980) --- 108 2.8 State Diagram of the Calculated Results
of Soil 1 --- 109 2.9 State Diagram of the Calculated Results
of Soil 3 --- 110 2.10 Mass Discharge from the Screen in
South-worth's Experiment: Experimental vs.
Calculated Results --- 111 2.11 Settlement of Specimens in Southworth's
Experiment: Experimental vs. Calculated
Results --- 112
2.12 Particle Transport Phenomena in Sand and Gravel Subsoil (after Wittman,
1978) --- 113
2.13 Conceptual View of Intrnally Stable
Soil --- 114 2.14 Conceptual View of Internally
Non-Stable Soil --- 115 2.15 The State Diagram for Demo-Soil 1:
Internally Stable Soil --- 116 2.16 The State Diagram for Demo-Soil 2:
Internally Non-Stable Soil --- 117 2.17 Results of Calculation (A):
List of Figures (cont'd)
No. Page
2.18(a) Results of Calculation (B):
Demo-Soi.l 1 --- -- 119 2.13(b) Results of Calculation (B):
Demo-Soil 2 --- 120 2.19 Results of Calculation (C):
Demo-Soil 2 --- 121 2.20(a) Results of Calculation for
Demo-Soil 1: Internally Stable Soil --- 122 2.20(b) Results of Calculation for
Demo-Soil 2: Internally Nonstable Demo-Soil --- 123 2.20(c) Results of Calculation for Demo-Soil
3: Partially Internally Stable Soil --- 124 2.21 Space Discretization Scheme and
In-itial Conditions for Filter Clogging
Calculation --- 125 2.22 Property of the Base Soil --- 126 2.23 Property of the Base Soil - Filter
Mixture Soil --- 127 2.24 Results of Calculation for Case A --- 128
2.25 Results of Calculation for Case B --- 129 2.26 The State Diagram of the Clogging
Process --- 130 3.1 DB60/DB10 vs. DF60/DF10 for all the
Data Except [61], [75] and [82]
(N=277) --- 196
3.2 DB60/DB10 vs. DB95/DB75 for all the Data
Except [61], [75] and [82] (N=277) --- 197 3.3 DB95/DB75 vs. DF60/DF10 for all the Data
No. Page 3.4 DF15 vs. DEB85 for all the Data
Ex-cept [61], [75] and [82] (N=277) --- 199
3.5 DF15 vs. DB85 for all the Data (N=400) --- 200
3.6 DF50 vs. DB50 for all the Data (N=400) --- 201
3.7 Filter Malfunctioning Probability Contours on the DF15/DB85 Plane --- 202
3.8(a) Result of Analysis II-1 --- 203
3.8(b) Result of Analysis II-2 --- 204
3.9(a) Result of Analysis III-1 --- 205
3.9(b) Result of Analysis III-2 --- 206
3.10 DFl5/DB85 vs. DB95/DB90 for all the Data Except [61], [75] and [82] (N=277) and Pf = 0.5 line 207 3.11 Physical Interpretation of DB95/ DB75 --- 208
3.12 DF15/DB85 vs. DB95/DB75 for all the Data Except [61], [75] and [82] and P = 0.5 Line --- 209 3.13 DF15/DB85 vs. DB95/DB75 for [40A] --- 210 3.14 DF15/DB85 vs. DB95/DB75 for [40B] --- 211 3.15 DF15/DB85 vs. DB95/DB75 for [41] ---212 3.16 DF15/DB85 vs. DB95/DB75 for [48] ---213 3.17 DF15/DB85 vs. DB95/DB75 for [53]--- 214 3.18 DF15/DB85 vs. DB95/DB75 for [49] --- 215 3.19 DF15/DB85 vs. DB95/DB75 for [54] --- 216
List of Figures (cont'd)
No. Page
3.20 DF15/DB85 vs. DB95/DB75 for [55] --- 217 3.21 DF15/DB85 vs. DB95/DB75 for [72] --- 218 3.22 DF15/DB85 vs. DB95/DB75 for [84] --- 219 3.23 Base Soil Grain Size Distributions
with Higher DB95/DB75 (#1) --- 220 3.24 Base Soil Grain Size Distributions
with Higher DB95/DB75 (#2) --- 221 3.25 DF15/DB85 vs. DB95/DB75 for all the
Data Except [40A], [61], [75] and [82] (N=214); Laboratory Biases [41] and [55] Adjusted, and Pf = 0.5 Line
Shown --- 222 3.26 The Fitness of the Final Regression
Analysis (Analysis V) --- 223 3.27 The Probability of Malfunctioning of
Filter for DB95/DB90 = 1.95 --- 224 3.28 Contours of the Probability of Filter
Malfunctioning on DF15/DB85 - DB95/DB75
Plane --- 225 3.29 The Region of the Improved Design
Criteria --- 226 4.1 Procedure to Calculate the Probability
of Malfunctioning of the Filter
System --- 266 4.2 Binary Process with Given Mean Value
Function --- 268 4.3 Coding Pattern for a Nearest
Neigh-bor Scheme --- 268 4.4 Initial and Boundary Condition for
One-Sided Approximation --- 269 4.5(a) System Failure Probability for a
No. Page 4.5(b) System Failure Probability for a
Homogeneous Square Area P = 10---271 4.5(c) System Failure Probability for a
Homogeneous Square Area P = 10 --- 272 4.6 Flow Chart for Numerical Simulation
of the Binary Process on a Lattice
by One-Sided Approximation --- 273 4.7(a) Results of Numerical Simulation
Pf = 0.05, B = B2 = 0.5 --- 274
4.7(b) Results of Numerical Simulation:
Pf =0.05, 1 = 2 = 0.5 --- 275
4.7(c) Results of Numerical Simulation:
Pf = 0.05, 81 = 2 0.5 --- 276 4.7(d) Results of Numerical Simulation:
Pf = 0.10, 81 = 0.95, 82 = 0.1 --- 277 4.7(e) Results of Numerical Simulation:
Pf = 0.10, 81 = 0.10, 82 = 0.95 --- 278
4.8 Pattern of Grid Points Used in
Test-ing Anisotropy of the Model --- 279 4.9(a) Results of Simulation to Test
Approximation Induced Anisotropy:
Pf =0.10, 61 = 2 = 0.10 --- 280
4.9(b) Results of Simulation to Test Approx-imation Induced Anisotropy:
Pf = 0.10, ý81 = 2 = 0.50 --- 281 4.9(c) Results of Simulation to Test
Approx-imation Induced Anisotropy:
Pf = 0.10, 81 = 62 = 0.90 --- 282 4.10 The Average Size of Patches of "1"'S:
Results of 100 x 100 Lattice
List of Figures (cont'd)
No. Page
C.1 Layout of Carters Dam --- 352 C.2 Section of Carters Dam --- 353 C.3 The Range of Grain Size Distributions
for the Core and Transition Zone --- 354 C.4 The Proposed Procedure to Calculate
the Probability of Malfunctioning of
Dam Filter System --- 355 C.5 The Variation of Log DB85 According
to the Sample Sequence --- 356 C.6 The Variation of Log DF15 According
to the Sample Sequence --- 357 C.7 Results of K-means Analysis for Log DB85 -- 358 C.8 Results of K-means Analysis for Log DF15 -- 360 C.9 (Variance Between Clusters)/(Total
Variance) vs. Number of Clusters --- 363 C.10(a) Results of K-means Clustering for
Log DB85 --- 364 C.10(b) Results of K-means Clustering for
Log DFl5 --- 365
C.11 Results of Clustering Based on Dry
Density Data --- 366 C.12(a) Estimated Auto-Correlation Function
of Dry Density Data, Group 5 (N=25 0) --- 367 C12(b) Estimated Auto-Correlation Function of
Dry Density Data, Group 8 (N=213) --- 368 C.12(c) Estimated Auto-Correlation Function of
Group 3 (N=169) --- 369 C.12(d) Estimated Auto-Correlation Function of
Group 7 (N=167) --- 370 C.12(e) Estimated Auto-Correlation Function of
Page No.
C.13 Zoning Based on the Combinations
CHAPTER I. INTRODUCTION
In the first part of this chapter, current design criteria for dam filters are reviewed. Issues in the fil-ter design and research needs are then identified in Sec-tion 1.2. Finally, the objectives of the present study are presented in Section 1.3.
1.1 Current Practice
The first rational approach to filter design was proposed by Terzaghi in the 1920's. Most of the experi-mental work that leads to now so called conventional filter criteria was done in the 1940's and 1950's by Bertram (1940), Hurley & Newton (1940), USCE (1941, 1948 and 1953), Karpoff (1955). The filter criteria used in practice today have been developed mainly by U.S.C.E. and U.S.B.R. on the bases of these experiments.
The following is a summary from U.S.C.E. Engineering Manuals EM1110-2-1901 (1952) , EM 1110-2-2300 (1982) and
Sherard, et al (1963):
A filter material must meet two basic requirements: (1) The filter material must be fine enough to
prevent particles of the base soil from washing into its voids.
(2) The filter must be more pervious than the base soil so that the head dissipated by
are relatively small.
These requirements are referred to as the "stability" and "permeability" criteria respectively.
Two most widely accepted filter criteria for stabi-lity and permeabistabi-lity are:
(1) Stability: DFl5 / DB85 < 5 (2) Permeability: DFl5 / DB15 > 5
In addition, the following rules are sometimes followed:
(3) DF50 / DB50 < 25
(4) The grain size curve of the filter material should roughly parallel that of the base material,
(5) The filter should not contain more than 5% of fines passing through the No. 200 sieve, and the fines should be cohesionless.
The conventional filter criteria, although sometimes considered to be too conservative, are accepted widely among practical engineers. Most of dam filters are de-signed based on this criteria, and their performances are considered to be satisfactory. However, in recent years, there has been a trend towards using wider variety of soils as base soils and filters and some problems have been found with the above criteria. Furthermore, people are more interested in understanding the basic mechanism
of filtering and the migration of soil particles within soil media. These problems will be discussed in more de-tail in the next section.
1.2 Current Issues in Filter Design
Present research in soil particle transport is given from two different viewpoints: In Section 1.2.1, the
studies are grouped according to the problem they focus on; for example, use of special types of soil used asthe core material. In Section 1.2.2,the problems are classified according to a scenario of a failure event of an earth dam on which a lot of current research is based. The in-formation concerning the laboratory experiments on filters are summarized in Appendix A.
1.2.1 Studies on the Mechanism of Filtering and Related Problems
An active area of research concerning the physical mechanism of filtering is to study it in a context of mroe
general problems of particle transport within soil media. The practical motivation for the work are: (i) the tend-ency of using wider variety of soils as base soils
and filters (e.g., broadly graded soils such as glicial tills, and geotextile filters); (ii) attempts to establish more economical design criteria, based on a better
need for a rational quality control method during the con-struction of filters and cores of dams.
In reviewing the literature on filter design cri-teria and soil particle transport the following problems are considered separately:
(1) Internal stability of widely graded and gap graded soils,
(2) Experiments on soil against screen to understand self-healing process,
(3) Void phase description based on microscopic and geometric considerations,
(4) Design criteria for filters to protect the seabed from wave action,
-(5) Design criteria for geotextile filters, (6) Influence of spatial variability of soil
parameters and Quality Control.
(1) Internal Stability of Widely Graded and Gap Graded Soils
Sherard (1979) pointed out that there have been a number of incidents in which sinkholes have appeared on crests and slopes of embankment dams that are comprised of coarse, broadly graded soils, frequently of glaicial origin. He attributed this fact to the internal unstab-ility of these soils, in the sense that the fine portion
23
is not compatible with coarser particles.
The migration of finer particles in the coarser por-tion of the soils is sometimes called "suffusion", and is important not only in embankment dam design but also in studying the properties of certain natural deposit. Study of this phenomenon is also important to understand the mechanism of soil particles transport problem in general.
In a chapter of a book by Kovacs (1981) gives a good review of this topic especially within the Eastern Europe literature. It is estimated that:
no suffusion if D60/D10 < 10
transition condition if 10 < D60/D10 < 20 suffusion probable if D60/D10 > 20
These results are said to be based on experiments and on theoretical considerations based on a capillary tube model. The same author mentioned that the shape of distribution curves is a dominant factor; he introduces two methods to check suffusion based on the shape of the grain size dis-tribution curves:
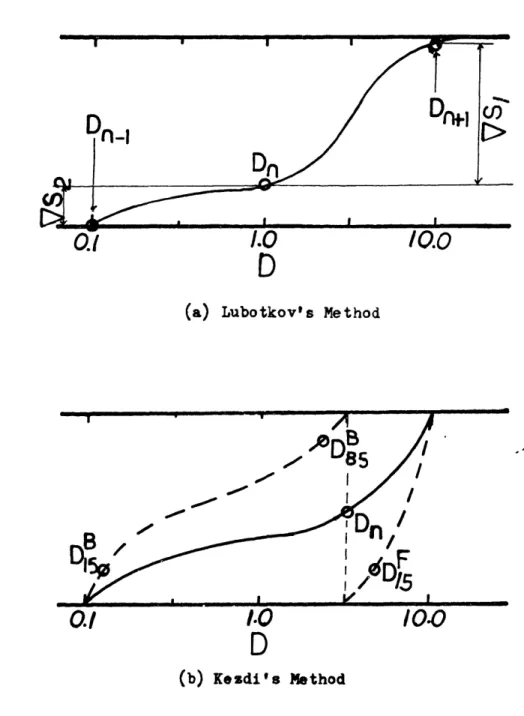
(1) Lubotchkov's Method: Soil is not susceptible to suffusion if the distribution curve lies between a given band with the notation of Fig. 1.1(a); a simplified mathematical formula is
n n+ 1
The method is said to be based on the characteristic grain size distribution curves which gives upper and lower bound for suffusion. However, the logic is hard to understand from the brief summary given by Kovacs.
ii) Kezdi's Method: This method checks suffusion based on Terzaghi's filter criteria by
separating the grain size distribution into two portions.
With the notation of Fig. 1.1(b), suffusion is avoided if:
F F
15 15
< 4 < for any D D 85 D 15
A similar method is also proposed by DeMello (1975) and applied by Sherard (1979). Kezdi's method assumes that soil particles larger than Dn compose the skeleton and those smaller than Dn are moving in this skeleton. Un-fortunately, the reality is that the same size of particles can contribute to both skeleton or moving soil. For this reason, the method seems applicable only to special cases such as gap-graded soils.
Wittman (1977, 1978) has carried out some experiments on a gap graded sand and gravel mixture which is typical of alluvial sediments of the Rhine, Rhone and Danube rivers.
25 Based on the experiments, he proposed a chart to classify the dominant failure phenomena as a function of sand/gravel mixing ratio and dry density (see Fig. 2.12 in Chapter II).
If the gravel content is high (more than 75%), the sand particles wash through gravel skeleton (i.e., suffusion or colmatation); whereas if the sand content is high (more
than 30%(%)), piping by heave (i.e., zero effective stress condition) is the dominant mode of failure. He also found that suffusion and colmatation can occur under lower
hydraulic gradient than the critical gradient which is accepted as a good criterion to judge safety against pip-ing by the heave phenomenon. Some of his findpip-ings will be applied to the soil particle transport model developed in the next chapter. Some additional considerations about gap graded soils will be made in the next section.
(2) Experiments with Soil Against Screen to Understand the Self-Healing Process of Base Soil
In the filtering process, the behavior of the base soil is a very important factor: DB85 of Therzaghi's criteria (DF-15/DB85<4-5) can be interpreted as meaning that, for stabi-ility, it is sufficient to prevent the coarse 15% of base soil from penetrating the filter. For the purpose of in-vestigating the behavior of base soil, soil-against-screen type experiments have been carried out by several research-ers.
that the behavior of the base soil can be more easily ob-served. The main advantage of replacing the filter by a screen is that for the latter there is no uncertainty on the size of the openings.
Soares (1980) carried out a series of experiments of this type under supervision of Dr. P. Vaughan at Imperial College. The objective of the study was to find a grain size of base soil such that if that soil particle size is retained by the filter, the base soil is stable without significant loss of material. This particle size could depend on the grading and the uniformity coefficient
(D60/D10) of the base soil.
The aim of the first group of tests (series 1S & 2S in the original text) was to see the influence of the uni-formity coefficient of the soil on the effectiveness of the filter; in this series, the size of the screen opening was set to the 85% size of the base soil. The uniformity co-efficient varied from 1.86 to 13.30. The loss of base
soil increased gradually with the increase of the uniform-ity coefficient, but even for D60/D10=13.30 case, the loss was not large enough for one to convince the non-stability of filter.
The second group of experiments (Series 3S) aimed at finding which particle size controls filtration. Four dif-ferent sieves with opening sizes agree to D50, D68, D83 and D97 of the base soil were used. The uniformity
co-efficient of the base soil was set to 2.86 in all cases (see Fig. 1.2). The greater loss of soil was observed for D97 case (see Fig. 1.3), and the author concluded that particles between D80 and D90 control the filter-ing process.
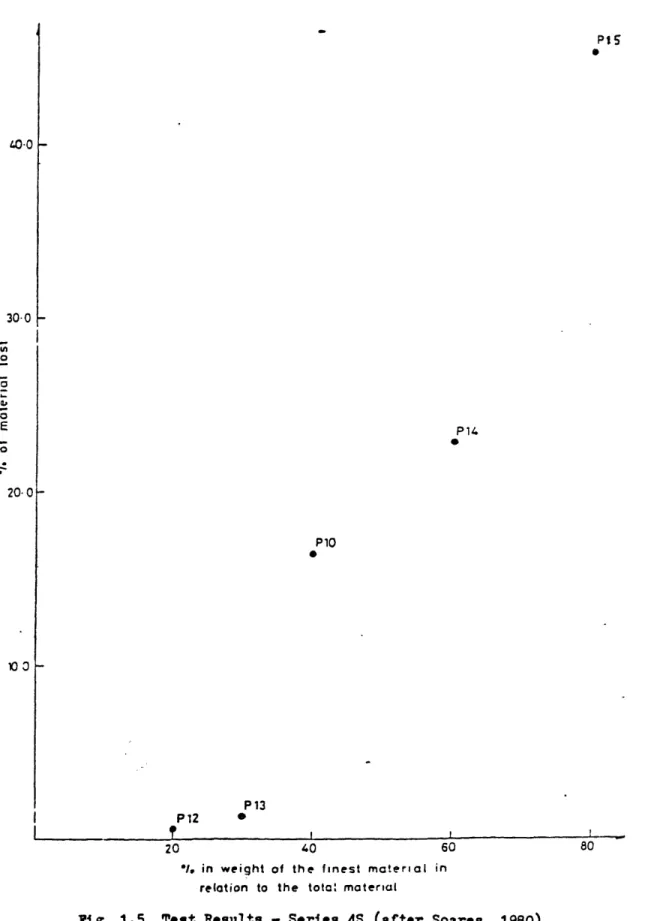
In a third group of test (series 4S), Soares used gap graded base soils. These soils were prepared in such a way that two particle size ranges (0.600 - 0.850mm and
0.075-0.150mm) were mixed in different proportions. The grain size distributions are shown in Fig. 1.4. The mesh opening size was 0.85mm which agreed to the particle
sizes between D92 and D72. The results presented in Fig. 1.5 show that there is significant decrease of internal soil stability when the amount of the finer portion in-creases from 30% to 40%. Furthermore, the author ob-served that the major loss of particle for samples with less than 30% of the finer portion occurred during place-ment and saturation of the samples, and the loss of soil
through sieve during flow took place at the very begin-ning of the test. On the other hand, the samples with more than 40% of the finer portion lost their material mostly during flow, and the loss did not stop even when the test was stopped. Based on these observations,
Soares suggested that there might exist a critical mixing ratio beyond which the coarser sand cannot produce, at least immediately, the self-healing filter at the sieve
interface.
Soares emphasizes the fact that, throughout all the experiments, the stability is controlled by the coarser particles: In the very early stage of the experiments, a layer consists of coarser particles formed at the soil-screen interface, and except for gap graded soils this layer can protect the rest of the soil from washing through. Therefore, the fraction of soil particles
that compose this layer is a key factor in this filtration process. As mentioned before, Soares' conclusion was that a size between D80 and D90 of the base soil can be used as the controlling particle size.
Mendez (1981) continued Soares's work by carring out two series of experiments. In the first series, Mendez used a mixture of graded sand and London clay with proportions of 60% sand and 40% clay. Downward flow was applied to this soil placed against a screen whose
opening could retain 85% finer fraction of this mixed soil. It was observed that the soil formed a self-healing layer of sand against the screen surface.
The second series of experiments aimed at forward-ing the study by Soares on the gapgraded sand. Mendez mixed two particle size ranges of sands (0.600-0.850mm and
0.075-0.150mm) in the proportion of 50% to 50%; these sands used were the same as the ones Soares had used in her gapgraded soil tests. Mendez also prepared the sand
with intermediate size distribution as shown in Fig. 1.6. Results for sands with intermediate size content showed the effectiveness of using DB85 as the controlling grain size (see Fia. 1.7(a)). However, the result of the com-pletely gap graded soil showed bigger loss as presented in Fig. 1.7(b). This result did not agree with Soares'
re-sults where Soares found proportional loss of base soil as the ratio of finer portion increase in her gapgraded soil experiment. Based on the result, Mendez speculated that if the sand is gapgraded, the coarser portion cannot act as an effective self-healing filter to the finer por-tion; therefore, the soil is internally non-stable.
Southworth (1980) also carried out a series of ex-periments with soil against screen. He used three
cohesion-less soils whose D60/D10 rates between 3 to 10. He plot-ted the mass of soil washed out from the screen against percent of the soil finer than the screen opening size as shown in Fig. 1.8 (cf.Fig. 1.3 of Soares' results). The loss increases rapidly between 80% and 90%, which
present essentially the same behavior as those obtained at Imperial College. Southworth's results will be used later
(Chapter II).
(3) Void Phase Description Based on Microscopic and Geometric Considerations
Some studies have been attempted to provide a better description of the voids in filters based on microscopic
Tayler (1948) is probably the first to have dis-cussed the void size of filters in this way. He
consid-ered a packing of spheres with the same diamter, and speculated that the maximum size of particles which can pass through this medium might be 1/6.5 of the size of the spheres. The result is based on the size of the opening created by three tightly touching spheres.
Silveira (1965, 1975) made a probabilistic exten-tion of this idea. He showed a procedure to obtain the void size distribution from a given grain size distribu-tion based on the following assumpdistribu-tions: (i) all particles are spherical, (ii) voids are created only from 3 (his
later paper (1975) extended it to 4) particles, (iii) the radis of the particles defining the void are random. The void size can be calculated based on the multinominal distribution of sphere sizes. Wittman (1979) measured
the void size of gravel and compared it to Silveira's theory. He found that the theory is nearly correct but gives somewhat smaller void sizes.
Vanmarcke & Honjo (1985) considered randomly drawn lines in space where spheres of given grain size distribu-tion are randomly located. They defined "distance be-tween particles" as the length of line bebe-tween two adja-cent particles which the line intersects. The first order
part-icles was obtained. They also showed that this expected distance is highly correlated to D15 based on the calcula-tion done for many grain size distribucalcula-tions. The result is considered to give a good explanation for using DFl5 as the representative void size of the filter.
This idea was extended later by Honjo (1983) to the soil particle transport problem. He assumed: (i) all
the particles are spherical, (ii) location of the particles are random in space, and (iii) distance between particles, if randomly measured, follows an exponential distribution. Based on these assumptions, Honjo developed a procedure to calculate expected length of a pipe of given diameter in the void phase of soil. This length can be related to the probability of a particle passing through a filter.
A more detailed survey of this topic can be found in Honjo (1983).
It is the opinion of the writer that there are two main drawbacks in this geometric approach:
(i) The problem is very complex and interactive due to the fact that once a particle which was mov-ing is caught, it clogs a path and becomes a barrier to the incoming particles. This interaction is very difficult to describe by the available models,
of an earth structure, it is very difficult if not impossible to relate this microscopic model to the behavior of entire structure.
In this study, a geometric approach is not attempted. Rather, focus is on a scale somewhat larger than that of individual particles.
(4) Criteria for Filter to Protect Seabed from Wave Action
DeGraauw, et al (1984) have published an intermediate report on the study of filter criteria to protect the sea-bed from wave action in the Oosterschelde in the Nether-lands. Their investigation has focused on measuring
critical hydraulic gradient with various filter construc-tions; for example, influences of cyclic flow vs.
steady flow, and parallel flow vs. perpendicular flow to the base soil-filter interface plane. The critical gradient is gradient at which the flow occurs that is responsible for the base soil transport. This is because more economical filters can be designed if one takes the
flow situation into account compared to the classic geo-metrically sandtight filters.
Because of this difference in focus, a direct com-parison of the result with other experiments is difficult; however, the study points out some important facts:
33
(i) For the cases when flow is perpendicular to the interface, it was found for the wide variety of the materials that base soil particles migrate into filter much easily under the
cyclic flow cases than under the steady flow cases. This can be attributed to the arch-ing of the base soil particles between the grains of the filter (arches cannot be stable under reversed flow).
(ii) Internal stability of the filter was tested by applying cyclic flow to a specimen
con-sisting of the same soil but with 2 differently colored layers. After exposed to the cyclic flow for 6 hours, samples were taken from the interface and sieved. It was found that mat-erial is internally stable with Dmax/Dmin=30 and unstable with Dmax/Dmin=100, where Dmax and Dmin are the maximum and the minimum grain size respectively. The interesting point
about this result is that the uniformity co-efficient differs only 4.2 to 5.3 in these
soils.
The authors also identified some future research needs, and states "the machanism are better understood,
after the current era of filters with critical hydraulic gradients that are not to be exceeded, the era will come of filters in which some material transport will be al-lowed. However, very little information on the latter is now available."
(5) Design Criteria for Geotextile Filters
In the last ten years, geotextile filters have grad-ually gained application in important civil structures. The papers by Hoare (1982) and Lawson (1982) reviewed the state of the art in this area. Design criteria are based on the same principle as for soil filters. What is in-teresting is the generally agreed mechanism by which geo-textile filters retain soils from washing through.
Figure 1.9 illustrates the mechanism (Lawson (1982)): very close to the geotextile, a highly permeable zone of large soil particles forms a bridging network. The finer particles in this zone have been washed away in the early stage of the installation of the geotextile filter. Right behind the bridging zone, there exists a so called "soil
filter" whose permeability decreases as the distance from the geotextile increase. This layer is actually retaining the rest of the soil from washing through. The soil be-hind this layer is essentially undisturbed.
Although geotextiles do not directly retain in situ soil, their choice is very important for the formation of
35
the "soil filter". The ideal "soil filter" should meet two criteria: (i) the permeability of the system should remain relatively constant with time; and (ii) no further in situ soil should be piped out after the formation of the "soil filter".
As one can see from the above description, the mech-anism is essentially the same as the "self-healing pro-cess" of the base soil. As a result, the criteria es-tablished for geotextile filters are very similar to con-ventional filter criteria:
Piping requirement: 0O < D85 soil
Permeability requirement: 0o > D15 soil where OI is an indicative pore size of the geotextile.
Because of this similarity, results obtained in
this study should be applicable also to geotextile filters. (6) Influence of Spatial Variation of Soil Parameters
and Quality Control
To the writer's knowledge, Witt & Brauns (1984)'s recent study is the first attempt to investigate the in-fluence of parameter variation on the reliability of fil-ters. They looked for the minimum dimensions of a sample which can represent the grain size distribution of an homogeneous soil mass. In this context, they took 128 adjacent samples from a 16 x 18 grid elements from their test embankment. Both D15 and D85 were found to follow
iation for D85 was one third that of D15 (Fig. 1.10(b)). They also provided a figure which shows the spatial corre-lation of D15 and D85 (Fig. 1.10(c)). They combined their findings with-Freudenthal's classic reliability model to show the influence of parameter variation on the failure probability.
1.2.2 Cracking, Leakage, Erosion and Filters
One of the main lines of current research on dam filters is based on the following failure scenario
(Vaughan & Soares (1982), Sheard, et al(1984(b)). Even in dams designed and constructed according to good modern prac-tice, the risk of developing concentrated leaks through the impervious core is relatively high. The leaks may be caused by: (i) development of cracks by differential settlement; (ii) cracks due to hydraulic fracturing;
(iii) construction deficiencies; (iv) high concentration of flowlines from soil into fractured rock and, (v) cracks due to drying especially in arid areas. The consequences of these concentrated leaks can be either: (i) gradual
clogging of the leaks by particles migrating from upstream or closure of cracks by upper soil collapsing; or (ii)
development of larger erosion channels which finally re-sult in piping failure.
fail-ure) of dams, some of which were designed and constructed in accordance with state of the art. In the case of
Balderhead Dam in England, leaks were induced by hydraulic fracturing and the filter failed to retain fines migrated from crack walls (Vaughan, et al (1970),Sherard (1973)). Hyttejuvet Dam in Norway suffered concentrated leak dur-ing the first filldur-ing of the reservoir, which is supposed to have resulted from hydraulic fracturing of the core
(Wood, et al (1976)), Sherard (1973)). Differential set-tlement due to irregular shape of the rock foundation is considered to be responsible for the serious damages by erosion in Stockton Dam in California as well as Matahina Dam in New Zealand (Sherard (1973)). Failure of the second-ary Dam of Wadi Qattarah in Libya was induced by drying
shrinkage cracks through the core (Khan (1983)). As to the failure of Teaton dam in Idaho in June 1976, it is generally agreed that the internal erosion initiated due to the high concentration of flowlines from the imperv-eous core into the joints of rock at the site (Chadwick
(1981), Seed & Duncan (1981)). Seed and Duncan (1981) stated in conclusion: "If the contact surfaces between the impervious core and the jointed rock at the Teaton site had been appropriately sealed and a filter layer had been provided to prevent movement of core material into any voids that may have inadvertently remained unsealed, the
dam design and construction allowing to which we can sys-tematically classify some current research efforts:
(i) Prevention of Embankment Cracking
This is a classic problem in dam design and construc-tion. Many provisions during design and construction to prevent cracking can be found in standard reference books such as Sherard, et al (1963) and Wilson, et al (1979). However, recent research work has been based on the fact that it is impossible to totally eliminate the probability of cracking of the core nil, and has attempted to investig-ate countermeasures which can protect embankment dams
from erosion even if some cracks develop.
(2) Erodibility of Base Soils and Dispersive Clay
Once a crack has developed and has been filled with flowing water, it is important to evaluate erodibility of the base soil. For this purpose, Arulanandan & Perry
(1983) have proposed a parameter called "critical shear stress", which is the stress required to initiate ero-sion during hydraulic flow. The parameter was found to be a function of clay type, composition of pore, property of eroding fluid and structure of soil. They also pointed out that even if the clay is erodible, it is possible to prevent dam failure if adequate protective filters are provided. Hjeldnes & Lavania (1980) investigated a sim-ilar problem for two particulr soils.
The related problem of "dispersible clay" has attracted attention of dam engineers since the early
1970's. It was first mentioned by Australian engineers
after studying the failure of small uniform dams by pip-ing (Aitchison & Wood (1965)). It is believed that cer-tain clays, presence of cercer-tain types of water, erode rapidly by individual colloidal clay particles going in-to suspension. Tests in-to identify dispersive clays
have been proposed by Sherard, et al (1972), (1976a), (1976b), and Sherard and Decker (1976). It is gradually becoming a concensus that even for dispersive clay part-icles migrated from crack walls can be retained by properly designed filters (Sherard 1979, Sherard, et al, 1976,
1984b).
(3) Filters to Retain Fines Migrated from Crack Walls In this dam failure scenario, filters should be designed to retain fines migrated from crack walls. This idea was originally proposed by Vaughan.and applied to the design of Cow Green dam (Vaughan, et al (1975)). He
states: "The investigation of the damage to the Balder-head dam showed that the filter downstream of the core had failed to prevent loss of material from the core due to internal erosion. The investigation indicated that, if crack forms in a clay core and the water velocity through it is slow, segregation of eroded material may
... To be fully effective, a filter must prevent the passage of these finest particles and this approach was adopted for the design of the Cow Green filter."
Vaughan and Soares have more systematically studied the problem in Soares (1980) and Vaughan & Soares (1982). To summarize their main conclusions:
(i) The finest particle size that a filter should retain can be determined from clay flock size. This depends on the clay-water chemistry at each site.
(ii) A relationship can be determined experi-mentally between the size of particles re-tained by a filter and its permeability.
This relationship seems suitable for the pre-liminary design of a filter.
The proposal of using permeability as a filter cri-terion seems reasonable since permeability is closely re-lated to size and structure of the void phase of a soil. Furthermore, such a criterion is in accordance with the use of the finer portion of a filter grain size distribu-tion such as DF15, because of widely accepted reladistribu-tion- relation-ships between permeability and the finer grain size (e.g., Hazen's formula).
on the designing of filters for silts and clays (Sherard, et al, 1984b). Two different types of laboratory tests have been developed by the authors, namely slot test and slurry test. In the former test, a slot is made in base material, and then a relatively high hydraulic gradient
(e.g., 1000) is applied. In the slurry test, the base soil is prepared in slurry form (water content about 2.5 times the liquid limit), and also the high gradient was applied. It is reported that the two types of tests gave comparable results.
The materials used by the authors for the base soils include a wide variety of clays and silts of different geological and geographical origin, including highly
de-spersive clays. All the filters consist of clean, fine sands of different gradation. For each of 36 different base soils, they determined the value of DF15 of filters which correspond to transition between stable and non-stable conditions.
The boundary DF15/DB85 ratios were found to range between 9 to 57, and not to depend significantly on Atterberg's limits. Furthermore, no significant differ-. ence was found between ordinary nondispersive clays and highly dispersive clays having similar particle size dis-tribution.
con-although sometimes too conservative, to design filters against cracked clay or slit core. However, it is the writer's opinion that they are too quick in justifying conventional filter criterion, DFl5/DB85. Since the ex-periment is comprehensive, more discussions on physical mechanisms of filtering may bring deeper insight to the phenomenon.
One of the aims of the present study is to give a deepen understanding in the soil particle transport with-in soil mediam. There is a strong, physical similarity between the ordinary base soil-filter problem and the problem of filters retaining the fines migrated from crack walls: for example, Vaughan and Soares (1982)
claim that their permeability cirterion is valid for both clay particles and usual cohensionless uniform base soils if DB85 is used as the minimum particle size to be re-tained, and Sherard, et al (1984b) has reported Terzaghi's criteria works well for clay particles, also. The writer believes that, although most of the experimental data
this thesis is based on is on cohesionless base soils, the results should shed some light also on filtering against clay particles migrated from the crack walls.
1.3 Purpose of the Present Study
In the dam filter design, one faces a problem sim-ilar to those of many other geotechnical engineering pro-blexas: conventional design criteria has been derived mainly by empirical means, and it is the consensus of
the profession that the criteria, although sometimes con-servative, work well on most of the cases. However, be-cause of the broadening of the applications and the re-quirement for more economical design, there is a nec-essity to understand the phenomenon in greater detail.
In addition, there are a frw incidents reported that the conventional criteria did not work satisfactorily.
The objectives of the present study are as follows: (i) To improve understanding of the mechanism of
soil particle transport, especially in the context of filtering through physical model-ing and statistical analysis of existmodel-ing experimental data.
(ii) To search for improved filter criteria as well as to assess uncertainty involved in
them.
(iii) To propose a method to calculate the proba-bility of malfunctioning of a filter for an entire earth structure. The model should help in evaluating the degree of uncertainty
ity control during construction.
This thesis is organized as shown in Fig. 1.11. First, in Chapter II, a soil particle transport model is developed. Although the transport model is fundamental and popular in many other fields, it has never been applied to the soil particle transport problem. The model is capable of accounting for special features of the soil particle transport phenomenon, particularly the release and absorption of soil particles. The model is verified by using experimental data by Southworth
(1980) on soil against sereen. Many numerical simulations of soil particle transport at base soil-filter interface
are also presented; these results are helpful in under-standing the mechanisms involved in filtering. It is em-phasized that the self-healing mechanism of base soil plays a major role in the filtering process; the proper-ties of base soil that are desirable for this process are discussed.
In light of the physical insights obtained in Chap-ter II, a statistical anaysis of existing laboratory data on filter performance is carried out in Chapter III. It
is believed to be the first attempt to analyze the filter performance data by a statistical method. The
perform-ance. Then the analysis is extended to searching for im-proved design criteria. This analysis confirmed the
primal role of DF15/DB85 (the parameter-used in the con-ventional Terzaghi's criteria), however, a secondary parameter (DB95/DB75) is found, which is considered to give information on the self-healing properties of the
base soil. The implication is that even if the convention-al filter criteria (i.e., DF15/DB85 < 4-5) is on the
average conservative, the same criteria becomes uncon-servative if the base soil has broadly distributed coarser portions. The uncertainty involved in the proposed
criteria is also analyzed.
In Chapters II and III, the particle transport problem is restricted only at the specimen scale. The problem is extended to the scale of the whole structure in Chapter IV, where a model to account for the spatial variability of soil properties is developed. The model is a generalization of the well known weakest link con-cept to a two dimensional continuum. Through this model, one can calculate the failure probability of the entire structure by knowing the failure probability at each in-dividual point of the base soil-filter interface plane, and a parameter that has the measure of correlation distance.
The construction record of Carters Dam, Geogea is used for a case study in Appendix C. Based on the grain size data, the average failure probability function is
ob-tained using the results of Chapter III. The correlation structure is estimated from the construction control den-sity tests data because the grain size data are too few to estimate the spatial correlation. The calculated failure probability appears to be reasonable.
(a) Lubotkov's Method
.-B
/0.0
(b) Kesdi's Method
Fig. 1.1 Methods to Judge Internal Stability of Soils
uo!iDwLu nS
-4
49
7
W-1
co enco
Wi o 0 Eo 4-3 -4) LO 0~o 4 .U N cE LI 4)r S c +2 U) p.4o 0 0 0 0 s- 0 C Cm 0- I-o 0 0 0 0 0 0 0 0 -6D I ua:,Jad uoi DwwnGs
PIS P14 PlO P10 P13 P12 * 20 40 60 80
"1, in weight of the finest material in
relation to the tota: material
Fig. 1.5 Test Results - Series 4S (after Soares, 1980)
40.0 30-0 o In 00 a, E 0 20-0 100
C) 0 - o 0 0 o 0 0 0 0 0 _o * * - - -,1· SI I __ .±.. J...a _____ t ___________ ____ V-
C--Cl
I
...
Ii
r
-.. i I, ; -t I IK
iF~~ I I • I I I Njl-I- --II I I I I I I±
i
J 1
I
S 00o o 0 0 0 0 0 0 ID r;b .0 01 % O! DW rI4a b Cqu 2zjd L,014 Dujwn
-
I ' l-H-
-I-4-
V -C 0 tc L_ I6-46) CL.-i. 0t U ~~.1~~ "D C ~IjIx~ 0 I-O 0 L. Lv) c 0 U 'I a I-0 V E E 4) 0 EI 4. C "O O- 0-E V 7 0CJ we r (O O Li 3 b C ~c~s- - J ~ I I ~~IVy
i I ? -~C-E~- -~Ei--C rr) L LI) ~3 J CPt_~_t_(
I I I I I1
I
-L - - .7
----
1
3
-- L-; · -· --·
--7
I 1 1 -r -I 1 1 - r_ 7 w1 a v wj I -i t* 0 CY) 4o t O 43'd 0 o *0 0l) LO U(%J
CC)
N 4ooa 0 a, 4 co $.4 0 -43 4-D011
0E-a, O U) 0d '-a, 43l '-a, Sl 43P aE o~ S -.4a 53 so leelew) % Lo osll!a~w lP2
U
40
30
2u 40 0 80
% in weight of the finest material in relation to the total material
Fig. 1.7(b) Test Results for Gap-Graded Sands (after Mendez 1982)
Soares' Result
0
O
co
4-I-%
finer than the mesh
opening
size
Pig. 1.8 Results of Southworth's Tests of Soil against Screen CD
E
COE
0 L-C
0i5
co)
Undisturbed Soil Soil Filter Bridging Network reotextile Soil Woter
Fig. 1.9 Formation of Soil Filter behind the
Ln *0 3 a) E E E t-r Ln C:) 3 ro C,: .IU)c-4 -404 : cr LUO > C: I- .~ " 4 UL" -4 a C)3; u L 0Go I 0 01 0 Ln 0C f N 00-%
(ai NOIIVdVA JO1 iN313 13030
43 Ey E L" 0 4 U-%IAON3flo3~i oXr 0 0 * O* (N -c' E C-?" 40- ~n $43 V Ek 4J -m2o u c 14 LO4:D3 7J a,4 a, -00 CD t" --4 G 0k th t LOO ci o C o 0 0 0 0 U-) -4 CV r-4 - 0 SNOUlVA83SSO -O 38HfN 42 d4 0 -14 E fu -4 4Jp a) CC, < 1 _ 0), c, '~ ) 4.44.4 0)C. C5 ao A0 Z IA*/ IH913ArA8 83NIJ% 57 ...
0z HrlJ
rn
0 CD oz - w H 0oH E-4 0·E-4
9
4 -M 4 L A z 4 P4 > 0 rX 44 o (01 4O) 0 ao tv "-P o, O fl o a) .C 4 El 4J 9 a) n 04 44 ,-4 z C. (a o u 0 rVQ)oa .r4 3: a) 0 Z 0 4J 9-o €:Nl•-a,-) 001 -4). 1,4 •.r-.i.3 a 4J 0)0 4. I 4J .7-4 0 (v .,-I O'd 44 · i p a) 0• 0 04' 41 U)I 4-) r-i W-C -"14 0 ~ i4 4-(0 44 V)J >40)W p ~04J 01 U/) r-q.J Eo< Lw
.,-4,1 QCa U 4J 0 r-I.4 4-) Wa d s-i 0 C: a4) 4J 00 W)'. • • En •En.c 4•4.Qi r0 >i -)44 d C a 0 CrO-40 0 (tzrI 44 P to 00 rc·l rq 4) 4 C r q4j0 ( -4J .0 -H 4- -H Q) 4-1 it :) r V)a 0~~ El)U)Ca9a) U)
a) U 4-j tr 4-4 9 .. 40 a) c 4 LH Z 0 44 F= H C3) W I o 0 04 H r-.p -q- : En W O -I 0c a) =-H 0 44 4 4J (UCL0 C^Or o ,.. Lr I~~ U 44 $4 •-,4ro 0) qp 4 -0p-$4 r 0- 4C -4 Ca.o 4 ) 0) CD) Cl O W re 03. . 4- n 04JC O 4J M 4: a)q 9 )j 4 r-im 0> W 44W 41U) -HJ.'(o 4-j = a4 ) .9.4 >4 CaO 4 a) 9a 0) W'i k 0 ,-- 4 1. r-€ > a) > 4 E-4 (L0)-rq m 0a0 ) w r-4 .p4 > = 0 k 0 9 W 4-) 04 m ;> 00
0
W d)) 4-I a,--M .- M ald 0140 H a HU 0 4J a) 4.)Ca >U) .E O 4J ý 5-44.i 4-40-i Orc <o CJ (4 I V a I SIO Q• I 0)- U) 4) m dC:d r-i ~0 -r4 CN V) 4-) Or-4 Z z3 H w Wa U) :3 w -a) oCd Sao .4 C4J 0 V 0 . 4J-- 4J ,- . H 0 03 r-4r-4'o r O-wE 5-'- M CN a t -rto( 4 a)V CO 44 o 4J W '0 9rv.-.W Q 3a~ C' a Ca 04 44 C- W .0 Mr 4) 0) rq -4 4)-rj4J H Wi-4i-I 4 $4 -a ) $4 0i-4) W Q Xa) -0 0 0CHAPTER II. PHYSICAL ASPECTS OF SOIL PARTICLE TRANSPORT In this chapter, a simple one dimensional model is introduced to describe the movement of soil particles
within a soil medium. The presentation is somewhat quali-tative due to the difficulties of obtaining model para-meters. Still, the model provides useful physical
sight into the soil transport phenomenon, and helps to in-terpret the results of the statistical analysis in the next chapter.
2.1 Introduction
Not many theoretical studies exist regarding the soil particle transport. Among those are Silveira
(1965, 1975), Wittman (1978) and Honjo (1983). All of these studies attempt to model the movement of soil part-icles within a soil medium by considering the void phase geometry of granular soil. This approach faces two main difficulties:
(i) The main practical concern is to predict the behavior of whole earth structures, or of smaller soil volume (e.g., a specimen). It is unfortunately very difficult, if not im-possible, to deduce the behavior of a soil mass from void or granular characteristics.
determined by very complex interactions be-tween moving soil particles and stable
particles which work as barriers; at different time and space locations, the same particle may change from one type to the other.
Instead of looking at the problem at the scale of individual particles, we will develop a model in terms of absorption and release of various size particles. The model is of a type which is commonly used in many trans-port problems, (e.g., chemical solute transtrans-port in por-ous media, contaminant transport in ground water), satis-fies the conservation of mass and is capable to model con-vection, absorption, release (generation) and dispersion of solute or, for us, particles.
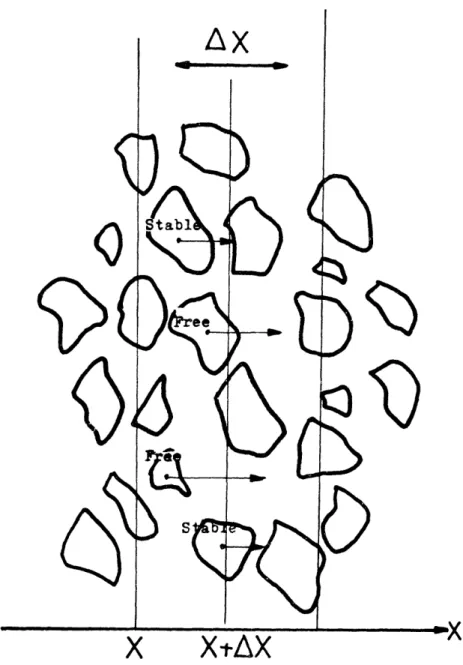
Before developing the model, some useful terminology should be established. Free Particles are those particles that are in a state of moving. The remainder of particles act as barriers and are called Stable Particles. The
notion from free or stable conditions is not associated with a particular particle size; rather, particles change from one type to the other depending on the change of state of the medium in time and in space.
to stable is called absorption. The reverse phenomenon is called release.
Only a one dimensional deterministic formulation of the problem is presented in this chapter. This is be-cause the model purpose is to understand the physics of the phenomenon. Detailed experimental results are es-sential to the estimation of model parameters, and to the extension to 2 or 3 dimensions.
2.2 Modeling of Soil Particle Transport
The main factors that influence soil particle trans-port are discussed first in Sections 2.2.1-5. A model is then developed in Section 2.2.6 and methods for its num-erical implementation are described in Section 2.2.7. 2.2.1 Conservation of Mass
Conservation of Mass is a fundamental principle of all transport phenomena. It is the basis of the contin-uity equation in fluid mechanics; for soil particle trans-port, it can be expressed as follows.
Consider the small one dimensional element (x,x+dx) illustrated in Fig. 2.1. The inflow into and the outflow from the element of free particles with grain size in the interval (w,w,+dw) during the time interval (t,t,+dt) are written as Q(x-dx,t,w)v(x-dx,t,w)dtdw and Q(x,t,w)v