HAL Id: hal-00328740
https://hal.archives-ouvertes.fr/hal-00328740v2
Preprint submitted on 19 Nov 2008
HAL is a multi-disciplinary open access
archive for the deposit and dissemination of
sci-entific research documents, whether they are
pub-lished or not. The documents may come from
teaching and research institutions in France or
abroad, or from public or private research centers.
L’archive ouverte pluridisciplinaire HAL, est
destinée au dépôt et à la diffusion de documents
scientifiques de niveau recherche, publiés ou non,
émanant des établissements d’enseignement et de
recherche français ou étrangers, des laboratoires
publics ou privés.
Chemical modeling of L183 (= L134N) : an estimate of
the ortho/para H2 ratio
Laurent Pagani, Charlotte Vastel, Edouard Hugo, Viatcheslav Kokoouline,
Chris H. Greene, A. Bacmann, Estelle Bayet, Cecilia Ceccarelli, Renshui
Peng, Stefan Schlemmer
To cite this version:
Laurent Pagani, Charlotte Vastel, Edouard Hugo, Viatcheslav Kokoouline, Chris H. Greene, et al..
Chemical modeling of L183 (= L134N) : an estimate of the ortho/para H2 ratio. 2008. �hal-00328740v2�
November 19, 2008
Chemical modeling of L183 (= L134N) : an estimate of the
ortho/para H
2
ratio
L. Pagani
1, C. Vastel
2, E. Hugo
3, V. Kokoouline
4, Chris H. Greene
5, A. Bacmann
6, E. Bayet
7, C. Ceccarelli
6, R. Peng
8,
and S. Schlemmer
31 LERMA & UMR8112 du CNRS, Observatoire de Paris, 61, Av. de l’Observatoire, 75014 Paris, France
e-mail: laurent.pagani@obspm.fr
2 CESR, 9 avenue du colonel Roche, BP44348, Toulouse Cedex 4, France
e-mail: vastel@cesr.fr
3 I. Physikalisches Institut, Universit¨at zu K¨oln, Z¨ulpicher Strasse 77, 50937 K¨oln, Germany
e-mail: hugo@ph1.uni-koeln.de,schlemmer@ph1.uni-koeln.de
4 Department of Physics, University of Central Florida, Orlando, FL-32816, USA
e-mail: slavako@physics.ucf.edu
5 Department of Physics and JILA, University of Colorado, Boulder, Colorado 80309-0440, USA
e-mail: chris.greene@colorado.edu
6 Laboratoire d’Astrophysique de Grenoble, Universit´e Joseph Fourier, UMR5571 du CNRS, 414 rue de la Piscine, 38041 Grenoble
Cedex 09, France
e-mail: cecilia.ceccarelli@obs.ujf-grenoble.fr,aurore.bacmann@obs.ujf-grenoble.fr
7 Department of physics and astronomy, University College London, Gower street, London WC1E 6BT, UK
e-mail: eb@star.ucl.ac.uk
8 Caltech Submillimeter Observatory, 111 Nowelo Street, Hilo, HI 96720, USA
e-mail: peng@submm.caltech.edu
Received 15/07/2008; accepted November 19, 2008
ABSTRACT
Context.The high degree of deuteration observed in some prestellar cores depends on the ortho-to-para H2 ratio through the H+3
fractionation.
Aims.We want to constrain the ortho/para H2ratio across the L183 prestellar core. This is required to correctly describe the
deuter-ation amplificdeuter-ation phenomenon in depleted cores such as L183 and to relate the total (ortho+para) H2D+abundance to the sole
ortho–H2D+column density measurement.
Methods. To constrain this ortho/para H2 ratio and derive its profile, we make use of the N2D+/N2H+ ratio and of the ortho–
H2D+observations performed across the prestellar core. We use two simple chemical models limited to an almost totally depleted
core description. New dissociative recombination and trihydrogen cation–dihydrogen reaction rates (including all isotopologues) are presented in this paper and included in our models.
Results.We estimate the H2D+ortho/para ratio in the L183 cloud, and constrain the H2ortho/para ratio : we show that it varies across
the prestellar core by at least an order of magnitude, being still very high (≈ 0.1) in most of the cloud. Our time-dependent model indicates that the prestellar core is presumably older than 1.5–2 × 10⁵years but that it may not be much older. We also show that it
has reached its present density only recently and that its contraction from a uniform density cloud can be constrained.
Conclusions.A proper understanding of deuteration chemistry cannot be attained without taking into account the whole ortho/para family of molecular hydrogen and trihydrogen cation isotopologues as their relations are of utmost importance in the global scheme. Tracing the ortho/para H2ratio should also place useful constraints on the dynamical evolution of prestellar cores.
Key words.ISM: abundances – ISM: clouds – ISM: structure – Astrochemistry – Molecular processes – ISM: individual objects : L183
1. Introduction
Studies of the earliest stages of star formation have increased in the last ten years with the advent of new receivers acquiring better spatial and spectral resolution. Prestellar cores are dense and cold cores where gravitational collapse has not yet occured. In the densest regions of the core (where nH2 is greater than
a few 104 cm−3) most heavy molecules containing carbon,
nitrogen and oxygen seem to deplete onto the dust grains and only light ions remain in the gas phase. There has been extensive observational evidence of CO and CS depletion in
Send offprint requests to: L.Pagani
the center of prestellar cores (e.g. Caselli et al. 1999, Bergin et al. 2002, Bacmann et al. 2002, Tafalla et al. 2004, Pagani et al. 2005) which seems to be typical of the majority of dense cores. Nitrogen–bearing species like CN, NH3 and N2H+ appear to
subsist longer before freezing-out onto the dust grains (Tafalla et al. 2006, Pagani et al. 2007, Hily-Blant et al. 2008).
In conditions under which heavy species are depleted, H+ and
H+
3 (and its deuterated counterparts) are the most abundant ions
subsisting in the gas phase. H2D+ has been widely detected
and mapped in protostars and prestellar cores (Caselli et al. 2003, Vastel et al. 2006, Caselli et al. 2008) through its ortho fundamental line, with abundances high enough to be explained
by the CO depletion theory/observations. Although difficult to observe from Earth, the D2H+molecule has been detected with
its para line towards the 16293E prestellar core in the L1689N molecular cloud (Vastel et al. 2004) with an abundance similar to the ortho–H2D+molecule as suggested by Phillips & Vastel
(2003).
Consequently many theoretical studies were performed that included all the deuterated forms of the H+
3 ion (e.g. Roberts et
al. 2003, Walmsley et al. 2004). However all nuclear spin states (ortho, meta, para, corresponding to the spin state of the protons or deuterons) must be taken into account in order to compare with the observational sets. Moreover the thermicity of the forward/backward reactions strongly depends on the symmetric state of the species. Though the influence of the ortho/para H2
ratio on the chemistry of H2D+ (Pagani et al. 1992) had been
described several years before the first detection of the ion (Stark et al. 1999), it is only recently that this specific spin-state dependent chemistry has been studied in detail (Flower et al. 2004, 2006a).
The motivation for our study is the many deuterated observa-tions performed in the L183 prestellar core (PSC) and the main aim of this paper is to study the ortho/para H2ratio from some
of these deuterated species observations. To this effect, we con-strain two chemical models including all the symmetric states of H2, D2, H+3 and its deuterated counterparts with observations of
ortho–H2D+, combined with previous N2H+and N2D+
observa-tions. These models have been set up using recent dissociative recombination rates computed for H+
3 and its isotopologues as
well as all non negligible reaction rates between H2and H+3 and
their isotopologues (both presented for the first time in this pa-per).
2. Observations
2.1. Deuterated H+
3
We first observed the ortho–H2D+ (and para–D2H+) with
the Caltech Submillimeter Observatory (CSO) monopixel re-ceiver and subsequently took advantage of the newly in-stalled Heterodyne ARray Program, 16 channel 350 GHz band (”B-band”) (HARP-B) camera on the James Clerk Maxwell Telescope (JCMT) to fully map its emission.
2.1.1. CSO observations
The H2D+and D2H+observations were carried out at the CSO,
between August 2004 and April 2005, under good weather con-ditions (225 GHz zenith opacity always less than 0.06). Scans were taken, using the chopping secondary with a throw of 3′, using the reference position: α2000 = 15h 54m 08s.50,
δ2000 = − 02◦52′48′′.
The 345 GHz (respectively 650 GHz) sidecab receiver with a 50 MHz acousto-optical spectrometer backend was used for all observations with an average velocity resolution of 0.04 km s−1 (respectively 0.02 km s−1). At the observed
fre-quencies of 372.421385(10) GHz for the H2D+ (110-111) and
691.660483(20) for the D2H+ (110-101) lines (Amano et al.
2005), the CSO 10.4 meters antenna has a HPBW of about 20′′
and 11′′ respectively. We performed a cut in declination across
the main dust peak in L183 between (0,-40′′) and (0,130′′) for
H2D+and concentrated on the reference position for D2H+. The
system temperature was typically 1000 to 2000 K for H2D+and
2500 to 3500 K for D2H+.
Fig. 1. CSO map of the H2D+(110-111) line. The position is
in-dicated in arcseconds for each spectrum and the (0,0) position corresponds to α2000 = 15h54m08s.50, δ2000 = − 02◦52′48′′.
The Y-axis represents the antenna temperature
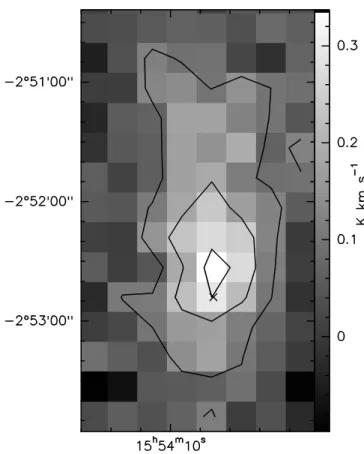
Fig. 2. JCMT map of the H2D+(110-111) line. The dust peak
po-sition (Pagani et al. 2003) is indicated by a cross and corresponds to α2000 = 15h54m08s.50, δ2000 = − 02◦52′48′′. Contour
Table 1. Line parameters from the JCMT and CSO observations. The positions are offsets to the dust peak emission at
α2000 = 15h54m08s.50, δ2000 = − 02◦52′48′′. For non–detected lines we give the 3σ upper limit. For JCMT and p–D2H+at
CSO, we give both the Monte Carlo (MC) and the LTE column density estimates.
JCMT
Position rms δv ∆v T∗
a N(o–H2D+)a,bMC N(o–H2D+)bLTE tau b LTE (′′) (K) km s−1 km s−1 K cm−2 cm−2 (-45,0) 0.08 0.049 0.3 0.11 3.6 1012 2.9 1012 0.11 (-30,0) 0.08 0.049 0.26 0.28 8.1 1012 8.1 1012 0.31 (-15,0) 0.09 0.049 0.51 0.41 2.0 1013 1.3 1013 0.49 (0,0) 0.09 0.049 0.41 0.57 2.3 1013 2.0 1013 0.77 (15,0) 0.08 0.049 0.47 0.46 2.0 1013 1.5 1013 0.57 (30,0) 0.08 0.049 0.39 0.21 8.1 1012 5.7 1012 0.22 (45,0) 0.08 0.049 0.50 0.13 3.6 1012 3.4 1012 0.13 (60,0) 0.08 0.049 <0.06 <1.8 1012 <1.6 1012 <0.06 CSO Position rms δv ∆v T∗
a N(o–H2D+)bLTE taubLTE
(′′) (K) km s−1 km s−1 K cm−2 (0,130) 0.08 0.077 <0.1 <3.0 1012 <0.1 (0,110) 0.08 0.039 0.50 0.25 8.0 1012 0.28 (0,90) 0.08 0.039 0.43 0.36 1.0 1013 0.42 (0,70) 0.08 0.039 0.40 0.39 1.1 1013 0.47 (0,50) 0.10 0.039 0.36 0.64 2.0 1013 0.95 (0,30) 0.08 0.039 0.50 0.48 1.8 1013 0.63 (0,0) 0.10 0.039 0.41 0.66 2.4 1013 1.00 (0,-20) 0.06 0.039 0.56 0.33 1.2 1013 0.38 (0,-40) 0.10 0.039 0.48 0.30 9.5 1012 0.34 Position rms δv ∆v T∗ a N(p–D2H+)cMC N(p–D2H+)cLTE tau c LTE (′′) (K) km s−1 km s−1 K cm−2 cm−2 (0,0) 0.07 0.042 <0.07 <2.4 1013 <1.5 1013 <0.48
a Column densities have been computed after averaging spectra at symmetrical distances from center.
b Column densities and opacities have been computed with a beam coupling correction of 70% for both JCMT and CSO. c Upper limit column density and opacity have been computed with a beam coupling correction of 60% at CSO.
The beam efficiency at 372 GHz (respectively 692 GHz) was measured on Saturn and Jupiter and found to be ∼ 60% (respec-tively ∼ 40%) for point sources. Pointing was monitored every 1.5 hrs and found to be better than 3′′. If the emission is
ex-tended compared to the beam size of CSO, as appears to be the case for H2D+then the efficiency is about 70% at 372 GHz and
60 % at 692 GHz. The data reduction was performed using the CLASS program of the GILDAS software developed at IRAM and the Observatoire de Grenoble and the LTE data analysis with CASSIS developed at CESR (http://www.cassis.cesr.fr).
These CSO observations confirmed that the H2D+emission
was extended in this source as we could hypothesize from sev-eral tracers and we carried on the project at the JCMT, recently equipped with a new 16-pixel camera to be able to fully map the source in a reasonable amount of time.
2.1.2. JCMT observations
The JCMT observations were obtained during semester 07A in service mode, using the HARP-B 16 pixel camera (one pixel, lo-cated in a corner, was unavailable). A third of the observations was obtained in jiggle–chop1 mode and two thirds in position
switch (PSw) mode. The jiggle–chop mode appeared to be no faster, the displacement of the telescope in PSw mode seeming minor compared to other overheads, and because the jiggle–chop mode works in the Nyquist regime, each pixel receives much less integration time than in PSw mode. As adjacent pixels had the
1 http://www.jach.hawaii.edu/software/jcmtot/het obsmodes.html
same off spectrum subtracted, the spatial average did not bring much improvement and we subsequently changed to position switch mode because deep integration on weak signal appears more important than Nyquist sampling for this work. In PSw mode, we made 2×2 pointings to fill the gaps in the camera, thus achieving a full beam sampling. Two such sets were performed to cover the main dust peak and its northern extension (Fig 2) with one pixel row overlap between the two.
Most of the observations were run in band 1 weather (τ225GHz <0.05) while a few were done in band 2 weather
lead-ing to rapid degradation of the system temperature. The source was observed only above 40◦elevation and the band 1 weather
system temperature was in the range 500-1000 K depending on the pixels and on the elevation. To observe both H2D+and N2H+
(J:4–3)(at 372.672509 GHz), we tuned the receiver half way be-tween the two lines and used a frequency resolution of 61 kHz so that the backend could cover both lines at once.
Data pre-reduction was done with the Starlink software (KAPPA, SMURF and STLCONVERT packages) and subse-quently translated into CLASS format for final reduction.
2.2. CO depletion and dust content
All other observations used in this paper have been obtained and published previously. The dust content of L183 both in emis-sion and in absorption has been described in Pagani et al. (2003, 2004). The source size is half a degree and contains a long fila-ment extending ∼6′from north to south. Two peaks are clearly
Table 2. Source parameters : distance from the core center, H2
density, N2H+abundance and N2D+/N2H+ratio. The position is
measured away from the PSC center along the R.A. axis (from Pagani et al. 2007).
Position H2density N2H+abundance N2D+/N2H+
(AU) (arcsec) (cm−3) 0 0 2.09 106 2.40E-11 0.69 ± 0.15 1310 12 9.23 105 8.50E-11 0.42 ± 0.05 2620 24 5.33 105 1.10E-10 0.25 ± 0.02 3930 36 3.22 105 1.53E-10 0.16 ± 0.03 5240 48 1.86 105 1.27E-10 0.06 ± 0.02 6550 60 7.08 104 1.00E-10 ≤ 0.03
call the main peak) with an opacity of ∼150 AV and a
sec-ond one, 3′ north of the first one (the north peak) with an
es-timated opacity of ∼70 AV. These peaks have the characteristics
of prestellar cores. Most of the filament have an opacity above 40 AV.
Two large scale C18O and C17O maps obtained with the Kitt
Peak 12-m telescope fail to trace the dense filament (Pagani et al. 2005). It is now well established that this is due to depletion of CO onto grains. Surprisingly, the opacity at which the deple-tion begins (∼20 AV) is two times higher than what is usually
observed in other clouds (e.g. Alves et al. 1999, Kramer et al. 1999, Bergin et al. 2002) though it still appears at a density (∼3 × 104cm−3) that is a typical depletion density threshold (Pagani
et al. 2005). Possibly, the low density envelope where depletion has not yet occurred is very extended in this cloud (which is con-firmed by its large influence on the C18O (J:2–1) line intensity
(Pagani et al. 2002). The depletion factor in volume for CO has been estimated to be 43 on average (Pagani et al. 2005) on the line of sight of the main dust peak and is probably much higher in the inner part of this core where density is above 1 × 105cm−3.
2.3. N2H+and N2D+
N2H+and N2D+have been mapped at both low (Kitt Peak
12-m, Pagani et al. 2005) and high (IRAM 30-m) resolutions. From the high resolution data, a strip crossing the main dust peak has been extracted and published (Pagani et al. 2007). In that paper, we performed a detailed analysis of the N2H+and N2D+
emis-sion with a Monte Carlo model treating exactly the hyperfine structure and line overlap of these species. We derived several physical properties, namely a maximum density of 2 × 106cm−3,
with a radial dependence proportional to r−1up to 4000 AU and
proportional to r−2beyond, a kinetic temperature of 7 (± 1) K, a slight depletion of N2H+in the inner 3000 AU of the core and
a deuterium fractionation which is non-measurable at 104 AU (< 0.03) and reaches ∼0.7 (± 0.15) in the center. As far as we know this is the highest fractionation reported yet for a singly deuterated species. However this may not be exceptional when compared to the detection of triply deuterated species, like ND3
(Lis et al. 2002, van der Tak et al. 2002) and CD3OH (Parise
et al. 2004) or to the fact that most reported fractionations are line-of-sight averages and are not derived from detailed profiles.
3. Analysis
We present 3 models in this paper : a Monte Carlo model to com-pute H2D+ and D2H+ line intensities, a chemical steady-state
model and a chemical time-dependent model.
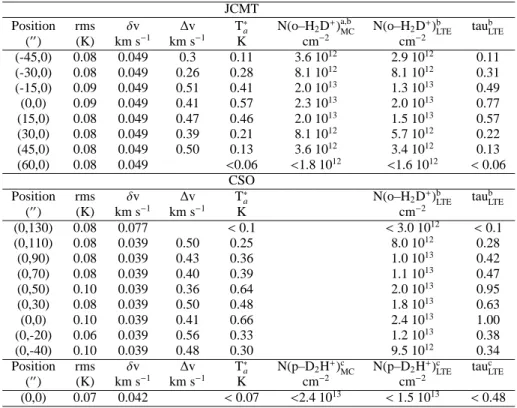
Fig. 3. ortho–H2D+spectra across the main dust peak. East and
west sides are folded together and fitted with a Monte Carlo model. Density and temperature profiles are taken from Pagani et al. (2007). The spacing between spectra is 15′′
Compared to previous works, we benefit here from two new sets of coefficients and a large set of observations in a PSC. The H+
3 + H2 (+isotopologues) set of rate coefficients are extracted
from the PhD work of E. Hugo in advance of publication and the H+3 (and deuterated counterparts) recombination rates have been computed for this work by V. Kokoouline and C. Greene and are presented in Appendix B. Rate coefficients, as computed by E. Hugo, describe all possible interactions between H+
3 and H2
isotopologues, including reactive and non-reactive, elastic and inelastic collisional rates, while recombination coefficients de-scribe the dissociative recombination (DR) rates of trihydrogen cation isotopologues. Both sets take into account all the ortho, para and (D+
3) meta states.
3.1. Line emission
We have analysed the line emission of both ortho–H2D+ and
para–D2H+using a two-level Monte Carlo code (adapted from
Bernes 1979) with our new collisional coefficients. Because the temperature of the PSC is around 7 K for both the gas (Pagani et al. 2007) and the dust (Pagani et al. 2003, 2004), the possi-bility of populating the next rotational level, JKK′′ = 212 at 114
K and 75 K above ground level for ortho–H2D+and para–D2H+
respectively, is so low that it can be safely ignored. With the new coefficients, the critical densities are 1.1 × 10⁵
and 4.9 × 10⁵
cm−3respectively and thus the lines are close to thermal
equilib-rium in the inner core. In the case of ortho–H2D+, the difference
between LTE (∼2.0 ± 0.25 × 1013cm−2) and Monte Carlo (∼2.3
± 0.25 × 1013cm−2) column density estimates is typically 10–
15% in the direction of the dust peak.
The para–D2H+ line has not been detected (see Caselli et
al. 2008) and the 3 σ upper limit corresponds to a total column density of ∼2.4 × 1013 cm−2using the Monte Carlo code. The
LTE estimate yields ∼1.5 × 1013cm−2.
3.2. Deuteration
H+
3 ions are formed at a rate 0.96 ζ by cosmic ray ionization of
H2(Walmsley et al. 2004), rapidly followed by reaction with
an-other H2to form H+3, and are destroyed in reactions with neutral
species and in dissociative recombination with free electrons, negatively charged grains and possibly negatively charged poly-cyclic aromatic hydrocarbons (PAHs−). In prestellar cores, the
primary reservoirs of hydrogen and deuterium are H2 and HD,
with HD/H2 = 2(D/H)cosmic ∼ 3.2 × 10⁻⁵ (Linsky 2007). The
proton exchanging reaction of H+
3 with H2 partly regulates the
H2 ortho–to–para ratio but has no effect on the H+3 abundance.
Concurrently, the reaction with HD forms H2D+and this primary
fractionation is then followed by the subsequent fractionations and produces D2H+and D+3 (Phillips & Vastel 2003, Roberts et
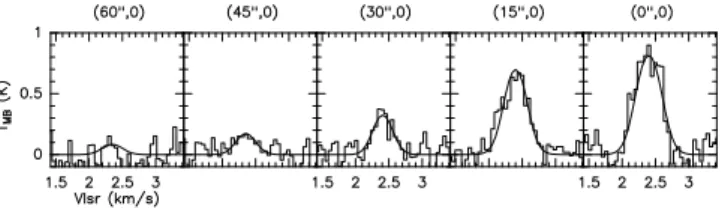
Fig. 4. Main reactions involved in the H+
3 chemical network.
When CO and N2 are depleted, the reactions with bold arrows
are dominant
H+3 + HD ←→ H2D++ H2+ 232 K (1)
H2D++ HD ←→ D2H++ H2+ 187 K (2)
D2H++ HD ←→ D+3 + H2+ 234 K. (3)
The backward reactions are endothermic with an energy bar-rier of about 200 K (when considering only the ground level for each species) and were thought to be negligible at the low temperatures found in prestellar cores (≤ 20 K), in which case the abundance ratios [HnD+3−n]
[Hn+1D+2−n] n=0,1,2would be greatly enhanced. However, such enhancement can be limited by various processes (see Fig. 4) :
– dissociative recombination of H+
3(and its deuterated
counter-parts) with free electrons or negatively charged grains (and PAHs−?).
– reactions with ”proton-friendly” molecules such as CO and N2 which destroy the trihydrogen cations to produce HCO+
and N2H+.
– ortho–H2 which can react with the deuterated trihydrogen
cation and remove the deuterium (see below).
In this modeling, we introduce the backward reactions to equations (1), (2), and (3) as we distinguish between ortho, meta and para states of the different species. When these reactions are completely neglected, the deuteration fractionation is consider-ably enhanced and observations towards pre-stellar cores cannot be reproduced (Roberts et al. 2003). Indeed, the importance of considering ortho and para states of various H/D carriers in the chemistry of the trihydrogen cation and isotopologues was first discussed by Pagani et al. (1992) and subsequently expanded in a series of papers by Flower and coworkers (Walmsley et al. 2004, Flower et al. 2004, 2006a,b, hereafter collectively referred to as FPdFW). Not only is this important in comparing the chemical
model predictions on the abundance of H2D+ to the
observa-tions of the ortho–H2D+ species alone but also because some
important reactions are much faster with ortho–H2 than with
para–H2hence no longer negligible. Indeed, the 170K internal
energy of the lowest ortho–H2level (J=1) is large with respect
to the temperatures of interest and can significantly enhance the
Boltzmann factor of endothermic reactions. In some cases, re-actions which are endothermic with para–H2can turn out to be
exothermic with ortho–H2i.e. fast and temperature independent. In fact, the ortho–to–para ratio of H2 is found to be a crucial parameter for the entire chemistry of deuterium.
The key reactions involving ortho–H2 are essentially with
meta–D+
3, para–D2H+ and ortho–H2D+ as well as para–
H2D+(see rates in Appendix A) because the internal energy of
the ortho–H2 alone is not enough to overcome the
endother-micity of reactions 1 to 3. Thus only those species which also have an internal energy high enough (so that the sum of the two internal energies is higher than the endothermicity of re-actions 1 to 3) can react with ortho–H2 at the Langevin rate
in cold gas. Thus, the three reactions involving ortho–H2 with
meta–D+
3, para–D2H
+ and ortho–H
2D+ present exothermic or
thermoneutral channels to rehydrogenate the cations forming ortho–D2H+, para–H2D+and ortho/para–H+3 while the reaction
between ortho–H2and para–H2D+can efficiently convert the
lat-ter to ortho–H2D+. The ortho–H2 molecule thus opens a path
to climb the 4 step energy ladder back from para–D2H+ to H+3
via para–H2D+and ortho–H2D+which can be very efficient in
the presence of large ortho–H2fractions. However, this efficient
ladder scheme does not include D+
3 because the conversion of
ortho–D2H+to para–D2H+is strictly forbidden in collisions with
H2and very inefficient in collisons with HD. Nevertheless, these
reactions can be a strong limit to the isotopic fractionation of H+3 hence of other species. Any chemical model which includes deu-terium chemistry must distinguish between ortho and para states of dihydrogen and trihydrogen cation isotopologues and include reactions between the different spin states following Pagani et al. (1992), Flower et al. (2006a,b) and the present work.
3.3. CO and N2chemistry
The CO and N2abundances are critical parameters in the
deuter-ation of the H+
3 ion. CO is expected to freeze-out onto the grain
mantles at high densities (a few 104cm−3) and low temperatures
(≤ 20 K) (e.g. Caselli et al. 1999, Bergin et al. 2001, Bacmann et al. 2002, Tafalla et al. 2002, Pagani et al. 2005). With an N2
binding energy similar to the CO binding energy ( ¨Oberg et al. 2005, Bisschop et al. 2006), these two molecules are expected to behave similarly. However, observations towards prestellar cores prove that N2H+(produced from N2) remains in the gas
phase at higher densities than CO. This can be explained by the fact that N2H+ is mainly destroyed by CO (Caselli 2002,
Pagani et al. 2005, Aikawa et al. 2005), so that the CO freeze-out implies a drop in the destruction rate of N2H+. This would
partially balance the lower formation rate due to the N2
freeze-out. Consequently, N2H+is observed to survive in the gas phase
at higher densities (∼106 cm−3). In the case of L183, we have shown that N2H+ partially survives but suffers from depletion
at densities starting at ∼5 × 105 cm−3to reach a factor 6+13−3 at the core centre (∼2 × 106cm−3). Because of growing deuterium
fractionation, N2D+abundance still increases towards the PSC
center until the N2depletion becomes predominant over the
deu-terium enhancement, and in turn, the N2D+abundance slightly
The N2D+and N2H+ions can be produced via the following routes: H+3 + N2 → N2H++ H2 (4) H2D++ N2 → N2D++ H2 (for 1/3) (5) → N2H++ HD (for 2/3) (6) D2H++ N2 → N2D++ HD (for 2/3) (7) → N2H++ D2 (for 1/3) (8) D+3 + N2 → N2D++ D2. (9)
We assumed that all the H+
3 isotopologues react at the Langevin
rate kN2 with N2 (which is inversely proportional to the square
root of the reduced mass of the colliding system, hence to the mass of the H+
3 isotopologue) and that deuterium and hydrogen
nuclei are equiprobably transferred. Consequently, H+3, H2D+,
D2H+and D+3 respectively produce an N2D+:N2H+ratio of 0:3,
1:2, 2:1 and 3:0. The measured ratio of 0.7 ± 0.15 in the cen-ter of L183 thus implies significant fractions of D2H+and D+3.
It has been shown (Walmsley et al. 2004) that in the case of complete depletion of heavy species (C, N, O...), D+
3 would be
the dominant trihydrogen cation isotopologue which would im-ply that N2D+is more abundant than N2H+. This is not the case
here ; nevertheless the N2H+deuterium fractionation is a good
constraint to the abundance of the four trihydrogen cation iso-topologues in our chemical model.
At steady state (d[N2H+]/dt=0 and d[N2D+]/dt=0), reaction
4 and its isotopic variants (5 to 9) being the main path to produce N2D+and N2H+, we obtain : [N2D+] [N2H+] = [H2D +] + 2[D 2H+] + 3[D+3] 3[H+ 3] + 2[H2D+] + [D2H+]. (10)
This ratio has been measured in the cut through the L183 main PSC. We describe in the following how our method can provide an estimate of the ortho/para H2D+ratio using this variable and
subsequently, of the ortho/para H2 ratio itself as well as some
indication of the cosmic ionization rate and mean grain size.
3.4. Grain distribution
Recombination of ions with electrons on negatively charged grain surfaces is an important process since it can be much faster than in the gas phase, especially in the case of H+ (Draine &
Sutin 1987). The negatively charged grain surface area is there-fore a crucial parameter (we can safely ignore positively and multiply negatively charged grains, considered to be very rare in cold environments, Draine & Sutin 1987). The grain size dis-tribution in prestellar cores is unknown since it mostly depends on grain condensation and also on ice condensation (e.g. Vastel et al. 2006). We thus treat the grain radius agr as a parameter of
the model, assuming all the grains to have the same size and the dust to gas mass ratio to be 0.01. Different values could be advo-cated (for example, in places where depletion is important, the ices increase the dust mass by up to 25%, Walmsley et al. 2004) but the net result is to change only slightly the average grain size which is not well constrained in the PSCs in any case.
The focusing effect of the Coulomb attraction between charged particles and oppositely charged grains has been in-cluded using the Draine & Sutin (1987) formalism:
˜ J(Z = −1) = 1 + 1 τ ! 1 + r 2 2 + τ (11)
where τ is the reduced temperature (τ = agrkT /e2, e being the
electron charge, k the Boltzman constant). Therefore the recom-bination rate of the H+ion on a negatively charged grain can be
expressed as:
kgr=
r 8kT πmH
πa2gr(S × ˜J(Z = −1)) (12) where agris the grain radius, mHis the hydrogen mass, T the
ki-netic temperature and S is the sticking coefficient (S ≤ 1). The latter represents the probability that a colliding species will stick onto the grain surface. For ions, Draine & Sutin (1987) con-cluded that the sticking coefficient should be unity. The same computation can be made to estimate the recombination rate of other ions, H+
3, H2D+, D2H+, D+3,· · · by a simple correction
of the atomic mass of the ions (respectively kgr/
√ 3, kgr/ √ 4, kgr/ √ 5, kgr/ √
6, · · · ). In the case of collisions between charged particles and neutral grains, the attraction due to the polarization of the grain by the charged particle can be expressed through:
˜
J(Z = 0) = 1 + r π
2τ. (13)
Therefore the sticking rate of electrons on neutral grains can be expressed as:
ke=
r 8kT πme
πa2gr(S × ˜J(Z = 0)) (14)
where meis the electron mass and S is the sticking coefficient. S
is about unity (Umebayashi & Nakano 1980) for a planar surface but a curvature of the grain surface will tend to reduce this pa-rameter. However in the following we will use a factor of about unity as this parameter did not seem to have a large influence on the results in our runs.
The grain abundance [gr] can be expressed using: [gr] = m4πH2fd/g
3a 3 grδ
(15)
where δ is the mean grain density (assumed to be 3 g cm−3, f
d/g
is the dust–to–gas mass ratio, and mH2 is the mass of
molecu-lar hydrogen. Another important parameter in our model is the abundance of the negatively charged grains ([gr] = [gr0]+[gr−]).
At steady-state, assuming partial depletion of CO and N2and
to-tal depletion of all the other heavy species : d[gr−] dt = [gr 0][e−]k e− [gr−][H+]kgr− [gr−][H+3]kgr3 − [gr−][H2D+]kgr4− [gr−][D2H+]kgr5− [gr−][D+3]kgr6 − [gr−][N2H+]kN2H+− [gr −][N 2D+]kN2D+
− [gr−][HCO+]kHCO+− [gr−][DCO+]kDCO+ = 0 (here we have neglected HD+, D+
2, He
+,...)
3.5. Steady-state chemical model
The code we describe in the following is used to calculate the steady-state abundances of the chemical species found in the dif-ferent layers of the L183 prestellar core as listed in Table 2.
In the steady-state approximation the abundance species are interlinked via their production rates and their destruction rates (production=destruction).
expressed as (including only the main reactions) :
[H+] = 0.04ζ
krec[e−]nH2+ kgr[gr−]nH2
(16) The main production path of H+
3 is via cosmic ray ionization
of H2and proceeds in two steps :
ζ +o–H2→ o–H+2 + e− (17)
ζ +p–H2→ p–H+2 + e− (18)
and H+
2 rapidly reacts with another H2to form H+3 but the
branch-ing ratios between different combinations of spin states are non-trivial (Oka 2004) : p–H+2+ p–H2→ p–H+3+ H (19) p–H+2 + o–H2→ p–H+3+ H 2/3 (20) → o–H+3+ H 1/3 o–H+2 + p–H2→ p–H+3+ H 2/3 (21) → o–H+3+ H 1/3 o–H+2 + o–H2→ p–H+3+ H 1/3 (22) → o–H+3+ H 2/3
These are different from those advocated by FPdFW who took branching ratios of 1/2 for both species. The ortho–H+
3
forma-tion rate from cosmic ray ionizaforma-tion kcr–ois therefore the sum of
several terms :
kcr–o= 0.96(1/3[p–H2][o–H+2] + 1/3[o–H2][p–H+2] +
2/3[o–H2][o–H+2]) (23)
The production rate for ortho–H+3 can be expressed as (including only the main reactions. The rates are listed in Table A.1) :
kcr–oζ +k 1oood[o–H2][o–H2D+]nH2+ (k0poop+ k0pooo)[p–H+3][o–H2]nH2+ k1pdod[HD][p–H
+
3]nH2 (24)
which represent respectively the formation from cosmic ray ionization, backward destruction of ortho–H2D+with ortho–H2,
spin conversion of para–H+
3 with ortho–H2and finally, spin
con-version of para–H+3 with HD.
The destruction rate for ortho–H+
3 can be expressed as
(in-cluding only the main reactions) :
(o–krec1[e−] + (k0oopp+ k0oopo)[o–H2]
+(k1odpd+ k1odpo+ k1odop+ k1odoo)[HD]
+kco[CO] + kN2[N2] + kgr1[gr−]))[o–H+3]nH2 (25)
which respectively represents its destruction by dissociative re-combination with electrons, spin conversion with ortho-H2, spin
conversion and deuteration with HD, proton transfer reactions with CO and N2and dissociative recombination on grains.
Similarly, the para–H+
3formation from cosmic ray ionization
can be expressed as :
kcr–p= 0.96([p–H2][p–H+2] + 2/3[p–H2][o–H+2] +
2/3[o–H2][p–H+2] + 1/3[o–H2][o–H+2]) (26)
The production rate for para–H+
3 is :
kcr–pζ +(k 1oopd[o–H2][o–H2D+] +
(k0oopp+ k0oopo)[o–H+3][o–H2] + k1odpd[HD][o–H+3] +
k 1popd[o–H2][p–H2D+])nH2 (27)
and the destruction rate is :
(p–krec1[e−] + (k0poop+ k0pooo)[o–H2]
+(k1pdod+ k1pdpo+ k1pdop+ k1pdoo)[HD]
+kco[CO] + kN2[N2] + kgr1[gr−]))[p–H+3]nH2 (28)
The N2abundance has been solved numerically to obtain the
observed N2H+abundance. Electronic abundance is adjusted to
reach equilibrium.
In our steady-state model, the H2 ortho/para ratio, the
aver-age grain radius and the cosmic ionization rate ζ are the varying input parameters. Within each layer of the PSC model (Table 2), these parameters are adjusted to match the following :
– the H2density
– the N2D+/N2H+ratio at 7K
– the observed ortho–H2D+column density
– the upper limit on the p–D2H+column density
Although the full range of grain sizes and ortho–to–para H2
ra-tios have been explored for each H2 density, we have not
al-lowed solutions in which, for example, the grain size would os-cillate from one layer to the next. We have searched for solutions throughout the layers in two different scenarios : (i) the grain size and the ortho-to-para ratio were both kept constant ; or (ii) the grain size was allowed to increase and the ortho–to–para H2
ra-tio to decrease with the H2density. In both scenarios, ζ was kept
constant throughout the layers. We neglected detailed reactions with D2as Flower et al. (2004) have shown that its role is
neg-ligible in general and we have kept the HD abundance constant which is generally a good approximation.
3.6. Time-dependent chemistry
In a second step, we have constructed a pseudo time-dependent model based on NAHOON, a chemical model, a version of which has been made publicly available by V. Wakelam2. We have modified this model in two ways : 1) we have replaced electron (resp. ion) reactions with neutral (resp. charged) grains as provided in the Ohio State University (OSU) reaction file (de-livered with NAHOON) by the set of equations described above (Sect. 3.4 and 3.5), which we have directly included in the pro-gram, to take into account Coulomb focusing ; 2) we have in-cluded the formation of HD and D2 on grain surfaces and we
have introduced the spin state of H2 and D2 with the usual
as-sumption that they are formed with the statistical ortho/para spin state ratio of 3 and 2 respectively. We have used the formation rate provided in the OSU reaction file (5× 10⁻¹⁷ cm3s−1) for the formation of molecular hydrogen. Because grains are cov-ered by ice in the environments concerned here, we consider that the only interaction between the atoms and the surface is physisorption. In this case, the formation rates of HD and D2
(in cm3 s−1) is half for HD and 105 times lower for D 2 with
respect to H2 formation (as dicussed in Lipshtat et al. 2004).
In environments where grains are not covered by icy mantles, on the other hand, one would have to consider chemisorption,
2 http://www.obs.u-bordeaux1.fr/radio/VWakelam/Valentine%20
which strongly changes the efficiencies of the formation of HD and D2(Cazaux et al. 2008) We have reduced the set of species
and reactions to our needs, limiting ourselves to the most impor-tant reactions (see below) but differentiating all ortho and para (plus meta–D+3) species as independent species and including all the detailed rates between the trihydrogen cation and dihydrogen isotopologues (see Sect. 3.7.1) including spin state conversions. However we have included more reactions than in the steady-state model, taking into account reactions with D2, H+2, He
+, etc.
and allowing the ortho/para H2 ratio and the HD abundance to
vary.
The main path to convert ortho–H2 into para–H2 is via the
reaction
o–H2+ H+→ p–H2+ H+ (29)
which proceeds seven orders of magnitude faster at 7 K than the reverse reaction.
3.7. Rate coefficients
Many groups have made available gas-phase rate coeffi-cients. The University of Manchester Institute of Science and Technology (UMIST) Database for Astrochemistry contains in-formation on 4500 reactions of which 35% have been measured experimentally, some at temperatures down to 20 K (Woodall et al. 2007). The OSU group provides approximately the same database but focuses more on low temperature chemistry. We accordingly use in our modeling some of the reactions in the lat-ter (with the most recent version OSU2007), considering the low temperatures found in L183. Apart from the rates presented be-low, all reaction rates involving deuterium have been taken from FPdFW (except recombination on grains for which we have used different sticking probabilities). We disregard the odd branching ratio of N2H+dissociative recombination reported by Geppert et
al. (2004) to consider a single possibility, namely the liberation of dinitrogen (Molek et al. 2007).
3.7.1. H+
3 + H2isotopologue reaction rates
Phase space theory (PST) was used to derive thermal state-to-state rate coefficients for the whole H+
3 + H2 → H+3 + H2
sys-tem and isotopic variants in the sys-temperature range 5–50K. This statistical method accounts for such quantities as mass, energy, rotational angular momentum, nuclear spin symmetry and their respective conservation laws. The ergodic hypothesis which is a requisite for PST as well as the full-scrambling hypothesis are assumed according to the topology of the PES (Yamaguchi et al. 1987, Xie et al. 2005). Reactant (product) trajectories are treated with the classical Langevin model. The resulting set of state-to-state rate coefficients deviates from the detailed balance principle by a few percent at worst and is consistent with ther-modynamical equilibrium constants. Details will be given in a forthcoming publication (Hugo et al., in prep.)
In the present astrochemical model, nuclear spin states of the different molecules are treated as distinct species but their rota-tional states are not considered individually. We thus made the assumption that only the rotational ground states of each nuclear spin species were populated and used the ground state-to-species thermal rate coefficients obtained by summing ground state-to-state thermal rate coefficients over the product channels.
3.7.2. H+
3 isotopologue dissociative recombination rates
The dissociative recombination (DR) rate of H+
3 is difficult to
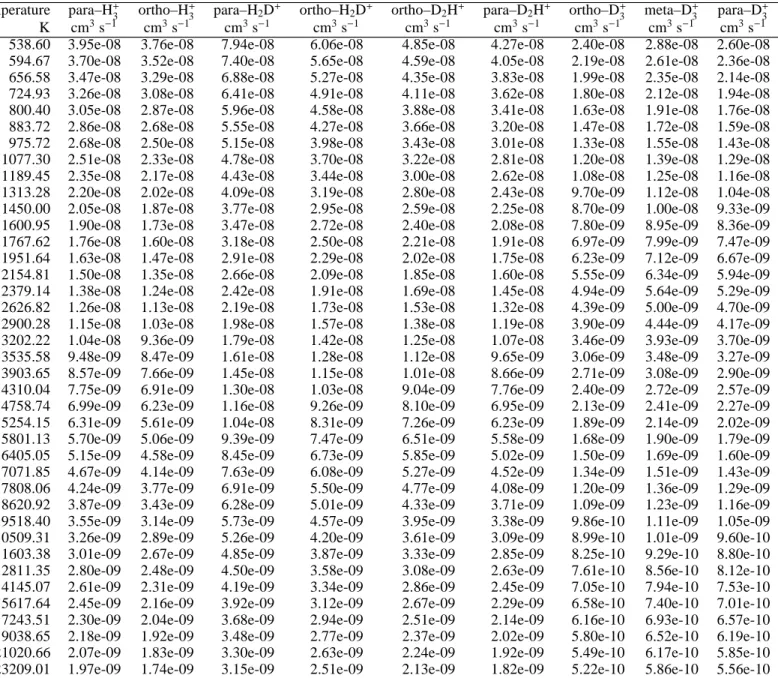
measure experimentally. Since the early measurements e.g. by Adams et al. (1984), numerous attempts have been made and are summarized in two papers (Bates et al. 1993, Fonseca dos Santos et al. 2007). In parallel, theoretical work has also been developed with the latest one published by Fonseca dos Santos et al. (2007). Extending upon that work, we present here, in Table B.1, the H+
3 updated DR rate (Fonseca dos Santos et al. 2007) along with
newly calculated H2D+, D2H+, and D+3 DR rates (see appendix B
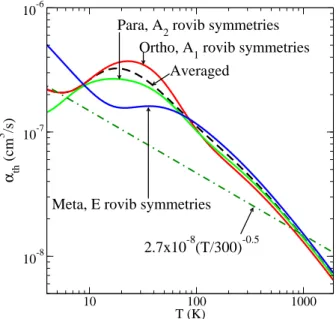
for more details). These calculations do not predict the branching ratio of the DR products. We have thus adopted the branching ratios published elsewhere (Datz et al. 1995a,b, Strasser et al. 2004, Zhaunerchyk et al. 2008) which we have applied to the calculated rates. The resulting DR rates at 7 K are listed in Table A.1. Several remarkable effects at low temperature are visible (see Figs B.1, B.2, B.3, B.4) :
– the strong departure of the ortho–H+
3 DR rate from that of
para–H+
3. The difference is a factor of 10 at 10 K.
– D2H+shows a large DR rate drop, by a factor of 10 at 10 K
for both ortho and para species compared to the extrapolated value used by FPdFW.
– On the contrary, a large increase of the D+
3 DR rate is
pre-dicted to occur but mostly at temperatures where deuteration is low and therefore the consequences for D+
3 abundance are
limited.
4. Results and discussion
4.1. H2D+linewidth
In order to fit the observed ortho–H2D+line profiles, we run the
Monte Carlo model using the ”best model” velocity, density and temperature profiles derived from the N2H+and N2D+data
ana-lyzed in Pagani et al. (2007). However, the linewidth for the two stronger spectra (offsets (0,0) and (15′′,0), Fig. 3) is too wide to
be reproduced with the same micro–turbulent width which we have used for N2H+(∆vturb(FWHM) ≈ 0.14 km s−1). Indeed, the
central spectrum linewidth measured by fitting a Gaussian yields 0.45 (±0.03) km s−1. The thermal contribution is
∆vtherm(FWHM) = 2.336 ×
r
kT
m = 0.28 km s
−1 (30)
at 7 K, which implies that ∆vturb(FWHM) contribution is 0.35
km s−1, 2.5 times larger than for N2H+. Here k is the Boltzmann
constant and m is the mass of H2D+. If we impose a turbulent
velocity similar to the one modeled for N2H+, then the
temper-ature needed to obtain such a wide line would be 16K which is completely ruled out by N2H+observations (Pagani et al. 2007).
Infall motion limited to the inner core could have explained the H2D+width if no H2D+spectrum other than the central one had
been wide combined with a large depletion of N2H+. This is not
possible because the H2D+ spectrum at (15′′,0) has the largest
width (0.49 ±0.03 km s−1) in a region where N2H+ is hardly
depleted. This remains therefore a pending problem.
4.2. N2H+deuteration 4.2.1. Requested conditions
We next discuss the main parameters that control the N2H+
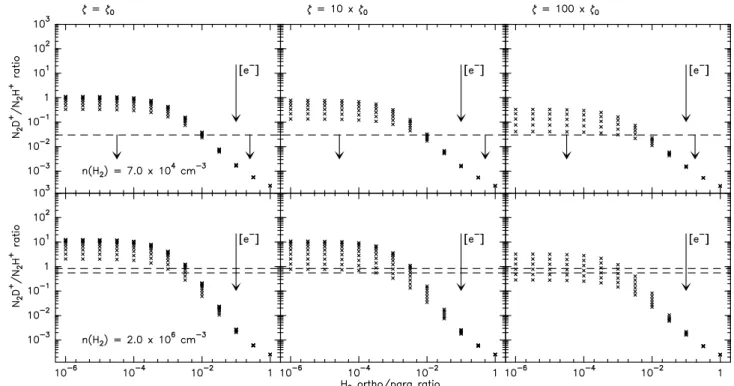
Fig. 5. N2D+/N2H+ ratio as a function of the ortho/para H2 ratio for all possible electronic abundances and total depletion (the
steady-state chemical model). The lower row corresponds to the densest part of the PSC (n(H2) = 2 × 106 cm−3) and the two
horizontal dashed lines the measured range of the N2D+/N2H+ratio while the upper row corresponds to the external part of the PSC
(n(H2) = 7 × 104cm−3) with the dashed line representing the N2D+/N2H+ratio upper limit. The three columns represent different ζ
values as indicated above (ζ0= 1 × 10⁻¹⁷s−1) . The large arrow indicates the direction of increasing electronic abundance
Fig. 6. Same as Fig. 5 but with a CO/H2 abundance of 10−5in the outer layer (n(H2) = 7 × 104cm−3) and 10−6in the inner layer
(n(H2) = 2 × 106cm−3)
The models have been run for a temperature of 7 K which prevails in all the layers where N2D+has been detected in the
PSC cut presented in Pagani et al. (2007). We have also run the models for the corresponding density, N2H+abundance and
N2D+/N2H+ ratio of each layer (the parameters are listed in
Table 2).
As discussed above, the abundance of ortho–H2is the main
controlling factor of the trihydrogen cation isotopologue abun-dances and therefore of the N2D+/N2H+ratio (and similarly of
the DCO+/HCO+ratio, see e.g. Maret & Bergin 2007). We have
therefore explored the range of possible solutions for the or-tho/para H2 ratio in the two extreme layers of our core profile
(n(H2) = 7 × 104cm−3and 2 × 106cm−3) for which we have a
N2D+/N2H+ratio of <0.03 and 0.7 ± 0.15 respectively (Fig. 5).
We have done this for three cosmic ray ionization rates (10−17,
10−16, and 10−15s−1) covering the values generally discussed in
the literature (e.g. Maret & Bergin 2007) and for all possible electronic abundances (or average grain sizes as they are linked via the abundance of H+which is mostly controlled by the grain surface area). In this first run, we have simulated total depletion by adjusting the CO and N2abundance3to 10−8. We have also
indicated the range of N2D+/N2H+ratio measured in both
lay-ers. The average grain radius has been varied from 0.01 µm to 5 µm and electronic abundance from 10−11to 10−6which cover
the usually accepted values. We can see that N2D+/N2H+ratios
above 100 are possible in dense gas though they require very low electronic abundances and therefore very small grains which are probably absent from these dense and cold regions due to grain coagulation (see e.g. Stepnik et al. 2003).
In the lower density outer layer where no N2D+has been
de-tected, the ortho/para H2 ratio must be high enough, i.e. above
∼0.01, to prevent any deuteration from occuring whatever the cosmic ray ionization rate. On the contrary, the dense, strongly deuterated layer has solutions only below a maximum ortho/para H2ratio of 0.01 (or lower for high ζ rates). Thus the ortho/para
H2 ratio across the PSC clearly must vary from above 0.01 to
below 0.01. In the case of low cosmic ray ionization rates (10−17
s−1), though the ortho/para H
2 ratio of 0.01 seems to be a
com-mon solution for both layers, it requires a high electronic abun-dance (and large grains) in the outer layer and a low electronic abundance (and small grains) in the inner dense part. This is clearly improbable. The temperature being low enough in all the layers, warm layers (above 20 K) cannot be invoked instead of a high ortho/para H2 ratio to limit the deuteration in the outer
parts of the PSC. CO total depletion is however questionable and in the model we also used a CO depletion factor of 10 (abun-dance of 10−5) in the outer layer and a CO depletion factor of
100 (abundance of 10−6) in the inner layer (Fig. 6). This only
limits the maximum N2D+/N2H+ratio which decreases by one
order of magnitude. Indeed, the destruction of H+3 by CO domi-nates over recombination with electrons when their abundance is very low and vice versa. However, the conditions to reach the observed N2D+/N2H+ratio remain unchanged and therefore only a variable ortho/para H2ratio can be invoked. Such a
vari-able ortho/para H2 ratio cannot be investigated with a
steady-state model because in all layers, the ortho–H2abundance would
eventually decrease to values about of 10−3–10−4as discussed by FPdFW.
4.2.2. The ortho/para H2variation
We discuss here the possibilities of making the ortho/para H2
ratio vary across a single PSC.
It is commonly accepted that H2is formed on grain surfaces
with an ortho/para ratio of 3 because of spin statistics and the exothermicity of the reaction H + H → H2. Subsequently, the
ortho–H2is converted into para–H2following equation 29 and to
a lesser extent with reactions involving H+
3 and its isotopologues.
As already discussed by FPdFW, this conversion is slow and has probably not reached steady state in clouds with ages between 105and 106years.
3 Here, we look for general solutions of the N
2D+/N2H+ratio as a
function of several parameters, we thus do not try to fit the N2
abun-dance to obtain the observed N2H+abundance
We have therefore run the modified Nahoon model to search for a simultaneous solution for all layers which would get the necessary ortho/para H2gradient across the PSC to achieve both
the observed N2D+/N2H+ratio and ortho–H2D+abundance
pro-files. In this model, we have no direct measurement of the CO abundance but for the credibility of the model, we have set the CO abundance to 10−5in the outer layer and increased the deple-tion to reach a factor of 100 (i.e. a CO abundance of 10−6) in the
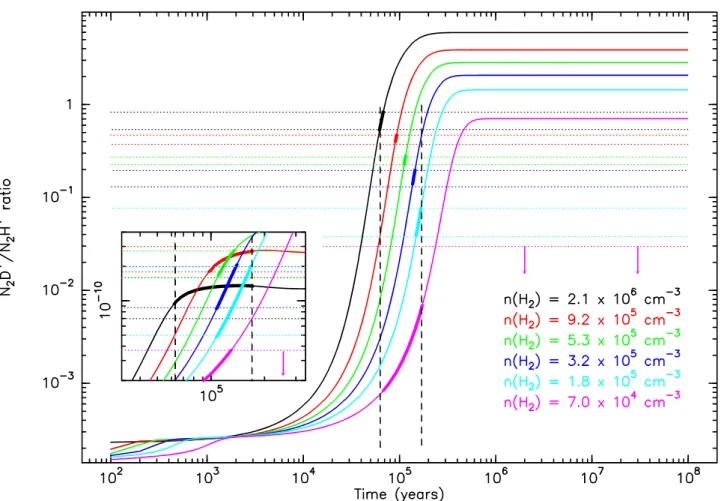
core. The results are presented in Figs. 7 & 8. We have searched for a solution where each modeled layer meets the two obser-vational constraints (N2D+/N2H+ ratio and ortho–H2D+
abun-dance) at the same time, but these solutions are not simultaneous between the different layers. We varied the average grain radius and the cosmic ray ionization rate, ζ. We could find solutions for grains of average radius 0.025 to 0.3 µm . No solution has been found for grains above 0.3 µm. Figs. 7 & 8 show the case for which the grain average radius is 0.1 µm and ζ = 2 × 10⁻¹⁷
s−1. In this case, the time range inside which all layers meet the
requested conditions is 0.6 to 1.7 × 10⁵ years. Figure 8 shows
how the ortho/para H2 ratio evolves for 3 selected layers. We
have marked the appropriate time which is the solution for each of these layers as established from Fig. 7. In that figure, we can see that the o/p H2 ratio is below 0.01 for the dense layers and
still above 0.01 for the outer layer for which no H2D+has been
detected, as expected from the steady-state model. We can also see that the full o/p H2relaxation has not yet occurred even for
the densest part of the cloud. Smaller grains have a larger in-teracting surface and therefore lower the abundance of H+ions which preferentially recombine on negatively charged grains (or PAHs−), consequently slowing down the dominant ortho–H2
re-laxation reaction (eq. 29). Though smaller grains also imply a lower electronic density, therefore favouring a higher deutera-tion of N2H+ as shown in Fig. 5, the slower disappearance of
ortho–H2is the dominant process here and finally, smaller grains
slow down the deuteration process. For grains of average radius 0.025 µm, the range of ages matching the range of N2H+/N2D+
observed ratios is 2.7–3.8 × 10⁵ years, while for grains of aver-age radius 0.3 µm, the time range is only 3.8–7.2 × 10⁴ years.
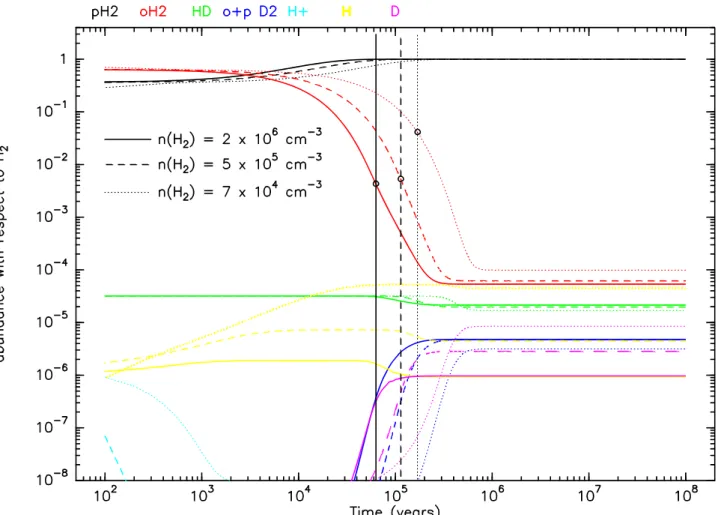
Figure 8 suggests that D2 should become a sizeable fraction of
available deuterium a short while after the present state (typi-cally 2–3 × 10⁵ years) and that HD correspondingly should drop
slightly.
4.3. Age of the core and collapse
Though it is normal that dense layers evolve faster than less dense ones, at least to account for a differential ortho/para H2
ratio, the layers are evolving too fast in our model. The dens-est layers would have reached their present status 2 to 3 times faster than the outer, less dense layers. This could be possible only if the denser layers had reached their steady-state equilib-rium. This is not the case here where the densest layer would reach its steady-state equilibrium only after 2 × 10⁵years and this would imply a N2D+/N2H+ratio of 6, almost an order of
magnitude higher than observed. The most probable reason for this time discrepancy is that the core has undergone a contrac-tion and therefore all layers were not so dense in the past. While the outer layers have only little evolved in density (the most ex-ternal one probably started at 0.5–1 × 104cm−3to reach 7 × 10⁴
cm−3today), the inner ones have undergone a much greater
den-sity increase. As constant denden-sity through the core would give no chemical differentiation while a time-frozen density profile as measured here gives too much differentiation, the solution is in between the two. Starting from a uniform gas, the chemical
Fig. 7. Time-dependent variation of the N2D+/N2H+ratio for the 6 layers defined in Table 2. For each colour, the density of the
layer is given. In the insert, the ortho–H2D+abundance is represented with the same color code, zoomed on the epoch of interest.
Horizontal dotted lines represent the observed N2D+/N2H+ ratio range for each layer and the observed ortho–H2D+abundance as
derived from the Monte Carlo model applied to the JCMT observations. The part of the chemical solution that fits in both these limits and the common time limits is set in bold. Vertical arrows indicate upper limits for the N2D+/N2H+ratio. Vertical dashed
lines are placed at 0.63 and 1.7 × 10⁵years to delimit the period when all layers reach their observed N
2D+enrichment. This case
has been computed for an average grain radius of 0.1 µm and ζ = 2 × 10⁻¹⁷s−1
differential evolution of the core should therefore help us to con-strain the duration of the contraction and the type of contraction. Of course the model should also include the evolution of deple-tion which also plays a role in the acceleradeple-tion of the process.
As the core must have started to contract from a lower den-sity region, typically 104 cm−3, it is clear that all layers have
accelerated their chemical evolution while their density was in-creasing. Therefore, the layer with the longest time to reach the observed N2D+/N2H+ratio gives a lower limit to the age of the
cloud. Depending on the exact average size of the grains, this lower limit is 1.5–2 × 10⁵ years here. It is even larger because
before the cloud underwent contraction, depletion had not yet occured and therefore species like atomic sulfur, S, must have been present in quantities large enough to transfer notable quan-tities of electric charges from H+to S+(H+
+ S → H + S+) and
PAHs must have also been abundant enough to help destroy H+ ions (Wakelam & Herbst 2008). All these phenomena contribute to the diminution of the H+abundance, therefore slowing down
the ortho–H2relaxation process. Indeed, Flower et al. (2006b)
show that the relaxation process in some cases takes 3 × 10⁷
years, typically 50 times slower than in the case presented here (and 15 times slower for similar conditions of grain size and cos-mic ray ionization rate but without depletion in their case).
4.4. Para–D2H+
At 7 K, the strongest possible line intensity (LTE case) for the ground transition of para–D2H+is below 0.3 K because of the
Rayleigh-Jeans correction at 691 GHz which becomes large. Moreover the thermalization of the line is difficult to obtain in this source beyond the radius of 3000 A.U. because the PSC density drops below the para–D2H+critical density (ncrit = 4.9
× 105cm−3) and a slight drop of the excitation temperature turns
into an exponential decrease of the brightness temperature. For Tex= 6 K, Tbright ≤ 0.13 K. Therefore searches for para–D2H+
must reach very low noise levels to have a chance of detection. From the models we present here, we predict an integrated line intensity of 11 mK km/s (34 mK peak) with the Monte Carlo model, and an upper limit of 16 mK km/s (48 mK peak) in the case of LTE. This is a factor of 3 to 4 below the upper limit we obtained from the observations.
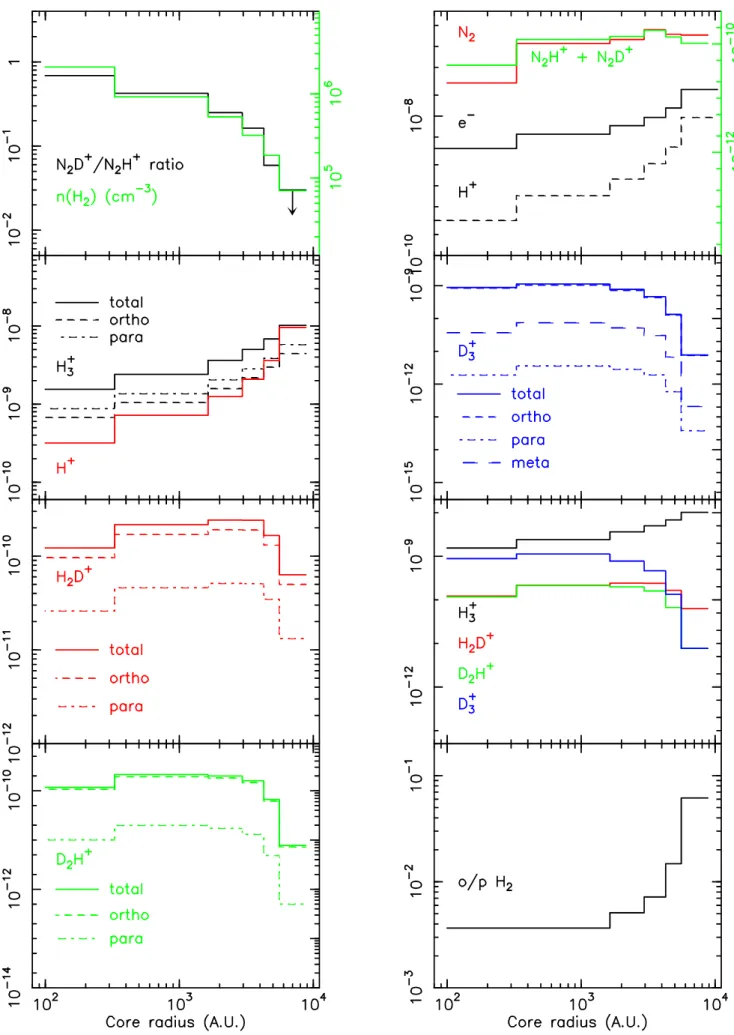
4.5. The chemical profile
Finally, we obtain a detailed profile of the PSC which we present in Fig. 9. It represents the solution for the model we presented in Figs. 7 & 8 taking for each layer the values at their respec-tive best-fit time. The large variation of the ortho–H2 species
Fig. 8. Time-dependent variation of the ortho– and para–H2and other related species for 3 of the 6 layers defined in Table 2 (layers
1, 3 and 6) . Vertical lines are placed at the times corresponding to the observed N2D+/N2H+ratio in Fig. 7 for the same 3 densities.
This case has been computed for an average grain radius of 0.1 µm and ζ = 2 × 10⁻¹⁷s−1
larger amount (2 orders of magnitude) but it does not become the most abundant trihydrogen cation isotopologue in the core center at this stage because the ortho-H2 abundance is not yet
low enough. In the present case, for a density of 2 × 106cm−3, the inversion between H+
3 and D
+
3 occurs when the abundance of
ortho-H2drops below 3 × 10⁻³.
The ortho/para H2ratio in the outer layer is 0.04 (as expected
from Fig. 6 which indicates a lower limit of 0.01). As discussed above, the ortho/para H2ratio evolution speed is linked to
den-sity and grain size, both of which are lower outside the PSC, in its embedding parental cloud. We can thus expect this ratio to be at least 0.05 and probably above 0.1 in the envelope of the cloud. N2 is an input parameter in our model because we have not
included all the nitrogen chemistry. As reactions with H+
3
iso-topologues are the main path to destroy this molecule (Flower et al. 2006b), we do not introduce a large error in determining its abundance directly from the N2H+abundance itself and obtain a
N2profile which is probably closer to reality than if we had let
the whole N-chemistry freely establish its abundance because of too many unknowns. The abundance profile thus starts at 1.5 × 10⁻⁷with respect to H2 in the low density layer to diminish
to 3 × 10⁻⁸in the densest layer. The undepleted N
2 abundance
after attaining the steady state is ∼3 × 10⁻⁵(Flower et al. 2006b)
but this is reached only after ≈ 5 × 10⁶ years. As depletion of
N2in the outer layer is possibly still small, we can conclude that
N2has not yet reached its steady state abundance which puts an
upper limit on the age of the cloud of about 1 × 10⁵years
follow-ing the estimate of Flower et al. (2006b). However, this depends very much upon several factors, for example the C:O elemental abundance ratio. Consequently this information is only indica-tive.
Though our model does not deal with the nitrogen chemistry, it seems to indicate that low abundances of N2 are sufficient to
explain the observed N2H+abundance and therefore, the N2
pletion seems not to be a critical factor as long as CO is also de-pleted. The much debated contradiction between the presence of N2H+in depleted cores while N2should deplete like CO would
thus be a false problem. Low CO and electronic abundances, limiting the destruction rate of N2H+, seem to be sufficient to
compensate for the N2depletion itself to a large extent. Finally,
in the inner core, N2 and N2H+(+ N2D+) follow a similar
de-creasing trend, suggesting that N2 depletion eventually forces
N2H+to decrease.
While ortho–H2D+ is 83 K above the para ground state, it
is more abundant all over the core profile by almost an order of magnitude whereas the thermal equilibrium ratio would be ortho/para H2D+≈ 2 × 10⁻⁵at 7 K. This demonstrates the
ef-ficiency of the ortho–H2 in converting para–H2D+ into ortho–
H2D+and therefore limits the total abundance of H2D+, as the
backward channel to H+
3 remains open even at 7 K. This
or-tho/para population inversion does not occur for D2H+ as the
species needed to perform this inversion is no longer ortho–H2
but the much rarer ortho–D2. Therefore, the para–D2H+remains
Fig. 9. PSC profile for the different species. The n(H2), N2H+abundance, and N2D+/N2H+ ratio profiles are input data. The four
trihydrogen cation isotopologue profiles are also grouped together to visualize their relative total abundances and H+is compared to both e−(upper right box) and to H+
3 (2nd upper left box). The profile has been computed for the case presented in Fig. 7, i.e. ζ
= 2 × 10⁻¹⁷s−1, agr= 0.1 µm. In the two upper boxes, the green curve refers to the green axis on the right. In the top left box, the
with the fact that its ground transition is higher in frequency than the one of ortho–H2D+, makes its detection extremely difficult.
5. Conclusions
We have presented a pair of simple chemical models restricted to H-carriers, He plus CO and N2 to account for the observed
HCO+, DCO+ (not discussed in this paper), N
2H+, and N2D+
ions. We have benefited from new computed reactions rates for both the H+3 + H2 isotopologue combinations and for the H+3
isotopologue dissociative recombination rates which explicitly take into account the nuclear states individually.
With the steady-state model we have shown that the or-tho/para ratio of H2must vary from above 0.01 in the outer parts
of the L183 PSC to less than 0.01 in the inner parts to explain the variation of deuteration across the core. Checking the reality of the ortho/para H2variation with a time-dependent model , we
have also found that if the present PSC density profile is static, then the inner layer would have reached its present status 2 to 3 times faster than the outer layers. Because the present status is not in steady-state, the layers should evolve at a similar rate and therefore the density must have been lower in the past. The most probable explanation is that the core has probably evolved from a uniform density cloud to the present centrally condensed PSC. The time-dependent model also suggests that the ortho/para H2
ratio changes by one order of magnitude from ∼5% at a density of 7 × 104cm−3down to a few × 10−3in the inner dense core.
This has two important consequences :
– it is most probable that most of the cloud, outside the densest regions (i.e. the two PSC and the ridge in between) have an ortho/para H2 ratio also above 5%, and possibly 10%,
con-trarily to what is usually assumed in models.
– In principle, it should be possible to fit the PSC profile with this chemical model combined with a dynamical model in-cluding depletion, to set an age to this PSC and possibly dis-criminate between several types of collapse but it is beyond the scope of this paper.
We already have some indication that the age of the PSC is somewhat above 1.5–2 × 10⁵ years though the N2 abundance
suggests a relatively short time (105years, except if depletion is
compensating for its formation) when we compare our adjusted abundance to the formation rate of N2 given by Flower et al.
(2006b). The low abundance of N2 needed to explain the
ob-served N2H+abundance indicates that its depletion is not a real
problem, though, obviously, N2H+would be much more
abun-dant if N2was not being depleted but CO still was.
Finally, we stress the importance of considering or-tho/meta/para chemistry when dealing with the deuteration of the interstellar medium. The importance of the ortho–H2 on
the amount of deuteration and the observations limited to only ortho–H2D+make this inclusion compulsory. Moreover, a
com-plete state-to-state chemical model should be developed to take into account rotational pumping, leading to a higher destruction rate of the deuterated trihydrogen cation and possibly explaining the observed linewidth of ortho–H2D+.
Detecting para–D2H+would be highly desirable to help
con-strain the models, but the high frequency and limited trans-parency of the atmosphere make it a difficult tool to use. Though observable from the ground, because of its weakness in cold dark clouds, which are the only places where it should be found, di-rect para–D2H+observations should be made on a large number
of Galactic lines of sight using the HIFI receiver on board the Heschel Space Observatory.
Acknowledgements. We would like to thank D. Flower, G. Pineau des Forˆets,
M. Walmsley, S. Cazaux and V. Wakelam for fruitful discussions and an anony-mous referee for her/his careful reading. Part of this work was supported by the National Science Foundation (NSF) grant AST 05-40882 to the CSO. The au-thors are grateful to the CSO and JCMT staffs for their support at the telescopes. We would like to thank Samantha Santos for the help provided in numerical calculations of thermal DR rate coefficients. This work has been supported by the NSF under Grants No. PHY-0427460 and PHY-0427376, by an allocation of NERSC and NCSA (project # PHY-040022) supercomputing resources. This work has benefited from research funding from the European Community’s Sixth Framework Programme under RadioNet contract R113CT 2003 5158187
References
Adams, N. G., Smith, D., & Alge, E. 1984, J. Chem. Phys., 81, 1778 Aikawa, Y., Herbst, E., Roberts, H., & Caselli, P. 2005, ApJ, 620, 330 Alves, J., Lada, C.J., & Lada, E.A. 1999, ApJ, 515, 265
Amano, T., & Hirao, T. 2005, J. Mol. Spectroscopy, 233, 7 Bacmann, A., Lefloch, B., Ceccarelli, C., et al. 2002, A&A, 389, L6 Bates, D. R., Guest, M. F., Kendall, R. A. 1993, Planet. Space Sci., 41, 9 Bergin, E. A., Ciardi D. R., Lada, C. J., Alves, J., Lada, E. A. 2001, ApJ, 557,
209
Bergin, E. A., Alves, J., Huard, T., Lada, C. J. 2002, ApJ, 570, L101 Bernes, C. 1979, A&A, 73, 67
Bisschop, S. E., Fraser, H. J., ¨Oberg, K. I., van Dishoeck, E. F., Schlemmer, S. 2006, A&A, 449, 1297
Bunker, P. & Jensen, P. 1998, Molecular Symmetry and Spectroscopy (NRC Research Press)
Caselli, P., Walmsley, C. M., Tafalla, M., Dore, L., Myers, P. C. 1999, ApJ, 523, L165
Caselli, P. 2002, Planet. Space Sci., 50, 1133
Caselli, P., van der Tak, F. F. S., Ceccarelli, C., Bacmann, A. 2003, A&A403, 37 Caselli, P., Vastel, C., Ceccarelli, C., et al. 2008, A&A, in press
Cazaux, S., Caselli, P., Cobut, V., Le Bourlot, J. 2008, A&A, 483, 495 Chang, E. S. & Fano, U. 1972, Phys. Rev. A, 6, 173
Chang, Q., Cuppen, H. M., Herbst, E. 2006, A&A, 458, 497
Datz, S., Larsson, M., Stromholm, C., et al. 1995, Phys. Rev. A, 52, 2901 Datz, S., Sundstr¨om, G., Biedermann, Ch., et al.,1995, Phys. Rev. Lett., 74, 896 Draine, B. T. & Sutin, B. 1987, ApJ, 320, 803
Flower, D. R., Pineau des Forˆets, G., Walmsley, C. M. 2004, A&A, 427, 887, FPdFW
Flower, D. R., Pineau des Forˆets, G., Walmsley, C. M. 2006a, A&A, 449, 621, FPdFW
Flower, D. R., Pineau des Forˆets, G., Walmsley, C. M. 2006b, A&A, 456, 215, FPdFW
Fonseca dos Santos, S., Kokoouline, V., Greene, C. H. 2007, J. Chem. Phys., 127, 124309
Geppert, W. D., Thomas, R., Semaniak, J., et al. 2004, ApJ, 609, 459 Gerlich, D. 1990, J. Chem. Phys., 92, 2377
Harju, J., Juvela, M., Schlemmer, S., et al. 2008, A&A, 482, 535
Hily-Blant, P., Walmsley, M., Pineau des Forˆets, G., Flower, D. 2008, A&A480, L5
Kokoouline, V., Greene, C. H., Esry, B. D. 2001, Nature, 412, 891 Kokoouline, V. & Greene, C. H. 2003a, Phys. Rev. Lett., 90, 133201 Kokoouline, V. & Greene, C. H. 2003b, Phys. Rev. A, 68, 012703 Kokoouline, V. & Greene, C. H. 2004, Faraday Discuss., 127, 413 Kokoouline, V. & Greene, C. H. 2005, Phys. Rev. A, 72, 022712 Kramer, C., Alves, J., Lada, C. J., et al. 1999, A&A, 342, 257
Kreckel, H., Motsch, M., Mikosch, J., et al. 2005, Phys. Rev. Lett., 95, 263201 Landau, L. & Lifshitz, E. 2003, Quantum Mechanics: Non-relativistic Theory
(Burlington MA: Butterworth Heinemann)
Larsson, M., Danared, H., Larson, Å., et al. 1997, Phys. Rev. Lett., 79, 395 Linsky, J. L. 2007, Space Sci. Rev., 130, 367
Lipshtat A., Biham O., Herbst E. 2004, MNRAS, 348, 1055 Lis, D. C., Roueff, E., Gerin, M., et al. 2002, ApJ, 571, L55 Maret, S. & Bergin, E. A. 2007, ApJ, 664, 956
Mistrik, I., Reichle, R., Helm, H., Muller, U. 2001, Phys. Rev. A, 63
Molek, C. D., McLain, J. L., Poterya, V., Adams, N. G. 2007, J. Phys. Chem. A,111, 6760
¨
Oberg, K. I., van Broekhuizen, F., Fraser, H. J., et al. 2005, ApJ, 621, L33 Oka, T. 2004, J. Mol. Spectrosc., 228, 635
Pagani, L., Salez, M., Wannier, P.G. 1992, A&A, 258, 479
Pagani, L., Pardo, J.-R., Fich, M., Motte, F., Stepnik, B. 2002, in “Infrared and Submillimeter Space Astronomy”, EAS Series, Vol. 4, Giard M. et al., eds, held in Toulouse, June 2001, EdP Sciences, Les Ulis, p.145
Pagani, L., Lagache, G., Bacmann, A., et al. 2003, A&A, 406, L59 Pagani, L., Bacmann, A., Motte, F., et al. 2004, A&A, 417, 605