HAL Id: hal-01883418
https://hal.uca.fr/hal-01883418
Submitted on 29 Oct 2018
HAL is a multi-disciplinary open access
archive for the deposit and dissemination of
sci-entific research documents, whether they are
pub-lished or not. The documents may come from
teaching and research institutions in France or
abroad, or from public or private research centers.
L’archive ouverte pluridisciplinaire HAL, est
destinée au dépôt et à la diffusion de documents
scientifiques de niveau recherche, publiés ou non,
émanant des établissements d’enseignement et de
recherche français ou étrangers, des laboratoires
publics ou privés.
Ashesh Shah, Fabiola Alonso, Dorian Vogel, Karin Wårdell, Jerome Coste,
Jean-Jacques Lemaire, Daniela Pison, Simone Hemm
To cite this version:
Ashesh Shah, Fabiola Alonso, Dorian Vogel, Karin Wårdell, Jerome Coste, et al.. Analysis of
ad-verse effects of stimulation during DBS surgery by patient-specific FEM simulations. 40th Annual
International Conference of the IEEE Engineering in Medicine and Biology Society, Engineering
in Medicine and Biology Society (IEEE-EMBS), Jul 2018, Honolulu, United States. pp.2222-2225,
�10.1109/EMBC.2018.8512796�. �hal-01883418�
Analysis of adverse effects of stimulation during DBS surgery by
patient-specific FEM simulations
Ashesh A. Shah, Fabiola Alonso, Dorian Vogel, Karin Wårdell, Jérôme Coste, Jean-Jacques Lemaire, Daniela Pison and Simone Hemm
Authors affiliations
A. Shah is with Institute for Medical and Analytical Technologies, School of Life Sciences, University of Applied Sciences and Arts Northwestern Switzerland FHNW, Muttenz, Switzerland (email: ashesh.shah@fhnw.ch; phone: +41 61 228 56 89)
F. Alonso is with Department of Biomedical Engineering, Linköping University, Linköping, Sweden (email: fabiola.alonso@liu.se) D. Vogel is with Institute for Medical and Analytical Technologies, School of Life Sciences, University of Applied Sciences and Arts Northwestern Switzerland FHNW, Muttenz, Switzerland and Department of Biomedical Engineering, Linköping University, Linköping, Sweden (email: dorian.vogel@fhnw.ch)
K. Wardell is with Department of Biomedical Engineering, Linköping University, Linköping, Sweden (email: karin.wardell@liu.se) J. Coste is with the Université Clermont Auvergne, CNRS, Institut Pascal, UMR 6602, Image Guided Therapies (IGT), Image Guided Clinical Neurosciences and Connectomics (IGCNC), Clermont-Ferrand, France, and Service de Neurochirurgie, Hôpital Gabriel-Montpied, Centre Hospitalier Universitaire de Clermont-Ferrand, Clermont-Ferrand, France (email: jerome.coste@uca.fr)
J.J. Lemaire is with the Université Clermont Auvergne, CNRS, Institut Pascal, UMR 6602, Image Guided Therapies (IGT), Image Guided Clinical Neurosciences and Connectomics (IGCNC), Clermont-Ferrand, France and Service de Neurochirurgie, Hôpital Gabriel-Montpied, Centre Hospitalier Universitaire de Clermont-Ferrand, Clermont-Ferrand, France (email: jjlemaire@chu-clermontferrand.fr) D. Pison was with Institute for Medical and Analytical Technologies, School of Life Sciences, University of Applied Sciences and Arts Northwestern Switzerland FHNW, Muttenz, Switzerland (email: danielapison@yahoo.it)
S. Hemm is with Institute for Medical and Analytical Technologies, School of Life Sciences, University of Applied Sciences and Arts Northwestern Switzerland FHNW, Muttenz, Switzerland and Department of Biomedical Engineering, Linköping University, Linköping, Sweden (email:
simone.hemm@fhnw.ch)
Abstract— Deep brain stimulation (DBS) represents today a well-established treatment for movement disorders. Nevertheless the exact mechanism of action of DBS remains incompletely known. During surgery, numerous stimulation tests are frequently performed in order to evaluate therapeutic and adverse effects before choosing the optimal implantation site for the DBS lead. Anatomical structures responsible for the induced adverse effects have been investigated previously, but only based on stimulation data obtained with the implanted DBS lead. The present study introduces a methodology to identify these anatomical structures during intraoperative stimulation tests based on patient-specific electric field simulations and visualization on the patient specific anatomy. The application to 4 patients undergoing DBS surgery and presenting dysarthria, paresthesia or pyramidal effects shows the different anatomical structures, which might be responsible for the adverse effects. Several of the identified structures have been previously described in the literature. To draw any statistically significant conclusions, the methodology has to be applied to further patients. Together with the visualization of the therapeutic effects, this new approach could assist the neurosurgeons in the future in choosing the optimal implant position.
I. INTRODUCTION
DBS represents today a well-established therapy for the symptomatic treatment of movement disorders such as Parkinson’s disease (PD) and essential tremor (ET) but as well for other diseases. Electrodes are implanted in the brain through which the surrounding structures are continuously stimulated. Before surgery, the brain target is chosen and the trajectory to reach it is planned on magnetic resonance images (MRI). During surgery, many centers perform microelectrode recording (MER) and stimulation tests on predefined positions on one or more parallel trajectories. Evaluations of therapeutic effects and adverse events are performed at these sites based on which the optimal stimulation position is chosen [1]. Despite the success of the therapy, the mechanism(s) of action of DBS [2] and the exact structures or structure parts responsible for the therapeutic effect and certain adverse effects remain incompletely known. The aim of the present paper is to present a methodology to analyze the anatomical structures involved in inducing side effects during intraoperative stimulation tests based on patient-specific electric field simulations and visualization on the patient specific anatomy. The new approach is applied to intraoperatively obtained data in one clinical center in Clermont-Ferrand, France.
II. METHOD
A. Surgical procedure
At Clermont-Ferrand University hospital, the surgical procedure is defined as follows [3]: an extensive preoperative surgical planning is performed. Stereotactic CT, T1 MRI and white-matter attenuation inversion recovery sequences (WAIR) are acquired (Sonata 1.5T, Siemens, Germany). The different thalamic nuclei and the basal ganglia are then outlined by the neurosurgeon using a commercial planning software (iPlan stereotaxy 3.0, Brainlab, Munich, Germany) based on the spontaneous contrast of the WAIR sequence and with an in-house developed 4.7T brain atlas (Fig. 1). Based on these outlined structures, an anatomical target e.g. the ventral intermediate nucleus (VIM) for ET patients and an entry point are carefully chosen. Two parallel trajectories and positions for neuronal recording and stimulation tests are carefully identified within the volume of interest for the intraoperative testing. During surgery, MER is first performed followed by stimulation tests at the predefined positions. During stimulation tests the stimulation amplitude is increased from 0 to 3 mA in 0.2 mA steps and the symptom improvement is estimated. In addition, amplitudes and the kind of adverse effect are noted. The final implantation position of the DBS electrode is chosen where 1) the stimulation amplitude inducing significant therapeutic effects is very low; 2) therapeutically effective stimulation amplitudes at the neighboring positions are relatively low; 3) no adverse events are present or only at high stimulation amplitudes; 4) anatomical position is suitable.
FIGURE 1. Example of outlined structures in the target area presented in 3D. AL: nucleus anterolateral; InL: nucleus intermedio lateral; VCL: nucleus ventrocaudal lateral; DL: nucleus dorsolateral; PU: pulvinar; VO: nucleus ventro-oral; FF: field of Forel; CM: nucleus centromedian; VCM: nucleus ventrocaudal medial; PLR: prelemniscal radiations. VIM: ventral intermediate nucleus
B. Electric field simulations
To evaluate the spatial distribution of the stimulation, FEM simulations were performed as previously presented for implanted DBS leads [4]. In the present study, this simulation approach was adapted to the intraoperatively used electrode and electrical setup. An electrode model of the microelectrode (Neuroprobe, Alpha Omega Engineering, Nazareth, Israel) was generated. Like in clinical practice, two electrode models were positioned in parallel at a distance of 2 mm. The leading guide tubes were fixed 12 mm above the target. Patientspecific brain models were generated in the target area based on the patients’ T1 MRI which was enhanced in the basal ganglia and thalamic area. Image voxels were classified into cerebrospinal fluid (CSF), gray matter and white matter and conductivity values were assigned to each voxel [5]: CSF - 2.0 Siemens/meter (S/m), blood - 0.7 S/m, gray matter 0.123 S/m and white matter 0.075 S/m. Between the selected thresholds, conductivity values were interpolated [4].
The electric field (EF) was calculated by using the equation of continuity for steady currents according to:
V
where is a matrix composed of the electrical conductivity values and V the electric potential. For each simulation, the electrodes were positioned at the clinically used electrode position. The active electrode contact was set to the clinically applied stimulation current while the non-active contact of the parallel lead was set to floating potential. The guide tube was set to ground and the boundariesof the tissue model to electrical insulation. The mesh density was set to about 250,000 tetrahedral elements using the in-built mesh generator (Comsol Multiphysics AB, Sweden), the smallest elements located close to the stimulating contacts to capture the strong EF gradients. For the points defining the surface of the simulated volume, the Cartesian coordinates were exported for further analysis. To perform relative comparisons between the simulations, the EF isolevel was fixed at 0.2 V/mm as this magnitude is required to stimulate neurons with axons of around 3-4 µm in diameter with a pulse width between 60 to 90 µs [6, 7].
C. Anatomical data extraction
In order to be able to visualize the simulated electric field distributions on the patient-specific anatomy, a specifically designed interface based on VVLink and VTK (VTK 5.2.0, Kitware Inc. New York, USA) was used to extract the manually outlined anatomical structures from the stereotactic planning software [8]. To reduce error sources, to increase resolution and to remain in the same image coordinate reference system as the CT images, the outlined anatomical structures were exported in the CT reference space parallel to the CT images. Each anatomical structure was converted from slices to tabular list and saved as csv files (Matlab scripts).
D. Clinical Application
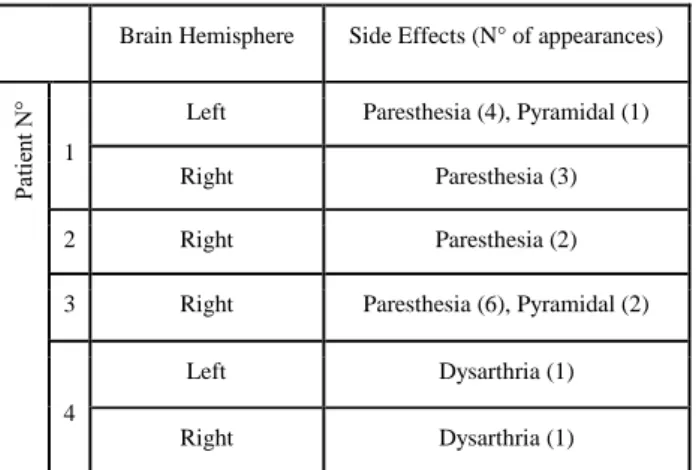
Four patients with ET, treated by bilateral DBS and presenting adverse effects during intraoperative stimulation tests were included in the current work (part of clinical study undertaken at the University Hospital; Ref: 2011-A0077437/AU905, Comité de Protection des Personnes Sud-Est 6, Clermont-Ferrand, France). Trajectories towards the VIM vary from patient to patient due to the planning and individual anatomical differences but follow the path from the superioranterior-lateral thalamus (ventro-oral nucleus, VO) towards the inferior-posterior-medial direction passing the VIM with the target at its inferior border. For each implantation, the stimulation test positions inducing adverse effects were identified. EF simulations were performed with the current amplitudes inducing the adverse effect. Three different types of adverse effects were observed: dysarthria (speech disturbances), paresthesia (abnormal sensations) and pyramidal effects (motor contractions mostly of the contralateral face and upper limb). Details of the implantations with adverse effects are presented in Table 1.
E. Data Processing and Analysis
The data generated through clinical application were processed for one implantation at a time. Using Matlab, the EF simulations for adverse effects were reconstructed as volumes. Union operations were applied when several domains were overlapping. For the visualization of the threshold on the patient-specific images the following data were imported in Paraview (Kitware) using Python (Python.org) scripts: 1) T1 MR and the WAIR MR image data sets, cropped to the region of interest; 2) csv files containing the coordinates of the thalamic nuclei and visualized as surface extracts of Delaunay triangulation of these coordinates; 3) adverse effect thresholds, visualized to depict them as boundary beyond which side effects were observed. The data were first visualized in 3D and then in orthographic slice view using a custom macro script.
The generated adverse effect maps were visually analyzed in axial, coronal and sagittal sections across all the visualized data for one implantation simultaneously in the orthographic slice view. For each side effect, the structures just at the limits and beyond the adverse effect outline were noted together with the kind of side effect and listed in a table.
TABLE I. Details of the surgeries for the patients participating in the clinical study.
Brain Hemisphere Side Effects (N° of appearances)
1
Left Paresthesia (4), Pyramidal (1) Right Paresthesia (3) 2 Right Paresthesia (2) 3 Right Paresthesia (6), Pyramidal (2)
4
Left Dysarthria (1)
III. RESULTS
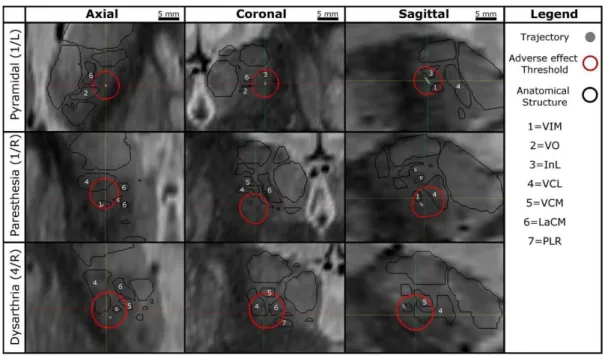
The routine surgical procedure was not altered by application of this method in any way as the data was analyzed post-operatively. Adverse effect maps were analyzed for all six implantations. Table II lists the anatomical structures directly outside the adverse effect threshold outlines for the different types of adverse effects. Adverse effects induced due to stimulation of the pyramidal tract were observed during two implantations. The corresponding maps showed that the adverse effect outlines run through the internal capsula (Fig. 2, first row; Table II). Paresthesia was observed in three implantations. The adverse effect outlines in these maps were posterior to the VIM and penetrated the VCM, VCL and LaCM nuclei. In most cases, the outline was also inferior to the VIM, entering the posterior subthalamic area (Fig. 2, second row; Table II). For the right hemisphere of patient 4, on the posterior trajectory at the target position dysarthria was observed. From the axial and sagittal images, it could be observed that this outline penetrated the VCL, VCM and the LaCM nuclei of the thalamus (Fig. 2, third row; Table II). Stimulation tests in the left hemisphere of patient 4 also induced dysarthria at one position, and the adverse effect threshold outline was observed in a similar thalamic region.
TABLE II. Thalamic nuclei penetrated by the different adverse effect threshold outlines
Side-Effect
Pyramidal
effect Parasthesia Dysarthr. Pat/Hemisph. 1/L 3/R 1/L 1/R 2/R 3/R 4/L 4/R INL X VO X X X VIM X PLR X X X VCL X X X X VCM X X X X LaCM X X X X IC* X X
* Internal Capsule (IC) is not outlined during the planning, but is distinguishable based on spontaneous MR contrast. Lt: left; Rt: right; For structure names see Fig. 1.
FIGURE 2. Example of Orthogonal sections across the electric field simulation for the different stimulation induced side effects. First row: Pyramidal effects, left hemisphere patient 1 - The internal capsule including the pyramidal tract can be see as dark region at the at the edge of the thalamus (bright). Second row: Paresthesia effects, right hemisphere, patient 1 - VCL, VCM and LaCM nuclei may be involved. Third row: Dysarthria effect, right hemisphere, patient 4 - VCL, VCM, LaCM and the PLR might be involved.
IV. DISCUSSION
This paper describes a new digital approach to assist clinicians in identifying the adverse effect region based on data acquired during intraoperative stimulation tests. In addition to learning more about the regions responsible for the different adverse effects, the combination of this information with the therapeutically effective regions would support the neurosurgeon in choosing the optimal implantation position. To the best of our knowledge, commercial software solutions for DBS do not offer visualization capabilities for intraoperative stimulation tests today. D'Haese et al. [9] developed a system visualizing therapeutic and adverse effects of stimulation in form of spherical balls without simulations. Miocinovic [10] proposes a software tool, Cicerone, estimating and visualizing the spatial distribution of stimulation for adverse effects. It visualizes patient images with brain atlas, MER, DBS leads and the volume of tissue activated (VTA) in three dimensions and can be used intraoperatively. However, the estimation of VTA is not patient specific and is based only on the model of the DBS lead. In contrast to the existing literature, the approach described in the present paper was specifically designed for intraoperative use. It benefits from patient-specific electric field simulations to estimate the spatial effects of stimulation. Other groups tried as well to identify the structures linked to the occurrence of side effects. Baumgarten [11] introduced a method based on Artificial Neural networks to predict pyramidal tract side effects for postoperative programming of the DBS lead and showed that it was more effective than the calculation of the VTA based on simulations considering homogenous tissue. No comparison with patient-specific electric field simulations is available so far despite the fact that EF has been shown to be the most stable and unchanged entity for different stimulation parameters (amplitude and pulse width) [6]. We [12] have previously successfully applied the same patient-specific electric field simulations to visualize the extent of stimulation but to DBS leads and on atlases but not with patient-specific anatomical data. No study has so far used simulations for intraoperative exploration electrodes.
The structures identified behind the outline of adverse effect thresholds presented in the present paper in different maps concur with the findings of other researchers. Adverse effects associated with the stimulation of the pyramidal tract were only observed when the threshold outline was very close to the internal capsula supero-lateral to the thalamus. DowseyLimousin reported similar effects during post-operative programming of the implanted pulse generator [13]. Dysarthria could be associated with the area posterior to the VIM where the VCL, VCM and the LaCM nuclei are located. Similar results were also observed by Reker’s group [14] using post-operative stimulation tests. Paresthesia was observed for patients 1, 2 and 3. Few studies have associated paresthesia with the stimulation of medial lemniscal fibers that provide input to the VCM and VCL nuclei [15, 16] and to the zona incerta (ZI, [17]). The adverse effect outline in the adverse effect maps concur with results suggesting involvement of medial lemniscal fibers. To draw any statistically significant conclusions, these results have to be confirmed by the application of the method to further patients.
V. CONCLUSION
The current work presents a new approach how to identify anatomical regions that might be responsible for inducing adverse effects. Together with the visualization of the therapeutic effects, it could assist the neurosurgeons in the future in choosing the optimal implant position.
ACKNOWLEDGMENT
The authors thank for the financial support of this research by the Swiss National Science Foundation (CR3212_153370), the Germaine de Staël program of the Swiss Academy of Engineering Sciences, the French Ministry of Health (2011A00774-37), the Swedish Research Council (2016-03564) and Swedish Foundation for Strategic Research (BD15-0032).
REFERENCES
[1] S. Hemm and K. Wårdell, "Stereotactic implantation of deep brain stimulation electrodes: a review of technical systems, methods and emerging tools," Med Biol Eng Comput, vol. 48, pp. 611-24, Jul 2010.
[2] T. M. Herrington, J. J. Cheng, and E. N. Eskandar, "Mechanisms of deep brain stimulation," J Neurophysiol, vol. 115, pp. 19-38, 2015.
[3] F. Vassal, J. Coste, P. Derost, V. Mendes, J. Gabrillargues, C. Nuti, et al., "Direct stereotactic targeting of the ventrointermediate nucleus of the thalamus based on anatomic 1.5-T MRI mapping with a white matter attenuated inversion recovery (WAIR) sequence," Brain Stimul, vol. 5, pp. 625-33, Oct 2012.
[4] K. Wårdell, Z. Kefalopoulou, E. Diczfalusy, M. Andersson, M. Astrom, P. Limousin, et al., "Deep brain stimulation of the pallidum internum for gilles de la tourette syndrome: a patient-specific model-based simulation study of the electric field," Neuromodulation, vol. 18, pp. 906, Feb 2015. [5] F. Alonso, M. Latorre, N. Göransson, P. Zsigmond, and K. Wårdell "Investigation into Deep Brain Stimulation Lead Designs: A PatientSpecific
Simulation Study," Brain Sci, vol. 6, 2016.
[6] M. Åström, E. Diczfalusy, H. Martens, and K. Wårdell, "Relationship between Neural Activation and Electric Field Distribution during Deep Brain Stimulation," IEEE Trans Biomed Eng, vol. 62, pp. 664-72, 2015.
[7] A. M. Kuncel, S. E. Cooper, and W. M. Grill, "A method to estimate the spatial extent of activation in thalamic deep brain stimulation," Clin Neurophysiol, vol. 119, pp. 2148-58, Sep 2008.
[8] S. Hemm-Ode, D. Pison, F. Alonso, A. Shah, J. Coste, J.-J. Lemaire, et al., "Patient-specific electric field simulations and acceleration measurements for objective analysis of intraoperative stimulation tests in the thalamus," Frontiers in Human Neuroscience, vol. 10, 2016.
[9] P. F. D'Haese, S. Pallavaram, R. Li, M. S. Remple, C. Kao, J. S. Neimat, et al., "CranialVault and its CRAVE tools: a clinical computer assistance system for deep brain stimulation (DBS) therapy," Med Image Anal, vol. 16, pp. 744-53, Apr 2012.
[10] S. Miocinovic, A. M. Noecker, C. B. Maks, C. R. Butson, and C. C. McIntyre, "Cicerone: stereotactic neurophysiological recording and deep brain stimulation electrode placement software system," Acta Neurochir Suppl, vol. 97, pp. 561-7, 2007.
[11] C. Baumgarten, Y. Zhao, P. Sauleau, C. Malrain, P. Jannin, and C. Haegelen, "Improvement of Pyramidal Tract Side Effect Prediction Using a Data-Driven Method in Subthalamic Stimulation," IEEE Trans Biomed Eng, vol. 64, pp. 2134-2141, Sep 2017.
[12] M. Åström, E. Tripoliti, M. I. Hariz, L. U. Zrinzo, I. Martinez-Torres, P. Limousin, et al., "Patient-specific model-based investigation of speech intelligibility and movement during deep brain stimulation," Stereotact Funct Neurosurg, vol. 88, pp. 224-33, 2010.
[13] P. Dowsey-Limousin, "Postoperative Management of Vim DBS for Tremor," Mov Disord, vol. 17, pp. S208-11, 2002.
[14] P. Reker, T. A. Dembek, J. Becker, V. Visser-Vandewalle, and L. Timmermann, "Directional deep brain stimulation: A case of avoiding dysarthria with bipolar directional current steering," Parkinsonism Relat Disord, vol. 31, pp. 156-158, Oct 2016.
[15] P. Krack, V. Fraix, A. Mendes, A. Benabid, and P. Pollak, "Postoperative Management of Subthalamic Nucleus Stimulation for Parkinson's Disease," Mov Disord vol. 17, pp. S188-97, 2002.
[16] F. Tamma, E. Caputo, V. Chiesa, M. Egidi, M. Locatelli, P. Rampini, et al., "Anatomo-clinical correlation of intraoperative stimulation-induced side-effects during HF-DBS of the subthalamic nucleus," Neurol Sci, vol. 23 Suppl 2, pp. S109-10, Sep 2002.
[17] T. A. Dembek, M. T. Barbe, M. Astrom, M. Hoevels, V. VisserVandewalle, G. R. Fink, et al., "Probabilistic mapping of deep brain stimulation effects in essential tremor," Neuroimage Clin, vol. 13, pp.