HAL Id: hal-01789705
https://hal.archives-ouvertes.fr/hal-01789705
Submitted on 11 May 2018
HAL is a multi-disciplinary open access
archive for the deposit and dissemination of
sci-entific research documents, whether they are
pub-lished or not. The documents may come from
teaching and research institutions in France or
abroad, or from public or private research centers.
L’archive ouverte pluridisciplinaire HAL, est
destinée au dépôt et à la diffusion de documents
scientifiques de niveau recherche, publiés ou non,
émanant des établissements d’enseignement et de
recherche français ou étrangers, des laboratoires
publics ou privés.
Extremely Red Quasars in BOSS
Fred Hamann, Nadia L. Zakamska, Nicholas Ross, Isabelle Paris, Rachael M.
Alexandroff, Carolin Villforth, Gordon T. Richards, Hanna Herbst, W. Niel
Brandt, Ben Cook, et al.
To cite this version:
Fred Hamann, Nadia L. Zakamska, Nicholas Ross, Isabelle Paris, Rachael M. Alexandroff, et al..
Ex-tremely Red Quasars in BOSS. Monthly Notices of the Royal Astronomical Society, Oxford University
Press (OUP): Policy P - Oxford Open Option A, 2017, 000 (3), pp.1 - 32. �10.1093/mnras/stw2387�.
�hal-01789705�
Extremely Red Quasars in BOSS
Fred Hamann
1,2?, Nadia L. Zakamska
3,4, Nicholas Ross
5, Isabelle Paris
6,
Rachael M. Alexandroff
3, Carolin Villforth
7, Gordon T. Richards
8, Hanna Herbst
2,
W. Niel Brandt
9,10,11, Ben Cook
12, Kelly D. Denney
13, Jenny E. Greene
14,
Donald P. Schneider
9,15, Michael A. Strauss
141 Department of Physics & Astronomy, University of California, Riverside, CA 92507, USA 2 Department of Astronomy, University of Florida, Gainesville, FL 32611, USA
3 Department of Physics & Astronomy, Johns Hopkins University, 3400 N. Charles St, Baltimore, MD 21218, USA
4 Deborah Lunder & Alan Ezekowitz Founders’ Circle Member, Institute for Advanced Study, Einstein Dr., Princeton, NJ 08540, USA 5 Institute for Astronomy, SUPA, University of Edinburgh, Royal Observatory, Edinburgh EH9 3HJ, UK
6 INAF Osservatorio Astronomico di Trieste, Via G. B. Tiepolo 11, I-34131 Trieste, Italy 7 Department of Physics, University of Bath, Claverton Down, Bath, BA2 7AY, United Kingdom 8 Department of Physics, Drexel University, 3141 Chestnut Street, Philadelphia, PA 19104, USA
9 Department of Astronomy & Astrophysics, The Pennsylvania State University, University Park, PA 16802, USA 10Institute for Gravitation and the Cosmos, Pennsylvania State University, University Park, PA 16802, USA 11Department of Physics, Pennsylvania State University, University Park, PA 16802, USA
12Harvard-Smithsonian Center for Astrophysics, 60 Garden Street, Cambridge, MA 02138, USA
13Department of Astronomy, The Ohio State University, McPherson Laboratory, 140 West 18th Avenue Columbus OH, 43210, USA 14Department of Astrophysical Sciences, Princeton University, Princeton, NJ 08544, USA
15Institute for Gravitation & the Cosmos, The Pennsylvania State University, University Park, PA 16802, USA
Accepted XXX. Received YYY; in original form ZZZ
ABSTRACT
Red quasars are candidate young objects in an early transition stage of massive galaxy evolution. Our team recently discovered a population of extremely red quasars (ERQs) in the Baryon Oscillation Spectroscopic Survey (BOSS) that has a suite of peculiar emission-line properties including large rest equivalent widths (REWs), unusual “wing-less” line profiles, large N v/Lyα, N v/C iv, Si iv/C iv and other flux ratios, and very broad and blueshifted [O iii] λ5007. Here we present a new catalog of C iv and N v emission-line data for 216,188 BOSS quasars to characterize the ERQ line properties further. We show that they depend sharply on UV-to-mid-IR color, secondarily on REW(C iv), and not at all on luminosity or the Baldwin Effect. We identify a “core” sample of 97 ERQs with nearly uniform peculiar properties selected via i–W 3 ≥ 4.6 (AB) and REW(C iv) ≥ 100 ˚A at redshifts 2.0–3.4. A broader search finds 235 more red quasars with similar unusual characteristics. The core ERQs have median luminos-ity hlog L(ergs/s)i ∼ 47.1, sky densluminos-ity 0.010 deg−2, surprisingly flat/blue UV spectra given their red UV-to-mid-IR colors, and common outflow signatures including BALs or BAL-like features and large C iv emission-line blueshifts. Their SEDs and line prop-erties are inconsistent with normal quasars behind a dust reddening screen. We argue that the core ERQs are a unique obscured quasar population with extreme physical conditions related to powerful outflows across the line-forming regions. Patchy ob-scuration by small dusty clouds could produce the observed UV extinctions without substantial UV reddening.
Key words: galaxies: active — quasars: general — quasars: emission lines — quasars: absorption lines
? E-mail: [email protected] (FH)
1 INTRODUCTION
Quasars are signposts of rapid accretion onto supermassive black holes (SMBHs) in the centers of galaxies. The observed
present-day correlation between the masses of SMBHs and their surrounding galactic spheroids suggests that SMBH ac-cretion/growth is intimately connected to star formation and
mass assembly in the host galaxies (Gebhardt et al. 2000;
Tremaine et al. 2002; H¨aring & Rix 2004; G¨ultekin et al. 2009;Shankar et al. 2009;Kormendy & Ho 2013). The simi-lar redshift peaks in the space density of quasars and the cos-mic star formation rate at z ∼ 2–3 indicate that these phe-nomena occurred together, perhaps in a physically-related
way, at early cosmic times (Boyle & Terlevich 1998;Merloni
et al. 2004; Marconi et al. 2004; Wall et al. 2005; Silver-man et al. 2005;Richards et al. 2006;Rudnick et al. 2006). Popular models of galaxy evolution describe major episodes of SMBHs growth occurring in obscurity, deep inside dusty starbursts that appear observationally as sub-mm galaxies (SMGs) or ultra-luminous infrared galaxies (ULIRGs, e.g., Sanders et al. 1988;Hopkins et al. 2005,2008;Veilleux et al. 2009; Simpson et al. 2014). Visibly luminous quasars are thought to appear near the end of this evolution when the SMBHs are massive enough to power quasars and a major blowout of gas and dust unveils the bright central source. “Feedback” from quasar outflows during this evolution stage might play a role in driving the blowouts and regulating
star formation in the host galaxies (see alsoDi Matteo et al.
2005;Hopkins et al. 2005;Hopkins & Elvis 2010;Rupke & Veilleux 2011,2013;Liu et al. 2013;Wagner et al. 2013).
Quasars that are obscured and reddened by dust can provide important tests of this evolution scheme if they ap-pear preferentially during the brief transition phase from
dusty starburst to normal blue quasar (e.g.,Hopkins et al.
2005;Urrutia et al. 2008;Glikman et al. 2012,2015;Wu et al. 2014;Banerji et al. 2015;Assef et al. 2015). However, other explanations for quasar reddening and obscuration are also possible. The Unified Model of AGN attributes the observed differences between Type 1 (broad line) and Type 2 (narrow line) AGN to orientation effects associated with an axisym-metric dusty torus that resides near the central engine of
all AGN (Antonucci 1993; Urry & Padovani 1995; Netzer
2015). In this scenario, Type 1 AGN offer direct views of
the central engine and broad emission line regions while in Type 2s these regions are heavily obscured due to our nearly edge-on view of the torus/accretion disk geometry. Interme-diate orientations might produce intermeInterme-diate amounts of obscuration such that we observe Type 1 quasars with red colors and perhaps a wavelength-dependent mix of Type 1
and Type 2 properties (Greene et al. 2014). In this context,
red quasars provide valuable tests of the geometry and phys-ical structure of quasar environments.
Searches for red and obscured quasars have been pro-pelled recently by wide-field surveys such as the Sloan
Dig-ital Sky Survey (SDSS,Zakamska et al. 2003;Reyes et al.
2008;Alexandroff et al. 2013), the Two Micron All Sky
Sur-vey (2MASS,Gregg et al. 2002;Glikman et al. 2007,2012),
the United Kingdom Infrared Deep Sky Survey (UKIDSS, Glikman et al. 2013), Spitzer Space Telescope (Lacy et al. 2004,2013;Stern et al. 2005,2007;Hickox et al. 2007; Don-ley et al. 2012), and the Wide-field Infrared Survey Explorer
(WISE, Mateos et al. 2012; Stern et al. 2012;Assef et al.
2013;Yan et al. 2013). Most of these searches combine broad-band photometry with other data such as visible-wavelength spectra or radio or X-ray fluxes to identify regions of color
space populated by obscured AGN (see alsoHao et al. 2013,
and refs. therein). Obscured quasars also turn up serendip-itously in galaxy searches. For example, “HotDOG” satisfy the color selection criteria of dust obscured galaxies (DOGs, Dey et al. 2008) even though their luminosities and espe-cially their mid-IR emissions are believed to be dominated
by hot dust powered by luminous embedded AGN (
Eisen-hardt et al. 2012;Wu et al. 2012b;Tsai et al. 2015;Toba & Nagao 2016;Fan et al. 2016b, and refs. therein).
In Ross et al. (2015), our team discovered a unusual population of extremely red quasars (ERQs) in Data Release 10 (DR10) of the Baryon Oscillation Sky Survey (BOSS, Dawson et al. 2013;Ross et al. 2012) in the Sloan Digital Sky
Survey-III (SDSS-III,Eisenstein et al. 2011). Starting with
spectroscopically confirmed quasars in the BOSS quasar
cat-alogs (Pˆaris et al. 2014, 2016), we combined photometry
from the SDSS and WISE to select the most extreme cases with red colors similar to DOGs, e.g., with r − W 4 > 14 and W 4 < 8.0 (in Vega magnitudes, where W 4 measures observed-frame ∼22 µm). This search finds 65 quasars across
a wide range of redshifts (0.28 < ze < 4.36) with a variety
of properties. It includes a mix of Type 1 and 2 quasars, some starburst-dominated quasars, and several with broad absorption lines (BALs) that are strong and broad enough to suppress the r band flux and satisfy the r−W 4 color crite-rion even though the emitted spectrum is not extremely red. However, there was also a remarkable discovery that many
ERQs at ze>∼ 2 appear to be a unique population with an
ensemble of peculiar emission-line characteristics including very large rest equivalent widths (REWs), line profiles that are lacking strong Lorentzian (or logarithmic) wings charac-teristic of other broad-line AGN, and unusual line flux ratios that can include N v λ1240 > Lyα, strong Al iii λ1860, and large ratios of N v/C iv λ1549 and Si iv λ1400/C iv (see
Fig-ure 15 inRoss et al. 2015 for examples). These properties
were discussed earlier byPolletta et al.(2008) for an
indi-vidual red quasar that is clearly in the same class as ERQs. Followup near-IR observations of ERQs have revealed even more remarkable properties, notably [O iii] λ5007 emis-sion lines with the largest FWHMs and highest blueshifted
wing velocities ever reported, both reaching ∼5000 km s−1
(Zakamska et al. 2016, Hamann et al. 2016a, in prep.). The [OIII] lines identify powerful quasar-driven outflows in rela-tively low-density environments that are inferred (from pho-toionization arguments) to reside at least ∼1 kpc from the quasars. The near-IR observations also reveal that these ERQs have extreme kinematics in their broad emission-line
regions, including blueshifts that can exceed 2500 km s−1
in C iv and other high-ionization UV lines, e.g., compared to the H i Balmer lines and low-ionization permitted lines in the UV (Hamann et al. 2016a, in prep., also §5.8 below).
This ensemble of exotic emission-line properties is cen-tral to the physical nature of ERQs and their possible rela-tionship to an early transition stage of quasar-galaxy evo-lution. We present a detailed analysis of the emission lines and line-forming regions of ERQs in Hamann et al. (2016a, in prep.). In the present paper, we combine broad-band pho-tometry from SDSS and WISE with new measurements of the C iv and N v emission lines in the final BOSS data release (DR12) to 1) quantify the emission-line properties of ERQs compared to the overall BOSS quasar population, 2) exam-ine the relationships of these properties to quasar colors and luminosities, and 3) revise the selection criteria to find many
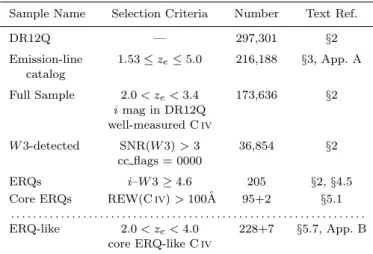
Table 1. Quasar samples designated by a name, selection cri-teria, number of quasars, and text sections where the sample is described. Samples listed above the dotted line are subsets of all samples higher in the table. The ERQ-like sample below the dot-ted line is selecdot-ted more broadly to have emission line properties like the core ERQs. The numbers 95+2 and 228+7 listed for the last two samples refer to 95/228 quasars in our emission-line cat-alog plus 2/7 more identified by visual inspections and additional line fits for all BOSS DR12Q quasars with i–W 3 ≥ 4.6.
Sample Name Selection Criteria Number Text Ref.
DR12Q — 297,301 §2 Emission-line 1.53 ≤ ze≤ 5.0 216,188 §3, App. A catalog Full Sample 2.0 < ze< 3.4 173,636 §2 i mag in DR12Q well-measured C iv W 3-detected SNR(W 3) > 3 36,854 §2 cc flags = 0000 ERQs i–W 3 ≥ 4.6 205 §2, §4.5 Core ERQs REW(C iv) > 100˚A 95+2 §5.1
. . . . ERQ-like 2.0 < ze< 4.0 228+7 §5.7, App. B
core ERQ-like C iv
more ERQ with similar exotic properties. How rare are the emission-line properties of ERQs in BOSS quasars overall? Are they closely tied to reddening and obscuration? Do they correlate with outflow signatures such as blueshifted broad absorption lines (BALs)? Are ERQs with exotic properties a unique population or just outliers in trends that occur across the larger BOSS quasar population?
Section 2 describes the quasar samples and photomet-ric data used in this study. §3 and Appendix A presents our new catalog of UV line and continuum measurements. §4 ex-amines the relationships of ERQ emission-line properties to the quasar colors and luminosities across the BOSS quasar population. §5 describes the selection and important char-acteristics of a new large sample of ERQs with exotic prop-erties. §6 discusses some of the implications of our results and §7 provides a summary. Appendix B tabulates a sup-plemental sample of “ERQ-like” quasars. Throughout this
paper, we adopt a cosmology with Ho= 71 km s−1Mpc−1,
ΩM = 0.27 and ΩΛ = 0.73. We also use magnitudes in the
AB system except as noted.
2 QUASAR SAMPLES AND DATASETS
Table 1 provides a summary of the quasar samples discussed in this paper. Our starting point is the BOSS quasar catalog
for Data Release 12 (hereafter DR12Q, Pˆaris et al. 2014,
2016). From this sample, we develop a new catalog of C iv
and N v emission-line data for 216,188 quasars in the redshift
range 1.53 ≤ ze ≤ 5.0. This new catalog is described in §3
and Appendix A. Most of our analysis focusses on quasars with measured line properties in this catalog. However, we also examine all quasars with extreme red colors in DR12Q to ensure that our final ERQ samples are complete in the BOSS DR12Q database.
We begin by defining a “full sample” of 173,636 quasars
in the redshift range 2.0 < ze < 3.4 (Table 1). This
lim-ited redshift range encompasses most of the BOSS survey while ensuring that 1) Lyα and N v λ1240 are within the BOSS spectral coverage, 2) C iv λ1549 does not contam-inate the i band magnitudes, and 3) there is no signifi-cant redshift dependence in the i–W 3 color (Figure 9 in §4.3) that we use to select and study the ERQs below. We also require that the quasar has an i magnitude recorded in DR12Q and that the C iv lines are well measured in our catalog based on signal-to-noise ratio SNR ≥ 4 in both REW(C iv) and FWHM(C iv), a reasonable value of 500 <
FWHM(C iv) < 20, 000 km s−1, and quality flag qflag =
0 indicating no significant problems with the line or con-tinuum fits (Appendix A). The median redshift of this full
sample is hzei ≈ 2.5.
We color select using broad-band photometry from the
SDSS (York et al. 2000;Alam et al. 2015), WISE (Wright
et al. 2010;Yan et al. 2013) and UKIDSS (Casali et al. 2007),
as provided in the BOSS DR12Q quasar catalog (seePˆaris
et al. 2014,2016). SDSS photometry in the filters ugriz is
available for every quasar (e.g.,Aihara et al. 2011, and refs.
therein). We correct these magnitudes for Galactic
extinc-tion using offsets fromSchlafly & Finkbeiner(2011). WISE
provides fluxes in four bands W 1, W 2, W 3 and W 4 centered at 3.4, 4.6, 12 and 22 µm, respectively. The WISE data are
from the most recent “AllWISE” release (Cutri et al. 2013),
which yields deeper photometry in the two shorter wave-length bands and better results overall than the earlier data
release “AllSky” (see alsoRoss et al. 2015, for more
discus-sion). We convert WISE magnitudes in the Vega system to
AB using offsets provided byCutri et al. (2011). UKIDSS
provides photometry in the filters Y J HK, which are already
converted to fluxes in DR12Q (Pˆaris et al. 2014,2016).
Note that the broad-band rest-frame UV properties of quasars in our study are constrained by the target
selec-tion criteria used in BOSS (Bovy et al. 2011; Ross et al.
2012). This is important to keep in mind because it skews
our searches for ERQs toward a particular unusual SED that is relatively flat across the rest-frame UV while being
ex-tremely red from the UV to mid-IR (see §5.5, alsoRoss et al.
2015).
WISE W 3 and the specifically the i–W 3 color are criti-cal for the selection and analysis of ERQs at the redshifts of our study. The subset of our full sample with good W 3 mea-surements based on WISE contamination and confusion flag cc_flags = 0000, which indicates no significant problems, and SNR ≥ 3 in the W 3 flux (as listed in DR12Q) includes 36,854 quasars.
Within this W 3-detected sample, we find 205 ERQs de-fined by i–W 3 ≥ 4.6 and a subset of 95 “core” ERQs that
have both i–W 3 ≥ 4.6 and REW(C iv) > 100 ˚A. These
pa-rameter thresholds are based on our analyses in §4. We also identify 228 “ERQ-like” quasars that span wider ranges in redshift and color with emission-line properties like the core ERQs (§5.7). We supplement these core ERQ and ERQ-like samples selected from our emission-line catalog by perform-ing visual inspections and additional line fits to all quasars that satisfy i–W 3 > 4.6 in DR12Q. This additional search finds only 2 more core ERQs and 7 more ERQ-like quasars in DR12Q that are not in our emission-line catalog (see S3 and Appendix A for details). Thus the total numbers of quasars
in the core ERQ and ERQ-like samples are 95+2=97 and 228+7= 235, respectively.
Finally, for some of our discussions, we consider a crude division between Type 1 and Type 2 sources based on
FWHM(C iv) ≥ 2000 km s−1 or < 2000 km s−1,
respec-tively (following previous studies byAlexandroff et al. 2013;
Ross et al. 2015). We add to this the requirement that Type 2 quasars cannot have BALs based on the visual inspec-tion flag in DR12Q. This distincinspec-tion between Type 1 and 2 sources is just a guideline to help describe and compare the different samples. The ambiguities in Type 1 versus Type 2 classifications based on UV spectra are discussed further
in §5.4 (alsoZakamska et al. 2003,2016;Reyes et al. 2008;
Alexandroff et al. 2013;Greene et al. 2014).
3 LINE & CONTINUUM MEASUREMENTS
Emission line measurements are an important part of our study. We developed simple robust procedures to fit the UV continuum and the C iv λ1548,1551 (hereafter λ1549) and N v λ1238,1242 (hereafter λ1240) emission lines in 216,188 quasars in BOSS DR12Q. The quasar redshift are limited
to the range 1.53 ≤ ze≤ 5.0 so that C iv and the adjacent
continuum are covered by BOSS. Our measurements provide line profile information and N v/C iv flux ratios not available in DR12Q, and they can yield better results for quasars like the ERQs that have unusual line properties and/or faint rest-frame UV continua that lead to noisy spectra in BOSS. The only BOSS quasars in this redshift range excluded from our measurements have strong C iv BALs that are reported in DR12Q to be at velocities that might interfere with our fits to the CIV emission line profiles or to the continuum be-neath CIV. Appendix A describes the fitting procedures and the final catalog of results. Here we provide a brief summary. Throughout this paper we adopt the best available
emission-line redshifts (ze) from DR12Q, e.g., derived from
spectral fitting except in rare cases where those are not available we use the visual inspection redshifts. In either case, precise redshifts are not important for our study. We use separate power laws to fit the continuum beneath the C iv and N v emission lines, and then another single power
law across the wavelength range 1360-2230 ˚A (rest) to
mea-sure the overall UV continuum slope, αλ (for fλ ∝ λαλ).
The values of αλ that we use below are derived from the
BOSS spectra after applying wavelength-dependent flux
cor-rections (fromHarris et al. 2015, see Appendix A).
We fit the C iv emission line profiles with two Gaus-sian components and then use these fits to measure basic line parameters including the REW, FWHM, and a
kurto-sis index we call kt80 that characterizes the profile shape
in terms of the width of the line core relative to the wings. Specifically, this index measures the velocity width at 80%
of the peak height divided by the width at 20%, e.g., kt80≡
∆v(80%)/∆v(20%). For comparison, a single Gaussian has
kt80 = 0.372 while most quasars have substantial
logarith-mic or Lorentzian line wings that yield kt80∼ 0.15−0.3 (§4.2
below). The kt80 kurtosis index is a variation on the index
used byMarziani et al.(1996) andZamfir et al.(2010) that
provides a slightly greater dynamic range between different profile shapes.
The N v emission line presents unique problems because
0 100 200 300 400
CIV REW (A) 0
1 2 3 4
Log Number of Quasars
Full Sample = 173636 Median REW = 48.9 A W3 detected = 36854 Median REW = 37.1 A ERQs = 205 Median REW = 89.4 A
Figure 1. REW(C iv) distributions for all quasars in our full sample (blue histogram), the WISE W 3-detected sample (gray histogram), and extremely red quasars (ERQs) with i–W 3 ≥ 4.6 (red histogram). The log numbers of quasars on the left axis are per 10 ˚A bin in REW(C iv). See §2.
it is usually blended with the Lyα emission line, which, in turn, can be distorted by absorption in the Lyα forest at
rest wavelengths <∼ 1216˚A. We avoid these problems by
us-ing the fitted C iv profile as a template that we shift and scale to match the data at the N v wavelengths. Visual in-spections of several thousand spectra show that the C iv and N v fits are generally excellent. We note, however, that the N v line strength can be overestimated in cases where Lyα is unusually broad and strong leading to substantial flux rel-ative to N v across the N v wavelengths. This is not a factor for any of the ERQs.
4 ANALYSIS
Here we investigate the relationships of the emission-line properties of ERQs to the colors and luminosities of quasars in BOSS DR12Q. Figures 1 and 2 plot the measured REW(C iv) and FWHM(C iv) distributions for all quasars in our full sample, the W 3-detected subsample, and two ERQ samples defined in Table 1 (§2).
We retain the term “ERQ” fromRoss et al.(2015) even
though we use it to indicate a less stringent color constraint of i − W 3 ≥ 4.6 compared to r − W 4 > 7.5 (corresponding to r − W 4 > 14 Vega magnitudes) in the Ross et al. study. There are 205 ERQs defined by i − W 3 ≥ 4.6 in our W 3-detected sample. Note that the i and W 3 filters measure the quasar fluxes at rest wavelengths of ∼0.2 µm and ∼3.4
µm, respectively, at the median redshift hzei ∼ 2.5 of our
samples. We use i instead of r to define ERQs because r can be severely contaminated by C iv in emission or absorption
at redshifts >∼ 2.7. The advantages of W 3 over W 4 for ERQ
selection are described in §4.4. Also note that there is no significant redshift dependence in the observed i–W 3 colors in our samples (Figure 9 below).
0 2000 4000 6000 8000 10000 12000 CIV FWHM (km/s) 0 2000 4000 6000 8000 10000 12000 Number of Quasars Full Sample = 173636 Median FWHM = 4586 km/s W3 detected = 36854 Median FWHM = 5230 km/s core ERQs = 97 Median FWHM = 2604 km/s
Figure 2. FWHM(C iv) distributions for all quasars in our full sample (blue histogram), the WISE W 3-detected sample (gray histogram), and ERQs in the “core” sample with i–W 3 ≥ 4.6 and REW(C iv) ≥ 100 ˚A (red histogram). The numbers of quasars on the left axis are per 300 km/s bin in FWHM(C iv). The W 3-detected and core ERQ distributions are multiplied by 2 and 200, respectively. See §2.
4.1 Color versus Luminosity Dependence of
REW(C iv)
One important characteristic of ERQs is a tendency for large
emission-line REWs (Figure 1).Ross et al.(2015) noted that
45% of Type 1 non-BAL ERQs have REW(C iv) > 150 ˚A
compared to only 1.3% for BOSS quasars overall. This is a remarkable result, but there are thousands of BOSS quasars
with REW(C iv) > 150 ˚A (Figure 1) and most of them are
not red. This raises the question of whether the large REWs in ERQs are related to their extreme red colors or perhaps some other property of the quasars, such as their luminosi-ties.
The Baldwin Effect (Baldwin 1977) is an empirical
in-verse correlation between emission-line REWs and
luminos-ity in Type 1 quasars (seeShields 2007, for a review). The
REW distributions shown in Figure 1 are strongly affected by this correlation. In particular, the W 3-detected sample is skewed toward smaller REWs than the full sample because the limited sensitivity of W 3 excludes many low-luminosity quasars with large REWs.
Figure 3 illustrates the C iv Baldwin Effect more di-rectly for all non-BAL Type 1 quasars in our full and W 3-detected samples. BAL quasars are excluded from this plot based on the visual inspection flag bal_flag_vi = 0 in
DR12Q. The continuum luminosities at λ = 1450 ˚A in the
rest frame, λLλ(1450), are estimated by extrapolation from
the observed broad-band r or i fluxes (for redshifts ze< 2.7
or ≥ 2.7, respectively) using the UV spectral slopes αλ
de-termined from our spectral fits (Appendix A). The results shown are in good agreement with previous studies. In par-ticular, the slope of the log-log distribution for the full sam-ple, β ≈ −0.23, is similar to the value β ≈ −0.20 derived by Dietrich et al.(2002) for quasars with similar luminosities.
The REW thresholds marked by the dashed blue lines in Figure 3 show that there are 4397 Type 1 non-BAL quasars
with REW(C iv) > 150 ˚A in our full sample. As noted above,
Type 1 non-BAL quasars with W 3 detections (bottom panel
Figure 3. C iv Baldwin Effect for Type 1 non-BAL quasars in our full sample (top panel) and the W 3-detected subsample (bottom). The green lines are linear fits to the log-log distributions with slopes given by β in the lower right. The red dots in the bottom panel mark ERQs with i–W 3 ≥ 4.6. The dashed blue lines at REW(C iv) = 100, 150 and 200 ˚A are labeled by the numbers of quasars above these thresholds. In the bottom panel, the two numbers indicate all quasars plotted / ERQs only. The contours shown here and in all subsequent figures mark the quasar point densities at 85%, 55% and 25% of the maximum in the plot, where the maximum is measured in a box whose size is 1/50th of the full x and y axis dimensions.
in Figure 3) tend to have smaller REWs because this
sam-ple favors large λLλ(1450). The ERQs (marked by red dots)
strongly favor large REWs at apparent low luminosities. This seems consistent with the Baldwin Effect. However, the faint i magnitudes of ERQs are caused by typically ∼3 magni-tudes of UV obscuration (§5.5, §6.1), their actual luminosi-ties are typically ∼1.2 dex larger than depicted in this plot (§5.1) and the Baldwin Effect does not explain their large REWs.
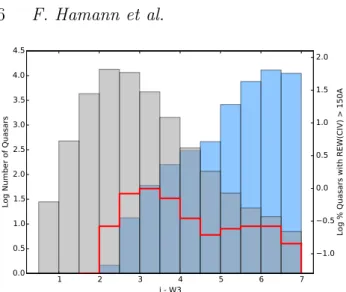
Figure 4 shows that quasars with REW(C iv) > 150 ˚A
strongly favor red i–W 3 colors. This figure plots the i–W 3 distribution for Type 1 quasars in our W 3-detected sam-ple (grey histogram), the fractions of these quasars with
REW(C iv) > 150 ˚A (blue histogram), and the
1 2 3 4 5 6 7 i - W3 0.0 0.5 1.0 1.5 2.0 2.5 3.0 3.5 4.0 4.5
Log Number of Quasars
1.0 0.5 0.0 0.5 1.0 1.5 2.0
Log % Quasars with REW(CIV) > 150A
Figure 4. Distributions in i–W 3 color for Type 1 quasars in the W 3-detected sample (gray histogram) and the subset with REW(C iv) > 150 ˚A (red histogram). The blue histogram shows the percentages of all Type 1 W 3-detected quasars with REW(C iv) > 150 ˚A at each i–W 3 color, given on the right-hand vertical scale.
˚
A (red histogram). The median1 color in the W 3-detected
sample is hi − W 3i = 2.50 ± 0.56. The fraction of quasars
with REW(C iv) > 150 ˚A at this median color is only about
0.4%. The red histogram shows that the color distribution of
quasars with REW(C iv) > 150 ˚A is dramatically offset
to-ward the red with a strong extension and secondary peak at
i–W 3 >∼ 4.6. This redward extension/peak is the ERQs
de-fined by i–W 3 >∼ 4.6, for which the fraction with REW(C iv)
> 150 ˚A reaches ∼50% at the red extreme.
Unfortunately, Figure 4 also includes selection effects that couple red i–W 3 colors to faint i magnitudes and thus larger REWs via the Baldwin Effect. Figure 5 shows these effects for each of the colors i–W 2 i–W 3 and i–W 4. In par-ticular, quasars that are faint in i in our W 3-detected sam-ple are necessarily red in i–W 3. Faint blue quasars are ex-cluded because they are below the sensitivity limits of the WISE photometry (below the green curves in Figure 5). This makes the dependence of large REWs on red colors versus faint i magnitudes difficult to disentangle. However, it is clear from the upward extensions of red/orange points
rep-resenting quasars with REW(C iv) > 150 ˚A in Figure 5, and
particularly from the red/orange squares representing large
REWs with unusual wingless profiles (kt80> 0.33), that red
colors are important to find rare quasars with both of these peculiar emission-line properties.
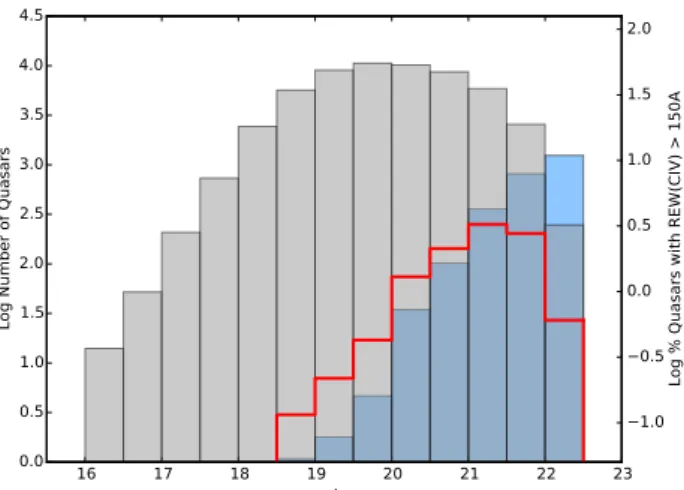
Figure 6 attempts to isolate the i magnitude depen-dence by plotting the i distributions and the fractions of
quasars with REW(C iv) > 150 ˚A only for blue quasars
with i − W 3 < 3.5. Many quasars in this plot are not de-tected in W 3, e.g., below the green line in the lower right corner of Figure 5. For these W 3 non-detections, we still require good WISE measurement in the more sensitive W 1
1 Throughout this paper, we provide sample medians with
“stan-dard errors” that are derived by a bootstrapping technique (re-sampling with replacement). For our samples, these errors are equivalent to standard deviations. The uncertainties contributed by individual measurement errors are insignificant compared to the standard errors.
Figure 5. SDSS i magnitude versus i–W 4 (top panel), i–W 3 (middle) and i–W 2 (bottom) for all quasar in our full sample with good W 4, W 3 or W 2 detections (SNR > 3 and cc flag = 0000), respectively. The green lines show approximate sensitivity limits of the WISE filters. The red and orange dots indicate Type 1 and 2 quasars, respectively, with REW(C iv) > 150 ˚A. The squares indicate REW(C iv) > 150 ˚A and “wingless” profiles with kt80> 0.33. The dashed blue line in the middle panel marks the
16 17 18 19 20 21 22 23 i 0.0 0.5 1.0 1.5 2.0 2.5 3.0 3.5 4.0 4.5
Log Number of Quasars
1.0 0.5 0.0 0.5 1.0 1.5 2.0
Log % Quasars with REW(CIV) > 150A
Figure 6. Distributions in i magnitude for blue Type 1 quasars with i–W 3 < 3.5 (gray histogram) and the subset of them with REW(C iv) > 150 ˚A (red histogram). The blue histogram shows the percentages of blue quasars with REW(C iv) > 150 ˚A at each i magnitude, given on the right-hand vertical scale. See §4.1 for more on the samples plotted.
or W 2 bands (with cc_flags = 0000) to ensure that the W 3 non-detections are not due to measurement problems. We see that faint blue quasars also have a high incidence of
REW(C iv) > 150 ˚A, as expected from the Baldwin Effect.
However, at a magnitude equal to the median for ERQs, hii ∼ 21.4 (Figure 5 middle panel), the percentage of blue
quasars with REW(C iv) > 150 ˚A is only ∼5% compared to
25% for the ERQs overall and ∼50% for the reddest ERQs
with i–W 3 >∼ 5.5 (e.g., Figures 1 and 4). This shows that
extreme large REWs are more closely related to red i–W 3 colors than to faint i magnitudes.
Moreover, if the red colors and faint i magnitudes of ERQs are caused by UV obscuration (as expected, §6.1), then ERQs are luminous and their actual peers in the Bald-win Effect are luminous blue quasars with similar W 3 mag-nitudes (not similar i) that strongly favor small REWs in the Baldwin Effect (Figure 3). The median W 3 magnitude of ERQs with i − W 3 > 4.6 is hW 3i ≈ 16.1 ± 0.7. Out of 6119 blue quasars in our emission-line catalog with similar W 3 magnitudes (in the range 15.3 < W 3 < 16.5 to yield a median hW 3i ≈ 16.2 ± 0.3), only 2 (0.03%) have REW(C iv)
> 150 ˚A and 25 (0.4%) have REW(C iv) ≥ 100 ˚A. The
me-dian REW(C iv) in this W 3-matched blue sample is also
only 31.8 ± 14.2 ˚A compared to 89.4 ± 81.4 ˚A for the ERQs
(where the large standard error for the ERQs reflects the distribution reaching very large REW(C iv), Figure 1). If the Baldwin Effect is operating at all in the ERQs, it would push them toward smaller REWs like these blue quasars, not larger ones as observed. We conclude that the Baldwin Effect plays no role whatsoever in the extreme large REWs of ERQs.
4.2 Exotic Line Properties tied to i–W 3 Color
Another important feature of ERQs is that the large REWs are accompanied by peculiar wingless line profiles and often by exotic line ratios like N v > C iv and N v > Lyα. Figure 5 above indicates that i–W 3 ≥ 4.6 (middle panel) is partic-ularly effective at separating quasars with large REWs and
wingless profiles from the rest of the quasar population. Fig-ure 7 shows more explicitly how these ERQ line properties are related to each other and strongly correlated with red i–W 3 color. The top row (panels A and B) shows that ERQs defined by i–W 3 ≥ 4.6 tend to be bright in W 3 compared to other quasars in the W 3-detected sample. If W 3 is a reason-able surrogate for unobscured luminosity (§4.1), then these plots show that ERQs tend to be about a magnitude more luminous than other quasars in our W 3-detected sample (see
also §5.1 andRoss et al. 2015). Panels C and E show that
ERQs strongly favor both wingless line profiles and large REWs. They cluster in the upper right corner of both plots
exhibiting a strong preference for REW(C iv) >∼ 100˚A and
kt80>∼ 0.33. Panels D and F show that ERQs span a wide
range in N v/C iv ratios, but they favor large N v/C iv much more than blue quasars (panel F) and they uniquely have large N v/C iv accompanied by large REWs (panel D).
Figure 8 shows dramatically how the median line prop-erties of ERQs differ from normal blue quasars matched to the ERQs in i or W 3 magnitude. This figure plots median BOSS spectra of non-BAL Type 1 quasars normalized to unity in the continuum to facilitate comparisons between the line profiles and REWs. The black curve represents all
57 non-BAL Type 1s with REW(C iv) ≥ 100 ˚A in the core
ERQ sample that we define in §2 and discuss extensively in §5. The blue quasars in this plot have i − W 3 < 3.5 color. The red spectrum represents low-luminosity blue quasars that are matched to the ERQs in i magnitude and also
re-quired to have REW(C iv) > 100 ˚A. Faint blue quasars often
have large REWs in the Baldwin Effect, but Figure 8 shows that their line profiles, FWHMs, peak heights relative to the continuum, and flux ratios such as N v/C iv, N v/Lyα, Si iv/C iv, and O vi/C iv, are all very different from the core ERQs.
The green spectrum in Figure 8 represents blue quasars matched to the ERQs in W 3 magnitude as a surrogate for lu-minosity (§4.1). This sample has no REW(C iv) constraint, so the spectrum represents a typical luminous blue quasar with small REWs in the Baldwin Effect. It is interesting that ERQs do not have anomalously large N v/C iv flux ra-tios compared to these luminous blue quasars with small REWs (see also Figure 7 panels D and F). Large N v/C iv and Si iv/C iv flux ratios can be attributed to higher metal-licities and they are known to correlate generally with large
quasar luminosities (Hamann et al. 1993; Hamann &
Fer-land 1999;Dietrich et al. 2002;Warner et al. 2003;Nagao et al. 2006). The underlying cause of this relationship might be that more luminous quasars reside in more massive host galaxies, which naturally have higher metallicities in the
well-known galactic mass-metallicity relation (Ferland et al.
1996; Hamann & Ferland 1999;Hamann et al. 2002). The ERQs are also luminous and might be particularly metal rich
(§6.2,Polletta et al. 2008, Hamann et al. 2016a, in prep.).
4.3 Redshift Distribution
Figure 9 plots i–W 3 color versus redshift for all quasars in our W 3-detected sample. There is a very weak trend for bluer i–W 3 colors (by 0.1-0.2 magnitudes) at higher red-shifts in this sample. This trend is negligible for our purposes and we do not discuss it further. There are 205 ERQs above the upper dashed line that marks the threshold i−W 3 ≥ 4.6.
Figure 7. Kurtosis index kt80for C iv (left panels) and line flux ratio N v/C iv (right panels) versus W 3 magnitude (top), log REW(C iv)
in ˚A (middle), and i–W 3 color (bottom) for quasars in the W 3-detected sample. In the top two rows (panels A-D), the red and orange symbols mark Type 1 and 2 ERQs, respectively defined by i − W 3 ≥ 4.6. In the bottom row (panels E-F), the red and orange symbols mark all Type 1 and 2 quasars, respectively, with REW(C iv) ≥ 100 ˚A. The dashed blue line marks the ERQ threshold at i–W 3 = 4.6. In the right-hand panels, the square red and orange symbols additionally indicate kt80> 0.33. Quasars with weak lines bunched up at
kt80= 0.37 are artifacts of the fitting procedure, which defaults to a single Gaussian if the fit is not improved by a second component.
0
2
4
6
8
10
12
14
Normalized Flux
Lyβ OVI SIV PV CIII*FeIII Lyα NVSiII OI CII SiIVOIV] NIV] SiIICIV HeII OIII] NIII] FeII AlIIISiIII]CIII]FeIII
Type 1 non-BAL
i,W3 matched
#=57 αλ=-0.39 i-w3=5.6 EW=160 FW=3050 kt80=0.36 nv/civ=1.53
#=5113 αλ=-1.05 i-w3=2.4 EW=31 FW=5836 kt80=0.26 nv/civ=1.73
#=543 αλ=-1.03 i-w3=---- EW=128 FW=4595 kt80=0.20 nv/civ=0.57
1000
1200
1400
1600
1800
Rest Wavelength (A)
10
110
210
3Number of QSOs
Figure 8. Top panel: Normalized median BOSS spectra of Type 1 non-BAL quasars in three samples: core ERQs with i − W 3 ≥ 4.6 and REW(C iv) ≥ 100 ˚A (black curve, §5.1), faint blue quasars with REW(C iv) ≥ 100 ˚A matched to the core ERQs in i magnitude (red curve), and luminous blue quasars matched to the core ERQs in W 3 magnitude as a surrogate for luminosity (green curve, §4.1). The spectra are shifted to the C iv frame (using wciv0 from our emission-line catalog, Appendix A) before calculating the medians. Prominent emission lines are labeled in this frame across the top. The numbers of quasars and the median values of properties measured in the individual quasars are given for each composite in colored text matching the spectra, where EW is REW(C iv) in ˚A, FW is FWHM(C iv) in km s−1, kt80 is the C iv kurtosis index kt80, and N v/C iv is the line flux ratio. Bottom panel: Numbers of quasars contributing to the
median spectra at each wavelength. See §4.2.
We see again that a very high fraction of ERQs have large C iv REWs and unusual wingless line profiles compared to the normal blue quasar population.
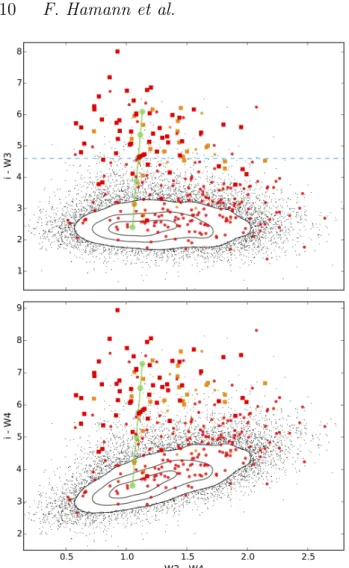
4.4 W 3–W 4 and the advantages of i–W 3
There are two reasons why i–W 3 is better for selecting ERQs than i–W 4. One is the greater sensitivity of W 3 compared
to W 4 in the WISE survey (Yan et al. 2013). For example,
only 39.5% of quasars in our W 3-detected sample also have W 4 detections at SNR > 3. The second reason is illustrated
by Figure 10. At the median redshift of our samples, ze ∼
2.5, the filters i, W 3 and W 4 measure rest wavelengths of roughly 0.2 µm, 3.4 µm and 6.4 µm, respectively. Figure 10 plots i–W 3 and i–W 4 versus W 3–W 4 color for quasars that are securely detected in all three bands. We can see from the quasar distributions in these plots that i–W 3 is better for isolating ERQs with unusual line properties. In particular,
in the top panel, quasars with REW(C iv) ≥ 100 ˚A and
unusual wingless profiles (red/orange squares) are strongly offset toward red i–W 3 colors regardless of their color in
W 3–W 4. Similarly, quasars with REW(C iv) < 100 ˚A and
normal profiles (black dots) are almost exclusively blue in i– W 3 in spite of the range they exhibit in W 3–W 4. However, in the bottom panel, the quasars with weak lines and normal profiles overlap with the ERQs in i–W 4 color because of the way i–W 4 depends on W 3–W 4.
Figure 9. i–W 3 color versus redshift for the W 3-detected sample. The red/orange symbols mark type 1/2 quasars with REW(C iv) ≥ 100 ˚A, while the squares identify subsets of these quasars with wingless profiles, e.g., kt80 > 0.33. The dashed blue lines mark
specific colors i − W 3 = 1.5, 3.5 and 4.6 used to construct com-posites for Figure 11 below (§4.5).
Median BOSS spectra constructed for quasars in differ-ent regions of Figure 10 confirm that the UV emission-line properties have no relationship to W 3–W 4 color but they
de-Figure 10. i–W 3 (top panel) and i–W 4 (bottom) versus W 3–W 4 for quasars detected in all three filters. The red/orange symbols have the same meaning as in Figure 9. The green lines are red-dening vectors with dots marking E(B − V ) = 0.0, 0.1, 0.2, 0.3, 0.4 and 0.5 from bottom to top (based on the quasar reddening curve in Hamann et al. 2016b, in prep.). The dashed blue line in the top panel marks the ERQ threshold at i–W 3 ≥ 4.6.
pend strongly on i–W 3. Also note that the observed range in W 3–W 4 color runs orthogonal to the reddening vector in the top panel of Figure 10, implying that redder W 3– W 4 colors are not related to the obscuration and reddening measured by i–W 3. Thus it appears that the W 3–W 4 col-ors at these redshifts are regulated by something that is not UV obscuration and not related to the ERQ phenomenon. We speculate that if the mid-IR fluxes at ∼3.4 and ∼6.4 µm arise from hot dust near the quasars, then the observed range in W 3–W 4 colors might be controlled by optical depth
and viewing angle effects within a warm dusty torus (
Efs-tathiou & Rowan-Robinson 1995;Nenkova et al. 2008;Mor et al. 2009) or by different dust spatial geometries leading to a range of dust temperatures (or temperature distributions) across the quasar sample.
4.5 Specific Thresholds in i–W 3 & REW(C iv)
Panels E and F in Figure 7 above show that there is a
sur-prisingly sharp boundary near i–W 3 >∼ 4.6 where the exotic
line properties of ERQs start to appear in the majority of
quasars. Panels C and D in this figure indicate that there is also a strong dependence on REW(C iv). Figure 11 defines these dependences further by plotting normalized median BOSS spectra (left panels) and corresponding median spec-tral energy distributions (SEDs, right panels) for quasars in different intervals of i–W 3 and REW(C iv). The top row plots results for Type 1 non-BAL quasars with REW(C iv)
≥ 100 ˚A in three color bins defined by the dashed blue
lines in Figure 9. We see that the median line properties
of ERQs with REW(C iv) ≥ 100 ˚A differ markedly from
their counterparts with blue and intermediate colors. Exper-iments with other i–W 3 color cuts show that these dramatic changes in the median properties occur across a narrow color range at approximately i − W 3 = 4.6 ± 0.2. The dramatic shift to peculiar line properties across this boundary illus-trates the distinct nature of the core ERQs defined by both
i–W 3 > 4.6 and REW(C iv) > 100 ˚A (§5.1). In particular,
they are not simply an extension of trends with i–W 3 color that exists across the BOSS quasar population.
The bottom row in Figure 11 shows the importance of REW(C iv) to the overall properties of ERQs. These panels plot median spectra and SEDs for the same three color bins as the top panels, but now with line strengths in a range more typical of BOSS quasars, namely 30 ≤
REW(C iv) ≤ 70 ˚A (see Figure 1). There are only 22
ERQs with REW(C iv) in this range but many thousands of blue quasars. To simplify the plots, we randomly ex-clude blue quasars to limit their numbers and impose stricter REW(C iv) constraints to force their median REW(C iv) to match the ERQs. The result is that all three color sam-ples have remarkably similar line profiles and relative line strengths. Unlike the core ERQs in top-left panel, these ERQs with normal line strengths have median line proper-ties that are virtually identical to normal blue quasars. This suggests that ERQs with normal REWs generally do not be-long to the same unique population as the core ERQs; they appear to be just normal quasars behind a dust-reddening screen.
This conclusion is supported by the median SEDs plot-ted in right-hand panels of Figure 11. First note that the blue quasars in these plots (red curves) have SEDs very similar to
the unobscured Type 1 quasar template QSO1 fromPolletta
et al. (2007). The ERQs with normal line strengths (black curve, bottom right panel) have SEDs roughly consistent with a standard reddening curve applied to this template (Hamann et al. 2016b, in prep.). In particular, these ERQs exhibit a sharp decline in the near-UV with only moderately red colors across the near-IR, similar to QSO1 reddened by selective extinction E(B − V ) ∼ 0.3. This behavior again indicates that ERQs with normal REWs tend to be normal quasars reddened by dust.
In contrast, the core ERQs have SEDs (black curve, top right panel) much flatter across the rest-frame UV in spite of their red i–W 3 colors. These unusual SEDs are another im-portant characteristic of the core ERQs that helps to define them as a unique red quasar population.
5 A UNIQUE RED QUASAR POPULATION
Our analysis in §4 shows that many ERQs defined by i–W 3 > 4.6 have a suite of peculiar emission-line properties
(Fig-1200 1300 1400 1500 1600 1700 1800 1900 0 2 4 6 8 10 12 14 Normalized Flux
Lyα NVSiII OI CII SiIV
OIV] NIV] SiIICIV HeII OIII] NIII] FeII AlIIISiIII]CIII]FeIII
Type 1 non-BAL REW > 100A
i-W3 bins
#=57 αλ=-0.39 i-w3=5.6 EW=160 FW=3050 kt80=0.36 nv/civ=1.53 #=184 αλ=-0.72 i-w3=3.8 EW=126 FW=4619 kt80=0.21 nv/civ=0.57 #=594 αλ=-0.87 i-w3=2.8 EW=118 FW=4775 kt80=0.20 nv/civ=0.60
1.0 0.5 0.0 0.5 1.5 1.0 0.5 0.0 0.5 Lo g No rm ali ze d λ Fλ i-W3 > 4.6 i-W3 = 3.5 to 4.6 i-W3 = 1.5 to 3.5 QSO1 QSO1 EBV=.3,.5 1200 1300 1400 1500 1600 1700 1800 1900
Rest Wavelength (A) 0 1 2 3 4 5 Normalized Flux
Lyα NVSiII OI CII SiIV
OIV] NIV] SiIICIV HeII OIII] NIII] FeII AlIIISiIII]CIII]FeIII
Type 1 non-BAL REW = 30-70A
i-W3 bins
#=22 αλ=0.30 i-w3=4.8 EW=47 FW=4300 kt80=0.24 nv/civ=0.75 #=539 αλ=-0.59 i-w3=3.7 EW=49 FW=4807 kt80=0.25 nv/civ=1.00 #=2373 αλ=-1.12 i-w3=2.5 EW=47 FW=4848 kt80=0.23 nv/civ=1.19
1.0 0.5 0.0 0.5
Log Rest Wavelength (microns) 1.5 1.0 0.5 0.0 0.5 Lo g No rm ali ze d λ Fλ i-W3 > 4.6 i-W3 = 3.5 to 4.6 i-W3 = 1.5 to 3.5 QSO1 QSO1 EBV=.3,.5
Figure 11. Top Row: Normalized median BOSS spectra (left) and SEDs (right) for Type 1 non-BAL W 3-detected quasars with REW(C iv) ≥ 100 ˚A in the three color bins shown in Figure 9: ERQs with i–W 3 ≥ 4.6 (black curves), intermediate colors 4.6 > i–W 3 ≥ 3.5 (green curves), and blue quasars with 3.5 > i–W 3 > 1.5 (red curves). The left-hand panels provide median values of some measured parameters for these quasar samples, as in Figure 8 above. The SEDs are scaled to unity at 4 µm and plotted with the same color scheme as the BOSS spectra. The thin faint curves are individual quasar SEDs while the bold curves are the sample medians. The dots on the bold median SEDs mark wavelengths of the broad-band filters at a typical redshift ze= 2.5, from left to right: griz, Y J HK, and W 1,
W 2, W 3 and W 4. The median SEDs split at short wavelengths to show results directly from the photometry (upper curves with filter dots) and for a median power law derived from fits to the UV spectra of individual quasars that are more reliable because they avoid spectral line contamination (lower curves without dots). The slopes of these median UV power laws are listed in the left panels. The light blue SEDs show the Type 1 quasar template QSO1 from Polletta et al. (2007) without and with reddening for E(B − V ) = 0.3 and 0.5 using an SMC-like reddening curve (from Hamann et al. 2016b). Bottom Row: Same as above but for quasars with 30 < REW(C iv) < 70 ˚A. See §4.5.
ures 7 and 8) accompanied by SEDs that are surprisingly flat across rest-UV given their red i–W 3 colors (Figure 11, see alsoRoss et al. 2015). This ensemble of properties starts to appear in a majority of quasars across a surprisingly abrupt
color boundary near i–W 3 >∼ 4.6. However, ERQs defined
only by i–W 3 > 4.6 include interlopers that look like nor-mal quasars reddened by dust (§4.5). These interlopers tend have normal C iv line strengths while the ERQs with
pecu-liar properties tend to have REW(C iv) >∼ 100˚A.
5.1 The Core ERQ Sample
Here we combine the selection criteria i–W 3 ≥ 4.6 and
REW(C iv) ≥ 100 ˚A to define a “core” sample of ERQs
that excludes most of the interlopers and strongly favors the exotic properties that identify a unique new red quasar population. We find 95 core ERQs satisfying these crite-ria in our W 3-detected sample. We also searched the entire DR12Q catalog for more core ERQs that might be missing from emission-line catalog, e.g., because they have BALs at wavelengths that might affect our emission-line
measure-ments (§2, Appendix A). We do this by visually inspecting the BOSS spectra and performing additional line fits for all DR12Q quasars with i–W 3 > 4.6. This search yields only 2 more sources for a total sample of 97 core ERQs that is com-plete among W 3-detected quasars in DR12Q at the redshifts of our study.
Thirteen of these 97 core ERQs are in the original ERQ
sample ofRoss et al.(2015). The larger number here is due
partly to our use of the final BOSS data release DR12 in-stead of DR10, but mostly to our less stringent color con-straint using a more sensitive WISE filter, e.g., i–W 3 ≥ 4.6 instead of r–W 4 > 7.5. The median color of the core ERQs is hi − W 3i ≈ 5.31 ± 0.65 compared to hi − W 3i ≈ 2.50 ± 0.57 for quasars in the W 3-detected sample overall (§4.1, also Figures 4 and 9). The median redshift of the core ERQs is
hzei = 2.50 ± 0.27.
The median line properties and SEDs of Type 1 non-BAL ERQs in the core sample were shown already in Fig-ures 8 and 11 above. Seventy four (76%) of the 97 core ERQs are Type 1s by our definition in §2, although closer examina-tion suggests that some of them with FWHM(C iv) < 2000
km s−1are actually Type 1s. This is issue discussed further in §5.4.
Bolometric luminosities are difficult to estimate for ERQs because we have limited wavelength coverage and the amounts of obscuration in the rest-frame visible/UV are un-certain. However, if we assume that their W 3 fluxes (rest frame ∼3.4 µm) are relatively unaffected by dust extinc-tion and their emitted/intrinsic SEDs are like other
lumi-nous quasars (as described in Hamann et al. 2013), then
the median magnitude hW 3i ∼ 16.1 ± 0.7 of the core ERQs corresponds to a median bolometric luminosity of log L(ergs/s) ∼ 47.1±0.3. Given the range of SEDs observed
in blue/unobscured quasars (Figures 9 and 11, Elvis et al.
1994;Richards et al. 2006), the uncertainties in their
bolo-metric correction factors (alsoRichards et al. 2011), and the
possibility that the core ERQs might have intrinsically pecu-liar SEDs in the unobserved far-UV (Hamann et al. 2016a, in prep.), this median luminosity should be considered only a crude estimate uncertain by at least a factor of two.
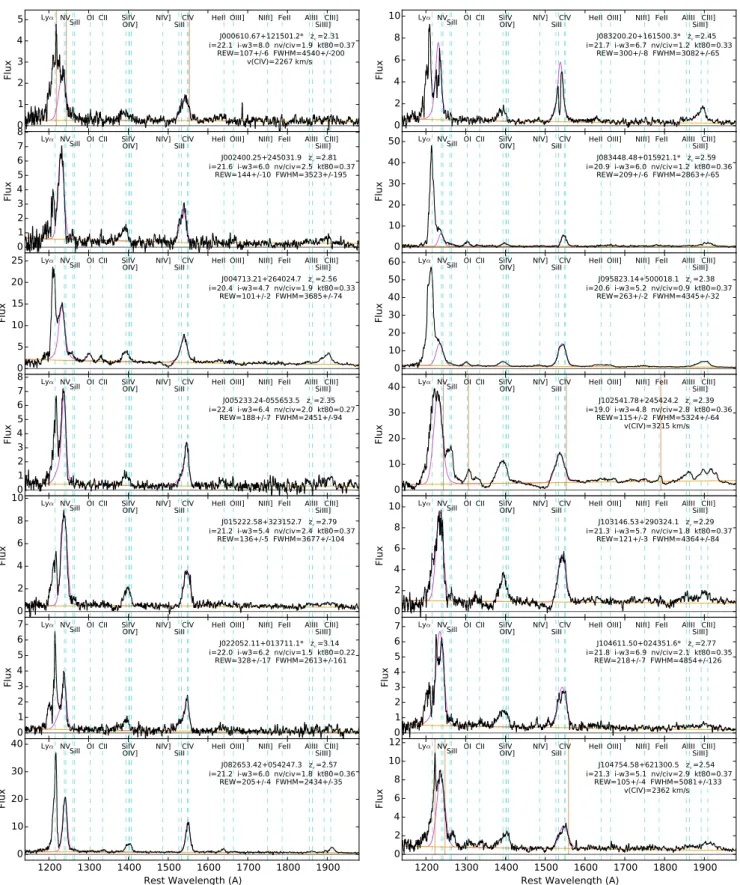
Figure 12 plots BOSS spectra for some individual Type 1s in the core ERQ sample to illustrate both the range and similarity of properties across the sample. This
fig-ure includes all 10 Type 1 core ERQs from Ross et al.
(2015) plus 20 new ones discovered here. All of them have
unusual wingless C iv profiles and many have some type of blueward extension on C iv – either BALs or BAL-like absorption (e.g., J004713+264024, J102130+214438, J103146+290324, J131047+322518, J135608+073017, plus others) or extended blue emission wings (not matched on the red side, e.g., J005233-055653, J113834+473250, J134417+445459, J150117+231730, J160431+563354) that can lead to a kurtosis index smaller than the majority of
core ERQs with kt80> 0.33 (Figure 7).
We also see in Figure 12 the unusual line flux ratios de-scribed above, most notably N v > Lyα and large N v/ C iv, but there are some dramatic exceptions with strong Lyα and weak/normal N v (e.g., J083448+015921, J095823+500018, J111729+462331). It is interesting, but possibly coinciden-tal, that these exceptions stand out for not having significant blue-red asymmetries or BAL-like absorption like the other core ERQs (§5.3). The core ERQs also tend to have unusu-ally large Si iv/C iv ratios and in some cases strong Al iii λ1860 compared to the intercombination lines with simi-lar ionization, namely C iii] λ1909 and Si iii] λ1892. These line properties carry information about the gas metallici-ties, physical conditions, and the locations of the emitting regions, as well as the shape and intensity of the incident ionizing spectra. We discuss these issues further in Hamann
et al. (2016a, in prep., see alsoPolletta et al. 2008).
Table 1 lists some basic data for the 97 core ERQs. The selective extinctions in this table, E(B−V ), are based on r, i, z − W 1 colors corrected for Galactic extinction (from Hamann et al. 2016b, in prep.). They are available only for
quasars at 2.1 < ze< 3.4 with detections in both i and W 1
at SNR > 5. They provide a conventional measure of the reddening for comparison to other studies. However, these E(B−V ) values underestimate the true amounts of obscu-ration in the core ERQs because they derive from spectral slopes only across the rest-frame visible to UV (see §5.5 for more discussion).
5.2 Radio Properties
Out of the 91 core ERQs covered by FIRST, 8 are detected at ≥1 mJy. (None of the 6 objects without FIRST coverage are detected by the NVSS at >2.5 mJy). At the median
red-shift of the radio detections, ze= 2.67, the 1 mJy flux limit
of the FIRST survey corresponds to a k-corrected
luminos-ity νLν(1.4GHz) ∼ 4 × 1041 ergs s−1. While radio spectral
indices of this population are unknown, we assume α = −0.7
in our calculation. As discussed byRoss et al.(2015), it is
unlikely that much of the radio luminosity in the FIRST-detected sources is due to star formation, as star
forma-tion rates in excess of 8000 M /year would be required to
produce such luminosity, as per calibrations by (Bell 2003).
Thus, we suspect that radio emission at this level must be due to the quasar – either from the jets or as a bi-product
of radiatively driven winds (Zakamska & Greene 2014).
The luminosity that corresponds to the flux limit of the FIRST survey is close to the traditional cutoff between
radio-quiet and radio-loud objects at these redshifts (Xu
et al. 1999; Richards et al. 2011). Two of the eight ERQs with FIRST detections were targeted by BOSS exclusively due to their radio detections, and therefore the fraction of FIRST detections in a sample selected only by their optical and infrared properties is 6/89=6.7%, similar to other
lumi-nous quasar populations (Zakamska et al. 2004;Jiang et al.
2007). For a direct comparison of this detection fraction
be-tween ERQs and the overall quasar population, we take all ∼75,000 quasars at 2.4 < z < 2.9 in the DR12 quasar
cat-alog (Pˆaris et al. 2016) and use their FIRST MATCHED
flag to calculate the fraction of quasars with matches in the FIRST survey in the same way as we do for ERQs. While the overall FIRST detection fraction is only 3.4% for quasars in this redshift range, it rises steadily as we consider more and more luminous objects until it reaches the same percentage
as ERQs for the ∼8000 quasars brighter than M2500= −26.6
mag. Therefore, the FIRST detection rates of ERQs are sim-ilar to those of the brightest Type 1 quasars at the same redshift.
Mean and median stacks (White et al. 2007) of the 81
non-detected core ERQs with FIRST coverage yield a mea-sured flux of 125 µJy/beam in the mean and 107 µJy/beam in the median. These fluxes are likely underestimated be-cause of the poorly understood CLEAN bias which is intro-duced during the non-linear radio image reconstruction from
the incompletely sampled Fourier space (White et al. 2007).
Assuming that most of the flux is due to point sources and
correcting for the CLEAN bias using estimates fromWhite
et al. (2007), we estimate that the true mean flux of the radio-quiet core ERQs is 180 µJy. The main sources of uncer-tainty in this estimate are the dispersion of the radio fluxes within the population and the CLEAN bias. By resampling (with return) the images that contribute to the stacks we estimate the error in the mean flux to be 25 µJy and the uncertainly in the CLEAN bias is on the same order. At the
median redshift of the stacked sample, ze = 2.48, the
esti-mated true mean flux of 180 µJy corresponds to k-corrected
luminosity νLν(1.4GHz) ∼ 8 × 1040 ergs s−1. Alexandroff
et al.(2016) discuss comparisons of the average radio prop-erties of ERQs to high-redshift Type 2 quasar candidates and conclude that ERQs are brighter in the radio than opti-cally selected Type 2 quasar candidates at the same redshift.
Figure 12. BOSS spectra of some representative Type 1 core ERQs (§5.1) plotted at rest wavelengths using the best available redshifts from DR12Q (§3). Common emission lines are labeled across the top at positions marked by dashed blue lines. The orange and magenta curves show our fits to the continuum and the C iv and N v emission lines, respectively. The quasar names, redshifts and other measured properties are given in each panel (see also Table 2). Names marked by ‘*’ are in the Ross et al. (2015) sample. Vertical brown lines in some panels mark estimated systemic line wavelengths based on distinct narrow Lyα emission spikes or O i and Fe ii emission lines (in J102541+245424 only). These markings can reveal large blueshifts in the observed broad C iv and N v emission lines, which are listed as v(C iv) in those panels (see §5.8). The flux units are 10−17ergs s−1cm−2˚A−1.
Table 2. Core ERQ properties: zeis the best available emission-line redshift from DR12Q (§3). i magnitude and i–W 3 color corrected
for Galactic extinction. REW, FWHM and kt80for the C iv emission lines, N v/C iv is the line flux ratio, and αλis the UV continuum
slope all from our emission line catalog (Appendix A). BAL is the visual inspection flag (bal_flag_vi) from DR12Q where 1 indicates that a BAL is present. E(B−V ) is the selective extinction derived from r, i, z − W 1 colors by Hamann et al. (2016b, in prep.). FIRST is the 20 cm radio flux from FIRST where no entry means the source was not covered by FIRST, 0.0 indicates a non-detection with 5σ upper limit ∼1 mJy (Becker et al. 1995;Helfand et al. 2015), non-zero entries are measurements with SNR > 3 as recorded in DR12Q.
Quasar Name ze i i–W 3 REW FWHM kt80 N v/C iv BAL αλ E(B−V ) FIRST
(mag) (mag) (˚A) (km/s) (mJy)
J000610.67+121501.2a 2.31 22.1 8.0 107±6 4540±200 0.37 1.88 0 −0.20 0.66±0.01 0.0 J000746.19+122223.9 2.43 21.3 4.9 220±6 2433±71 0.28 0.39 0 −0.17 0.19±0.01 0.0 J002400.25+245031.9 2.81 21.6 6.0 144±10 3523±195 0.37 2.46 0 −1.14 0.20±0.02 — J004713.21+264024.7 2.56 20.4 4.7 101±2 3685±74 0.33 1.92 1 −1.08 0.15±0.01 — J005044.95−021217.6 2.25 21.5 4.7 147±9 4343±487 0.19 0.61 0 −1.73 0.14±0.02 0.0 J005233.24−055653.5 2.35 22.4 6.4 188±7 2451±94 0.27 2.03 0 1.33 — 0.0 J014111.13−031852.5 2.56 20.8 4.8 101±2 2986±45 0.37 1.85 0 −0.29 0.15±0.01 0.0 J015222.58+323152.7 2.79 21.2 5.4 136±5 3677±104 0.37 2.44 0 −0.27 0.37±0.01 — J020932.15+312202.7 2.38 21.4 5.1 108±6 2180±97 0.34 1.07 0 0.61 0.23±0.02 — J022052.11+013711.1a 3.14 22.0 6.2 328±17 2613±161 0.22 1.53 0 −1.78 — 0.0 J080425.75+470159.0 2.77 22.1 5.4 162±5 2371±64 0.35 1.28 0 −0.61 0.25±0.03 0.0 J080547.66+454159.0 2.33 21.8 6.3 109±4 2667±107 0.21 1.61 0 −0.43 0.31±0.01 0.0 J082536.31+200040.3 2.09 21.5 4.7 211±9 3265±209 0.17 0.35 0 −1.35 — 0.0 J082649.30+163945.2 2.32 21.9 4.6 205±6 5633±150 0.33 0.57 0 −0.60 0.33±0.02 0.0 J082653.42+054247.3 2.57 21.2 6.0 205±4 2434±35 0.36 1.84 0 −0.62 0.28±0.01 1.1 J083200.20+161500.3a 2.45 21.7 6.7 300±8 3082±65 0.33 1.25 0 −1.24 0.30±0.01 1.0 J083448.48+015921.1a 2.59 20.9 6.0 209±6 2863±65 0.36 1.16 0 1.15 0.09±0.01 0.0 J084447.66+462338.7a 2.22 21.1 6.0 161±4 1656±36 0.35 1.30 0 −1.06 0.31±0.01 0.0 J085451.11+173009.1 2.61 21.9 5.6 120±9 4199±207 0.37 1.98 0 −1.40 0.21±0.02 0.0 J090306.18+234909.8 2.26 21.9 5.0 144±5 2481±98 0.21 1.45 0 −0.79 0.26±0.02 0.0 J091303.90+234435.2 2.42 21.7 5.3 145±5 2190±65 0.34 1.49 0 −0.23 0.20±0.02 0.0 J091508.45+561316.0 2.86 21.5 5.6 226±9 2867±102 0.35 0.92 0 −2.12 0.11±0.03 1.2 J092049.59+282200.9 2.30 20.8 4.8 197±4 1048±17 0.37 0.40 0 −1.70 — 0.0 J093226.93+461442.8 2.31 21.7 5.7 443±13 1960±53 0.35 0.66 0 1.99 0.26±0.02 0.0 J093506.96−024137.7 2.17 21.8 4.8 119±5 2404±106 0.25 1.28 1 −0.60 0.25±0.02 0.0 J093638.41+101930.3a 2.45 21.6 6.2 172±3 1271±19 0.37 1.72 0 −0.60 0.36±0.01 0.0 J095033.51+211729.1 2.74 21.9 5.5 272±7 1387±29 0.36 0.51 0 −0.34 0.35±0.02 1.5 J095823.14+500018.1 2.38 20.6 5.2 263±2 4345±32 0.37 0.92 0 −0.98 0.20±0.01 10.3 J101324.53+342702.6 2.48 20.0 4.7 205±3 4157±51 0.34 0.89 0 −0.67 0.08±0.01 0.0 J101533.65+631752.6 2.23 21.9 5.5 130±5 2012±59 0.36 2.88 0 −1.31 0.30±0.02 0.0 J102130.74+214438.4 2.19 22.1 5.4 155±6 3567±92 0.37 2.23 1 −1.39 0.32±0.01 0.0 J102353.44+580004.9 2.60 21.1 5.1 116±5 2107±73 0.37 1.05 0 −0.47 0.24±0.01 0.0 J102447.32−013633.8 2.88 21.9 5.8 192±15 2843±396 0.15 1.16 0 −0.49 0.23±0.04 9.3 J102541.78+245424.2b 2.34 19.0 4.8 115±2 5324±64 0.36 2.82 1 1.24 0.20±0.00 0.0 J103146.53+290324.1 2.29 21.3 5.7 121±3 4364±84 0.37 1.78 1 −0.16 0.33±0.01 0.0 J103456.95+143012.5 2.96 21.0 4.8 102±8 5949±367 0.37 1.26 1 1.83 0.18±0.01 0.0 J104611.50+024351.6a 2.77 21.8 6.9 218±7 4854±126 0.35 2.13 0 −1.10 0.29±0.03 0.0 J104718.35+484433.8 2.28 20.9 5.3 158±4 2521±51 0.36 0.57 0 −0.47 0.19±0.01 0.0 J104754.58+621300.5 2.54 21.3 5.1 105±4 5081±133 0.37 2.88 0 −0.92 0.20±0.01 0.0 J110202.68−000752.7 2.63 21.9 4.9 121±6 3767±282 0.18 0.41 0 −1.73 0.29±0.01 0.0 J111017.13+193012.5a 2.51 20.1 6.2 220±7 2427±65 0.33 1.62 1 1.30 0.48±0.00 0.0 J111346.10+185451.9 2.52 21.7 4.6 127±3 986±26 0.35 0.49 0 −1.09 0.18±0.02 0.0 J111355.72+451452.6 2.19 20.5 4.7 190±7 1243±38 0.35 0.53 0 −0.59 0.16±0.01 0.0 J111516.33+194950.4 2.79 22.0 5.0 247±13 1739±75 0.36 1.45 0 0.43 0.29±0.03 0.0 J111729.56+462331.2 2.13 21.8 6.3 395±8 3053±54 0.35 0.51 0 0.27 0.55±0.02 0.0 J113349.71+634740.0 2.20 21.2 4.6 121±4 2081±69 0.34 1.90 1 −1.38 0.26±0.01 0.0 J113834.68+473250.0 2.31 21.9 6.1 177±6 3296±104 0.22 1.72 0 −0.17 0.30±0.01 0.0 J121253.47+595801.2b 2.58 20.8 4.9 107±3 1402±41 0.34 2.3 1 0.13 0.26±0.01 0.0 J121704.70+023417.1 2.42 21.0 5.6 181±5 2604±55 0.37 2.42 0 2.01 0.40±0.01 0.0 J122000.68+064045.3 2.80 21.4 4.9 113±6 1047±57 0.15 0.61 0 0.04 0.23±0.02 0.0 J123241.73+091209.3a 2.38 21.1 6.8 225±3 4787±52 0.37 1.86 0 −0.74 0.28±0.01 0.0 J124106.97+295220.8 2.79 21.8 5.3 138±7 2600±133 0.20 1.26 0 0.12 — 0.0 J124738.40+501517.7 2.39 21.5 5.0 135±5 3268±118 0.29 1.68 0 −0.35 0.30±0.01 0.0 J125019.46+630638.6 2.40 21.9 5.5 242±4 1881±28 0.34 0.56 0 −1.20 0.20±0.01 0.0 J125449.50+210448.4 3.12 21.2 5.8 141±3 2482±48 0.36 2.05 0 −0.08 0.41±0.01 0.0 J125811.25+212359.6 2.61 21.5 5.6 158±5 1599±53 0.18 0.48 0 −0.42 — 0.0 J130114.46+131207.4 2.79 21.4 5.1 186±4 1877±35 0.36 2.42 0 −0.33 0.27±0.02 0.0
Table 2. Core ERQ Properties (Continued)
Quasar Name ze i i–W 3 REW FWHM kt80 N v/C iv BAL αλ E(B−V ) FIRST
(mag) (mag) (˚A) (km/s) (mJy)
J130421.12+083752.2 2.95 21.9 5.7 132±5 3014±83 0.37 1.56 0 −0.91 0.34±0.02 0.0 J130630.66+584734.7 2.30 21.7 5.0 331±6 1133±18 0.36 0.28 0 −1.24 — 0.0 J130654.76+132704.8 2.50 21.7 5.0 196±7 2511±71 0.35 0.39 0 −0.17 0.22±0.02 0.0 J130936.14+560111.3 2.57 21.9 6.4 161±6 3630±114 0.36 1.91 0 −0.56 0.26±0.01 0.0 J131047.78+322518.3 3.02 20.3 5.3 226±4 2794±41 0.37 2.15 1 0.18 0.31±0.01 0.0 J131722.85+322207.5 2.40 22.1 6.0 160±5 2311±65 0.36 2.27 0 −0.36 0.31±0.01 0.0 J131833.76+261746.9 2.27 21.3 4.9 150±4 1280±29 0.36 0.68 0 0.26 0.21±0.01 0.0 J134001.90+322155.9 2.40 21.7 4.7 131±7 1823±125 0.21 0.89 0 0.38 0.41±0.01 0.0 J134026.99+083427.2a 2.48 22.2 5.6 358±12 2076±52 0.35 1.74 0 −0.71 — 0.0 J134417.34+445459.4 3.04 22.3 6.8 310±9 2871±70 0.36 1.61 0 −0.31 0.46±0.02 0.0 J134450.51+140139.2 2.75 21.6 5.1 132±7 4487±191 0.37 2.35 0 0.27 0.32±0.02 0.0 J134535.66+600028.4 2.94 21.6 5.1 142±21 6460±742 0.37 0.92 0 −1.38 0.13±0.02 0.0 J135557.60+144733.1 2.70 20.4 4.7 118±3 2958±60 0.34 0.75 0 −0.10 0.16±0.01 0.0 J135608.32+073017.2 2.27 21.6 5.1 110±3 2043±46 0.37 2.48 1 −1.29 0.31±0.01 0.0 J140506.80+543227.3 3.21 21.1 4.7 123±3 2640±59 0.36 2.62 1 −1.64 0.09±0.02 0.0 J141350.76+214307.7 2.44 22.1 4.9 208±6 2356±57 0.36 0.87 1 −0.75 0.19±0.02 0.0 J143159.76+173032.6 2.38 21.8 5.8 177±3 2084±29 0.37 1.22 0 −0.45 0.31±0.01 0.0 J145354.70+190343.9 2.35 19.9 4.8 142±5 2046±60 0.35 0.52 1 1.08 0.28±0.00 0.0 J145623.35+214516.2 2.48 21.0 5.0 103±5 4422±148 0.36 1.22 0 −0.32 0.32±0.01 0.0 J150117.07+231730.9 3.03 22.1 5.9 231±10 4035±130 0.23 1.94 0 0.00 0.30±0.02 0.0 J152941.01+464517.6 2.42 20.7 4.8 159±4 1896±42 0.35 2.01 0 −1.16 0.12±0.01 0.0 J153107.14+105825.8 2.78 22.0 5.9 152±7 3937±146 0.37 1.43 0 −1.13 0.25±0.02 0.0 J153108.10+213725.1 2.57 22.1 5.2 213±11 2767±143 0.26 0.73 0 1.29 0.20±0.02 0.0 J153446.26+515933.8 2.26 21.7 4.7 127±5 1156±57 0.28 0.69 0 −0.72 0.32±0.01 0.0 J154243.87+102001.5 3.21 22.2 6.6 114±11 3901±286 0.37 2.79 0 −0.82 0.48±0.02 0.0 J154743.78+615431.1 2.87 21.7 4.9 128±10 1177±111 0.26 0.92 0 −1.15 0.33±0.02 0.0 J154831.92+311951.4 2.74 21.7 4.8 127±6 3050±104 0.37 2.28 0 −0.71 0.31±0.02 0.0 J160431.55+563354.2 2.48 21.5 5.7 205±5 4221±82 0.34 2.26 0 −1.66 0.20±0.01 0.0 J164725.72+522948.6 2.72 21.6 5.2 124±4 1905±52 0.35 1.78 0 −1.05 0.11±0.02 1.2 J165202.64+172852.3 2.94 20.3 5.4 125±2 2403±45 0.33 2.37 0 −0.41 0.31±0.01 1.6 J170558.64+273624.7 2.45 20.6 5.1 157±3 1301±22 0.36 0.47 1 0.32 0.36±0.00 0.0 J171420.38+414815.7 2.34 21.3 4.7 130±5 3816±109 0.36 1.74 1 −0.74 0.20±0.01 0.0 J220337.79+121955.3a 2.62 21.7 6.2 266±3 1070±9 0.37 0.51 0 0.23 0.40±0.01 0.0 J221524.00−005643.8a 2.51 22.2 6.2 153±5 4280±112 0.37 0.86 0 0.06 0.36±0.02 0.0 J222421.63+174041.2 2.17 21.5 4.8 110±4 2749±102 0.19 1.56 1 −0.93 0.24±0.01 — J223754.52+065026.6 2.61 22.0 5.8 141±5 1391±44 0.36 1.03 0 −1.20 0.24±0.02 0.0 J225438.30+232714.5 3.09 22.0 5.5 415±20 4412±146 0.36 0.66 0 −0.38 — — J232326.17−010033.1a 2.36 22.4 7.2 256±5 3989±62 0.37 2.16 0 0.91 0.40±0.01 0.0 J232828.47+044346.8 2.56 21.5 5.5 359±5 1584±20 0.35 0.37 0 −0.28 0.13±0.02 0.0 J233636.99+065231.0 2.78 22.2 6.0 128±6 1484±83 0.26 1.10 0 −0.19 — 0.0
aThese quasars are in theRoss et al.(2015) ERQ sample. bThese quasars are in DR12Q but not in our emission line catalog.
5.3 Broad Outflow Absorption Lines
Fourteen (∼20%) of the 71 core ERQs with FWHM(C iv) >
2000 km s−1 in our emission-line catalog have BALs
iden-tified by visual inspection in DR12Q. This BAL fraction is nearly 1.5 times larger than the 14% we find for Type 1s in our W 3-detected sample overall. We note that BALs iden-tified by visual inspection do not always meet the rigorous
definition of “balnicity index” BI > 0 (Weymann et al. 1991;
Pˆaris et al. 2014,2016). They can be narrower or at lower
velocities than BALs defined by BI to have FWHM >∼ 2000
km s−1 and v > 3000 km s−1. However, visual inspection
can be more effective at identifying BALs than automated BI determinations for quasars with noisy/weak continua or with absorption in the wing of very strong broad emission lines (which tends to be the case for the ERQs). Thus we
pro-ceed with the understanding that the BALs discussed here
are not always of the classic variety described byWeymann
et al.(1991), but they are nonetheless broad and indicative of high-speed quasar-driven outflows.
We also note that the BAL fractions in our study are underestimates because our emission-line catalog excludes quasars with BALs at wavelengths that might affect our emission line fits (§3). The BAL fraction in our W 3-detected sample is, nonetheless, similar to other BAL quasar studies
based on SDSS-I/II (e.g.,Gibson et al. 2009;Knigge et al.
2008;Trump et al. 2006). For the core ERQs, our visually in-spections of all BOSS spectra of ERQs in DR12Q finds only
1 more quasar with FWHM(C iv) > 2000 km s−1, which
has strong BALs, bringing the final BAL fraction to 15/72
= 21% for all core ERQs with FWHM(C iv) > 2000 km s−1