Resting-state functional connectivity and
cortical thickness characterization of a patient
with Charles Bonnet syndrome
Charlotte MartialID1,2*, Stephen Karl LarroqueID1,2, Carlo Cavaliere1,3, Sarah Wannez1,2, Jitka Annen1,2, Ron Kupers4,5,6, Steven Laureys1,2☯, Carol Di Perri1,7☯
1 GIGA-Consciousness, University of Liège, Liège, Belgium, 2 Coma Science Group, University Hospital of Liège, Liège, Belgium, 3 NAPLab, IRCCS SDN Istituto di Ricerca Diagnostica e Nucleare, Naples, Italy, 4 BRAINlab, Department of Neuroscience, Panum Institute, University of Copenhagen, Copenhagen, Denmark, 5 Unite´ COSY, Institute of Neuroscience, Universite´ Catholique de Louvain, Brussels, Belgium, 6 Harland Sanders Chair in Visual Science, School of Optometry, University of Montreal, Montreal, Quebec, Canada, 7 Centre for Clinical brain Sciences, Centre for Dementia Prevention, IK Dementia Research Institute, University of Edinburght, Edinburgh, United Kingdom
☯These authors contributed equally to this work.
*cmartial@uliege.be,coma@chu.ulg.ac.be
Abstract
Charles Bonnet syndrome (CBS) is a rare condition characterized by visual impairment associated with complex visual hallucinations in elderly people. Although studies sug-gested that visual hallucinations may be caused by brain damage in the visual system in CBS patients, alterations in specific brain regions in the occipital cortex have not been studied. Functional connectivity during resting-state functional magnetic resonance imag-ing (rs-fMRI; without hallucinations) in CBS patients, has never been explored. We aimed to investigate brain structural and functional changes in a patient with CBS, as compared with late blind (LB) and normally sighted subjects. We employed voxel-based morphometry and cortical thickness analyses to investigate alterations in grey matter characteristics, and rs-fMRI to study changes in functional brain connectivity. Decreased grey matter vol-ume was observed in the middle occipital gyrus and in the cuneus in the CBS patient, and in the middle occipital gyrus and in the lingual gyrus within LB subjects, compared to their respective control groups. Reductions in cortical thickness in associative and multimodal cortices were observed in the CBS patient when comparing with LB subjects. The precu-neus exhibited increased functional connectivity with the secondary visual cortex in the CBS patient compared to the controls. In contrast, LB patients showed decreased func-tional connectivity compared to sighted controls between the DMN and the temporo-occipi-tal fusiform gyrus, a region known to support hallucinations. Our findings suggest a
reorganization of the functional connectivity between regions involved in self-awareness and in visual and salience processing in CBS that may contribute to the appearance of visual hallucinations. a1111111111 a1111111111 a1111111111 a1111111111 a1111111111 OPEN ACCESS
Citation: Martial C, Larroque SK, Cavaliere C,
Wannez S, Annen J, Kupers R, et al. (2019) Resting-state functional connectivity and cortical thickness characterization of a patient with Charles Bonnet syndrome. PLoS ONE 14(7): e0219656.
https://doi.org/10.1371/journal.pone.0219656 Editor: Stephen D Ginsberg, Nathan S Kline
Institute, UNITED STATES
Received: February 22, 2019 Accepted: June 28, 2019 Published: July 18, 2019
Copyright:© 2019 Martial et al. This is an open access article distributed under the terms of the
Creative Commons Attribution License, which permits unrestricted use, distribution, and reproduction in any medium, provided the original author and source are credited.
Data Availability Statement: The authors confirm
that all data underlying the findings are available, however, some access restrictions apply due to ethical and legal reasons. Our data include patient information and sharing the data publicly would compromise patient privacy. Patients’ original data are available from the GIGA-Consciousness Institutional Data Access (contact via coma@chu. ulg.ac.be) after approval from the ethics committee of the Medical School of the University Hospital Centre of Liège (Belgium) for researchers who meet the criteria for access to confidential data.
Introduction
Charles Bonnet syndrome (CBS) is a rare syndrome characterized by complex and recurrent visual hallucinations in people without psychological disorder. This syndrome typically occurs in people who have a visual deficit, generally resulting from macular degeneration, optic neuri-tis, cataracts, retinitis pigmentosa, glaucoma or diabetic retinopathy [1]. Typically, the experi-enced visual hallucinations are clearly recognized as unreal by CBS patients. So far, CBS has been associated with lesions of the visual system ranging from the retina to the occipital cortex [2]. Previous magnetic resonance imaging (MRI) studies have provided diverging results about the presence of structural brain alterations in CBS patients. Some studies have suggested that visual hallucinations in CBS patients may be caused by structural damage somewhere within the visual system [3–7], even though the specific regions have not been determined. Functional neuroimaging underlying the pathophysiology of visual hallucinations in CBS sub-jects remains relatively unexplored. Functional studies in actively hallucinating CBS patients have reported increased activation of the ventral occipital lobe and the inferior lateral temporal cortex (mainly the fusiform gyrus) during spontaneous hallucinations [3,8–10]. However, functional connectivity during resting state functional magnetic resonance imaging (rs-fMRI), i.e. without active hallucinations in CBS patients, has never been reported. Resting state may offer an ideal approach for providing novel insights into the functional pathways that allow the emergence of visual hallucinations.
Here, we investigated a late-onset visually-impaired patient with CBS who experiences complex visual hallucinations with a structural-functional imaging approach. In order to dis-cern the findings strictly related to the visual impairment from those related to visual halluci-nation in our patient, we included three control samples for comparison: one consisting of a group of normal sighted subjects with the CBS patient, a second one consisting of a group of late blind (LB) subjects without CBS, and a third group of normal sighted subjects matched in age and sex with the LB. We used voxel-based morphometry (VBM) to study differences in grey matter density, and cortical thickness analysis to investigate structural cortical rear-rangement in CBS (given that the present patient suffers from a degenerative eye disease, we focused on the lateral geniculate nucleus (LGN) from the visual pathways). We further inves-tigated functional connectivity patterns by means of rs-fMRI in order to detect changes in functional connectivity patterns underlying this syndrome. To this end, we used both a seed-based approach focusing on brain areas implicated in visual consciousness and salience networks.
Materials and methods
Participants
Case report. An 85-year-old man with visual impairment and no psychiatric history
pre-sented to the neurological department of the University Hospital Centre of Liège (Belgium). He reported his five-year history of increasing frequency of visual hallucinations and was able to give a detailed and coherent description of his hallucinatory experiences. The patient suf-fered from retinitis pigmentosa, a degenerative eye disease causing severe vision impairment due to progressive degeneration of the rod photoreceptors in the retina [11]. At the age of 3 years, he began experiencing progressive and gradual loss of vision. During his adolescence, his peripheral field of vision progressively narrowed (progressive development of "tunnel vision") and he developed hemeralopia, i.e. night vision deterioration by the abolition of rod cells. At the age of 70 he also lost central vision which resulted in complete blindness at the age of 80. The patient reported a positive family history of CBS.
Funding: This work was supported by the
University and University Hospital of Liege (SL), the Belgian National Funds for Scientific Research (FRS-FNRS; CM, SKL, SL, CD), the Human Brain Project (EU-H2020-fetflagshiphbpsga1-ga720270) (SL), the Luminous project (EU-H2020-fetopenga686764) (SL), the Center-TBI project (FP7-HEALTH- 602150) (SL), the Public Utility Foundation ‘Universite´ Europe´enne du Travail’ (SL), “Fondazione Europea di Ricerca Biomedica” (SL), the Bial Foundation (SL), the European Space Agency (SL), the Mind Science Foundation (SL) and the European Commission (SL). The funders had no role in study design, data collection and analysis, decision to publish, or preparation of the manuscript.
Competing interests: The authors have declared
This man started experiencing visual hallucinations at the age of 80. Visual hallucinations gradually became more frequent and occurred many times during the day. At the time of the visit, he repeatedly described seeing bilateral visual hallucinations with vivid details. The hallu-cinations reported by this patient were well formed, ranging from simple flashes or colored background to more complex with the appearance of common faces, objects and bodies of people, or landscapes. The hallucinations varied in size and color, and were binocular, cover-ing the entire visual field. However, animations (i.e. scenes in motion) were only present in the right visual field. The visual hallucinations were always perceived as pleasant; they generally occurred with the eyes open and did not disappear when closing the eyes and were never accompanied by abnormal perception in any other sensory modality. The patient was fully aware of their unreal nature but he was not able to consciously control their occurrence or content. Based on his clinical history and the diagnostic exams he underwent, a diagnosis of CBS was made by the neurologist. Indeed, the patient fulfilled the four diagnostic criteria for CBS: (1) hallucinations must be complex, repetitive, and persistent; (2) awareness that the hal-lucinations are not real; (3) no additional delusions; and (4) absence of additional hallucina-tions in the other senses [12].
The patient underwent a neuropsychological examination, including the Mattis Dementia Rating Scale [13] and the version for the blind (MoCA-BLIND) [14] of the Montreal Cognitive Assessment (MoCA) [15]. Considering his visual impairments, all these cognitive test materi-als were administered verbally, thereby omitting all vision-specific items.
The patient underwent an ophthalmologic examination with, notably, measurements of visual acuity and visual evoked potentials.
Control samples. We compared the CBS patient’s resting-state functional and structural
MRI data with that of three control groups: 14 late-blind subjects (“LB group”; 7 women; mean age 53± 15 years) and two healthy sighted control groups (“C-CBS group” and “C-LB group”) to respectively compare with the CBS patient and the LB subjects. The C-CBS and the C-LB groups respectively included 13 healthy subjects (4 women; mean age 60± 10 years) and 13 healthy subjects (7 women; mean age 48± 11 years) with normal or normal-corrected vision.
Table 1lists all demographic characteristics and etiologies. All LB subjects developed blindness later in life, after having had a period of a normal visual function, but never experienced any visual hallucinations. All LB subjects had no light perception. The CBS patient and C-CBS group differed significantly for age (t(12) = 2.40;p = .03; Sokal and Rohlf [16] t-test modified for single-case studies). The LB group and C-LB group did not differ significantly for age (t(25) = .94;p = .35) and gender (χ2
= .03;p = .84). None had a history of psychiatric or
neuro-logical episodes. The study was approved by the ethics committee of the Medical School of the University Hospital Centre of Liège (Belgium) for the CBS patients and by the ethics committee of the University of Copenhagen and Frederiksberg (Denmark) for the (C-)LB subjects. Written informed consent was obtained from all the subjects enrolled in the study. The individual in this manuscript has given written informed consent (as outlined in PLOS consent form) to pub-lish these case details. The study was conducted in accordance with the Declaration of Helsinki.
MRI data
Data acquisition. All structural and functional images were acquired on two different
magnetic resonance machines of the same manufacturer (3 Tesla Siemens Magnetom TrioTim scanner (Liège) and Siemens AG scanner (Copenhagen)): the CBS patient and controls (C-CBS group) datasets were acquired at the University Hospital Center of Liège, whereas the LB subjects and controls matched for gender, age and handedness (C-LB group) datasets were acquired at the University of Copenhagen. Ultimately, we obtained two independent samples:
C-CBS group to compare with the CBS patient and C-LB group to compare with LB group (seeTable 1for more details).
A high-resolution T1-weighted image was acquired for the CBS patient and controls at the University Hospital Centre of Liège (T1-weighted 3D gradient echo images using 120 slices, Table 1. Demographic details per subject.
Group Subject Age Gender Etiology of blindness
CBS 1 85 M Retinitis pigmentosa
LB 1 66 M Glaucoma
LB 2 64 M Retinitis pigmentosa
LB 3 51 F Retinal detachment
LB 4 59 F Iris infection, cataract
LB 5 44 F Retinal detachment
LB 6 60 F Retinal detachment
LB 7 79 M Retinal detachment
LB 8 57 M Glaucoma, cataract, retinal detachment
LB 9 40 F Retinoblastoma
LB 10 74 M Eye trauma
LB 11 44 M Retinoschisis
LB 12 25 F Glaucoma, cataract, retinal detachment
LB 13 43 M Retinoblastoma LB 14 39 F Retinal detachment C-CBS 1 52 M -C-CBS 2 60 M -C-CBS 3 62 M -C-CBS 4 63 M -C-CBS 5 61 M -C-CBS 6 70 F -C-CBS 7 60 M -C-CBS 8 31 M -C-CBS 9 65 F -C-CBS 10 56 F -C-CBS 11 57 F -C-CBS 12 72 M -C-CBS 13 66 M -C-LB 1 52 M -C-LB 2 51 F -C-LB 3 50 F -C-LB 4 53 F -C-LB 5 55 F -C-LB 6 56 M -C-LB 7 59 M -C-LB 8 46 F -C-LB 9 36 M -C-LB 10 61 M -C-LB 11 27 M -C-LB 12 55 M -C-LB 13 28 F
-M = male; F = female; CBS = Charles Bonnet syndrome; LB = late blind; C-CBS = control-Charles Bonnet syndrome; C-LB = control-late blind
repetition time = 2300 ms, echo time = 2.47 ms, voxel size = 1×1×1 mm3, flip angle = 9 degrees, field of view = 256×256 mm2) and for LB subjects and controls at the University of Copenha-gen (T1-weighted 3D magnetization-prepared rapid gradient echo sequence “3D MP-RAGE” using 92 slices, repetition time = 1540 ms, echo time = 3.9 ms, voxel size = 0.93×0.93×0.93 mm3, field of view = 256× 256 mm2).
Multislices T2-weighted fMRI images were obtained during 10 minutes in CBS patient and C-CBS by using Echo Planar Imaging sequence with axial slice orientation (300 volumes, 32 slices, voxel size = 3.0× 3.0 × 3.75 mm3
, repetition time = 2000 ms, echo time = 30 ms, flip angle = 90˚, field of view = 384 mm, matrix size (I, J, K) = 64× 64 × 32, delay = 0, slice order = sequential descending). For LB and C-LB, we used Echo Planar Imaging sequence with axial slice orientation (280 volumes for controls and 270 volumes for LB subjects, 42 slices, voxel size = 3.0× 3.0 × 3.0 mm3, repetition time = 2150 ms, echo time = 2.32 ms, flip angle = 90˚, field of view = 192 mm, matrix size (I, J, K) = 64× 64 × 42, delay = 0, slice order = interleaved ascending). All subjects were instructed to keep their eyes closed and to not think of anything in particular. The CBS patient did not hallucinate during the MRI exam. The first three initial volumes were discarded to avoid saturation effects (as described in [17]).
Data pre-processing. Structural (T1-weighted) MRI images in all four datasets were
man-ually reoriented to the anterior commissure/posterior commissure (AC-PC) scheme and seg-mented (i.e., into grey matter (GM), white matter (WM), cerebrospinal fluid (CSF), skull, and soft tissue outside the brain), subsequently normalized using the segmentation and normaliza-tion modules of Statistical Parametric Mapping 8 (SPM8) and VBM/DARTEL, with the stan-dard tissue probability maps and VBM template. The SPM8/VBM8 segmentation was preferred over SPM12 unified segmentation in order to achieve potentially more precise seg-mentation and normalization using high dimensional DARTEL tissue projection.
For each subject, the volumes of the LGN were estimated bilaterally [18]. The LGN receives afferent input from the retina and projects to primary visual cortex through the optical radia-tions. In brief, a ROI-based approach combining an automatic segmentation method [19] with probabilistic maps registered to the Montreal Neurological Institute (MNI) space [20–21] was adopted.
For cortical thickness analysis, T1-weighted images were processed using FreeSurfer image analysis suite v5.1.0 (http://surfer.nmr.mgh.harvard.edu/). Technical details have been described previously [22–23]. Automated cortical parcellation and region of interest definition were performed using the Desikan-Killiany Atlas [24], resulting in mean cortical thickness estimations calculated from all vertices within 34 cortical parcellations per hemisphere.
Functional volumes were first manually pre-coregistered with the structural images, and then preprocessed using SPM8. First, the EPI volumes were corrected for the temporal differ-ence in acquisition among different slices using the slice timing correction module with the reference slice set to the first temporal slice, and then the images were realigned to the mean EPI image for head-motion correction.
The mean EPI image across all realigned volumes was then auto-coregistered to the struc-tural image. Then the strucstruc-tural image was segmented into three tissues: GM, WM and CSF in the subject’s space, producing as a by-product of the segmentation the parameters of the trans-form from the subject’s space to MNI space. This transtrans-form was then used to normalize the structural image, the co-registered EPI images and the segmented tissues. Finally, all the core-gistered and normalized EPI images were smoothed with an isotropic Gaussian kernel (8 mm full-width-at-half-maximum).
A manual inspection of the whole BOLD timeseries motion was conducted from the SPM motion file to exclude any subject where the translational head displacement was greater than 1 mm, or if the rotational displacement was greater than 0.1 radians. With the aim of reducing
loss of signal or whole subjects exclusion due to motion artifacts [25], we used the artifact detection toolbox (NITRC ART,https://www.nitrc.org/projects/artifact_detect/) for artefac-tual volume detection and rejection using a composite motion measure (largest voxel move-ment) with a “liberal” threshold (global threshold 9.0, motion threshold 2.0, use scan-to-scan motion and global signal). With this approach, a volume was defined as an outlier (artefact) if the largest voxel movement detected was above the specified thresholds. We subsequently included outliers in the global mean signal intensity and motion as nuisance regressors (i.e., one regressor per outlier in the first-level general linear model). Thus, the temporal structure of the data was not disrupted.
Several parameters were included in a linear regression using CONN v17F and SPM12 to remove possible spurious variances from the data. These were i) six head motion parameters obtained in the realigning step, ii) non-neuronal sources of noise estimated using the anatomi-cal component-based noise correction method (aCompCor; [26]), iii) the representative sig-nals of no interest from subject-specific white matter and cerebral spinal fluid included the top five principal components from white matter and the top five from cerebral spinal fluid mask [27]. Then the residual time series were linearly detrended (no despiking) and temporally band-pass filtered (0.008–0.09 Hz) using CONN’s denoising procedure.
Statistical analysis. A T1-based VBM analysis of brain structure ( http://dbm.neuro.uni-jena.de/vbm/; executed in MATLAB R2011a Mathworks) was applied to search for potential morphological differences in GM volume, as previously described [17]. The statistical test con-sisted of a two-sample t-test with assumed independence and equal variance, and with an abso-lute threshold masking of 0.1 (implicit and explicit masks were disabled) and without overall grand mean scaling. The analyses were performed considering age, gender, and total intracra-nial volume as covariates. One such test was done separately for each dataset. In the design matrix, a contrast was applied to identify the differences between the CBS patient and C-CBS and then between the LB and C-LB. Because the MRI scans were obtained from two different scanners, the samples were not combined. Results were considered significant at
p-uncor-rected <0.001.
For the average volumes of the LGN, we used a t-test for group comparison.
We used the Single-Bayes procedure [28–29] for statistical analysis of cortical thickness data. In this procedure, a Bayesian inferential method (SingleBayes.exe) was performed to test if the patient’s values are significantly different from the respective values of the LB subjects sample and the controls group. This statistical approach permits to prevent the overestimation of evidence in favor of an effect [30].
We conducted the analysis of the fMRI resting state functional connectivity by using a seed-based correlation analysis (SCA) approach, more specifically seed-to-voxels to cover changes in correlation of the BOLD signal in the whole brain with respect to the specified seed regions. Using SPM12, we used extracts from fMRI BOLD time series from a region of interest (the seed) and measured the temporal correlation between this signal and the time series of all other brain voxels. Two seeds were defined as spheres of 5 mm radius around the peak coordi-nates of the two main default mode network (DMN) nodes (mPFC:−1, 54, 27 and PCC: 0, −52, 27) taken from [31]. We extracted time series from the voxels in each seed region and then averaged them together to define the DMN region. We investigated the visual networks, including secondary visual cortex and associative visual cortex. For each of them, we defined two seeds as 5mm-radius spheres around peak coordinates of the two main nodes taken from the literature: the secondary visual cortex (–6, -78, -3) (6, -78, -3) and the associative visual cortex (–30, -89, 20) (30, -89, 20) [32]. We also investigated the salience network: the dorsolat-eral prefrontal cortex (–38, 52, 10) (30, 48, 22) and the thalamus (–12, -18, 6) (12, -18, 6) [33]. Each group was analyzed separately to avoid biases due to different machines and acquisition
parameters. We used the averaged time series to estimate whole brain positive and negative correlation r maps, and the t-test contrasts. In the design matrix, we applied a contrast to iden-tify the differences between the CBS patient and C-CBS and then between the LB and C-LB groups. Age and gender were further added as regressors.
Statistical results were considered significant with multiple comparison correction at the topological level with non-parametric permutation test cluster-massp-FWE < 0.05 and
pri-mary voxel-wise thresholdp-uncorrected < 0.001 (see [34–35]) using CONN 17f with the gen-eralized permutation of residuals patch.
Results
Neuropsychological and ophthalmological examinations
The Mattis Dementia Rating Scale and the MoCA-BLIND scores were respectively 79/79 and 22/22. These results allow us to consider the patient’s cognitive and global functioning as normal.
The patient was diagnosed with an ophthalmologic disease and revealed retinal atrophy in both eyes. He had also a decompensated corneal grafting in the left eye. He had undergone a cataract operation of both eyes. Flash visual evoked potentials were flat. At the time of the clini-cal assessment the patient could perceive light in both eyes.
MRI results
Structural MRI. The CBS patient showed decreased GM volume in the occipital lobe
(more precisely in the middle occipital gyrus and in the cuneus), in the postcentral gyrus and in the superior parietal lobule, as compared with C-CBS (Fig 1, upper row). In the LB group, we also identified reduced GM areas in the occipital lobe (more precisely in the lingual gyrus and in the middle occipital gyrus) and in the left and right cerebellum, as compared with healthy controls (Fig 1, lower row).
The average volumes of the left and right LGN were respectively 72.2± 36.3 mm3and 94.34± 37.5 mm3in sighted controls, compared to 54.2 mm3and 63.28 mm3in CBS patient (p = .18 for left LGN and p = .06 for right LGN). In LB subjects, the average volumes for the
left and right LGN were respectively 53.47± 26.5 mm3and 58.2± 22.6 mm3. A group compari-son suggested that the LGN volumes did not differ between the CBS patient and LB subjects (for left LGN:p = .48 and for right LGN: p = .38).
Additionally, we evaluated separately the cortical thickness in the CBS patient versus the C-CBS controls and versus those of LB subjects. The CBS patient showed significantly lower cortical thickness than controls in several areas, including visual (e.g., bilateral pericalcarine, cuneus, fusiform gyrus, and lateral occipital), and associative areas (e.g., pars opercularis, supe-rior parietal, supesupe-rior temporal and insula parcels;p < 0.0008, post-hoc Bonferroni correction;
seeTable 2for a complete list).
Significant differences in regional cortical thickness between the CBS patient and LB sub-jects are shown inTable 3. Noteworthy, the CBS patient showed significantly lower cortical thickness than LB subjects in several brain regions, mainly devoted to the processing of multi-modal associative information (e.g., bilateral fusiform, inferior parietal, inferior temporal, lat-eral orbitofrontal, middle temporal, paracentral, pars opercularis, precuneus, superior frontal, superior parietal, and superior temporal parcels;p < 0.0008, post-hoc Bonferroni correction).
Resting-state fMRI. No significant differences were detected between the CBS patient
and C-CBS subjects in DMN connectivity. In contrast, LB subjects showed increased resting-state negative connectivity between the DMN and a cluster including the right occipital
Fig 1. VBM-based grey matter decreases in the CBS patient compared to C-CBS group (top) and in the LB group compared to C-LB group (bottom); multislice view of the regions overlaid on the MNI template;p-uncorrected <0.001.
https://doi.org/10.1371/journal.pone.0219656.g001
Table 2. Cortical thickness differences between CBS patient and controls. Group
Brain regions CBS patient C-CBS group p value
L cuneus 1.27 1.87 .0008 R cuneus 1.27 1.92 .0006 L fusiform 1.70 2.77 .0003 R fusiform 1.59 2.74 .0002 L inferior parietal 1.47 2.50 .00002 R inferior temporal 1.64 2.87 .0001 L lateral occipital 1.48 2.30 .0006 R lateral occipital 1.54 2.32 .0009 L lateral orbitofrontal 1.67 2.64 .0005 L lingual 1.51 2.04 .00005 L middle temporal 1.65 2.90 .00004 L paracentral 1.50 2.38 .0005 L pars opercularis 1.64 2.58 .0005 R pars opercularis 1.49 2.60 .0002 L pars triangularis 1.48 2.46 .00003 L postcentral 1.29 2.13 .0006 L precentral 1.49 2.58 .0002 L precuneus 1.53 2.43 .00003
L rostral middle frontal 1.58 2.41 .0005
R superior frontal 1.53 2.70 .0002 L superior parietal 1.29 2.24 .000007 R superior parietal 1.24 2.22 .00008 L superior temporal 1.61 2.86 .00001 R superior temporal 1.69 2.85 .0005 L supra marginal 1.51 2.62 .0001 L insula 1.90 3.07 .00001 R insula 2.29 3.11 .0006
L = left; R = right; CBS = Charles Bonnet syndrome
fusiform gyrus compared to C-LB group.S1 Figshows the DMN connectivity of both the C-LB and C-CBS groups.
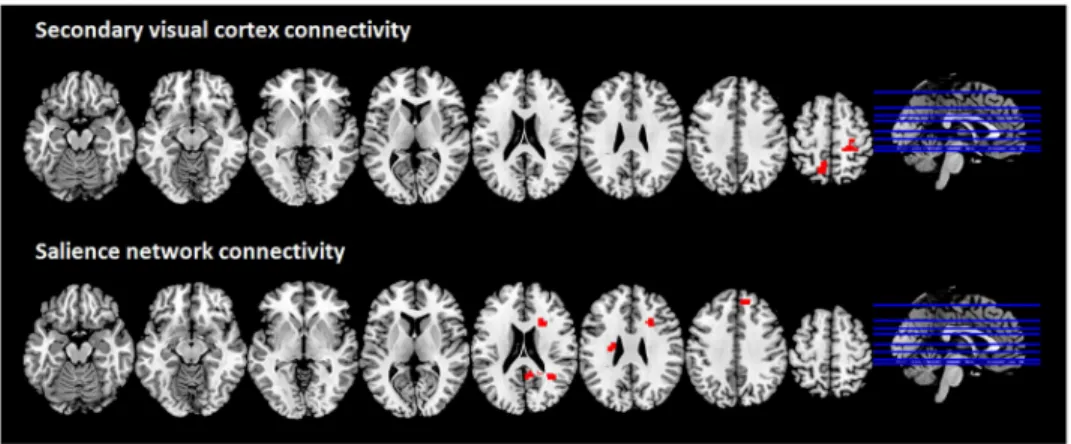
The CBS patient showed increased connectivity as compared to controls between the sec-ondary visual cortex and two clusters in the left precuneus and the right postcentral gyrus (Fig 2, upper row). No differences were detected between LB and their respective controls regarding the secondary visual cortex connectivity.
The CBS patient displayed a significant increase of positive connectivity between the salience network and three clusters compared to the C-CBS group (Fig 2, lower row): the mid-dle temporal gyrus right, the medial frontal gyrus right and the caudate nucleus left. LB Table 3. Cortical thickness differences between CBS patient and LB subjects.
Group
Brain regions CBS patient LB subjects p value
R caudal middle frontal 1.55 2.52 .0001
R cuneus 1.27 1.85 .0004 L fusiform 1.70 2.66 .0004 R fusiform 1.59 2.69 .000004 L inferior parietal 1.47 2.47 .0000008 R inferior parietal 1.53 2.51 .00001 L inferior temporal 1.65 2.84 .0000002 R inferior temporal 1.64 2.89 .000001
L lateral orbito frontal 1.67 2.68 .0001
R lateral orbito frontal 1.89 2.64 .0003
L middle temporal 1.65 2.91 .00006 R middle temporal 1.83 2.95 .00002 L para central 1.50 2.40 .0005 R para central 1.41 2.41 .00007 L pars opercularis 1.64 2.51 .0002 R pars opercularis 1.49 2.46 .00002 L pars triangularis 1.48 2.39 .0004 R posterior cingulate 1.77 2.45 .0007 L pre central 1.49 2.55 .00002 R pre central 1.57 2.48 .0001 L pre cuneus 1.53 2.41 .0001 R pre cuneus 1.54 2.40 .00008
L rostral middle frontal 1.58 2.42 .0004
R rostral middle frontal 1.57 2.37 .00005
L superior frontal 1.67 2.75 .00009 R superior frontal 1.53 2.70 .000008 L superior parietal 1.29 2.19 .00001 R superior parietal 1.24 2.20 .00003 L superior temporal 1.61 2.77 .000008 R superior temporal 1.69 2.78 .000008 L supra marginal 1.51 2.54 .00001 R supra marginal 1.58 2.56 .00009 L insula 1.90 2.95 .00001
L = left; R = right; CBS = Charles Bonnet syndrome; LB = late-blind
subjects showed significant increased positive connectivity between the salience network and a cluster in the right inferior parietal lobule and the right insula. No differences were detected.
Discussion
In the present study, a patient without any history of psychiatric disorders developed visual hallucinations after becoming totally blind was investigated by structural and resting state functional MRI. The patient showed the essential features and conditions of CBS. The aim of this study was to examine purported structural and functional brain changes associated with visual hallucinations and the loss of vision.
In order to disentangle brain modifications due to the late visual loss from those underpin-ning complex visual hallucinations typical of CBS, we included a group of LB subjects without any visual hallucinations. In line with our hypothesis, our CBS case showed regional reduc-tions in cortical thickness when compared to control subjects, encompassing primary visual, associative and multimodal cortices. However, many of these differences disappeared in the comparison of CBS with the LB group, suggesting that these structural alterations are primarily related to blindness. Indeed, when comparing the CBS patient with the LB subjects, only the reductions in cortical thickness in associative and multimodal cortices were significant, sug-gesting a role for these areas in the genesis of visual hallucinations. Moreover, consistent with previous structural imaging studies reporting atrophy in the occipital lobes in CBS patients (e.g., [3,8]), we observed VBM-based GM reduction (after controlling for age, gender, and total intracranial volume) in the middle occipital gyrus and in the cuneus in the studied CBS patient, compared to a control group. This partly differed from the GM reductions found in LB subjects that covered the lingual gyrus and the middle occipital gyrus, as well as the left and right cerebellum, compared to a control group.
In order to investigate if these structural alterations were paralleled by functional alter-ations, we carried out a resting state functional connectivity study. Our analysis showed a func-tional reorganization of the brain connectivity between regions involved in self-awareness and in visual and salience processing, when observing the respective findings obtained with the CBS patient and the LB subjects. The precuneus showed increased connectivity with the sec-ondary visual cortex in the CBS patient. This is consistent with Kazui and colleagues’ [3] study demonstrating hyperactivity in the primary and secondary visual cortices in CBS, assuming Fig 2. Brain regions showing increased functional connectivity with the secondary visual cortex and the salience network in the CBS patient compared to C-CBS group; multislice view of the regions overlaid on the MNI template; topological non-parametric correction at cluster-massFWE <0.05 and primary threshold
p-uncorrected <0.001.
this to be a consequence of deafferentiation [36]. Indeed, these authors suggested a fundamen-tal dysfunction of the secondary visual cortex in CBS, accompanied by transient cortical activa-tion of the inferior lateral temporal cortex (principally the fusiform gyrus region) during the emergence of visual hallucinations [3]. Nonetheless, the causes of the activity and connectivity changes in CBS patients are still unknown.
In this study, we observed an increase of resting-state negative connectivity between the DMN and a cluster including the occipital fusiform gyrus in the LB subjects, whereas no such significant functional connectivity changes were identified between the CBS patient and the associated controls. This might suggest that a functional connectivity reorganization in the visual network is taking place for LB subjects but not in CBS. The fusiform gyrus is known to support hallucinations of faces in CBS patients [37] and other studies demonstrated increased activity in this ventral occipital cortex during visual hallucinations in CBS patients [9]. How-ever, further studies should investigate functional connectivity during resting state (i.e., with-out active hallucinations) in a greater number of CBS patients, in particular in the visual network, to assess the resting state connectivity changes that characterize this population. More generally, the literature reveals that resting state (without hallucinating) can show abnor-mal functioning in subjects who report hallucinatory experiences (see [38] for a review).
The present results offer evidence of cortical network reorganization between the salience network and some specific (but not identical) regions in both the CBS patient and the LB as compared with respective matched sighted controls. Some studies have associated both activity and connectivity changes in the salience network, and more specifically in the dorsal prefrontal cortex, with the presence of phantom percepts (e.g., [39–41]) and the propensity to hallucinate [39,42]. Indeed, this network appears to play a key role in the detection of the salience of exter-nal and interexter-nal stimuli [43]. In our CBS patient, we observed a functional reorganization of the brain connectivity between regions involved in salience processing and some specific regions subserving visual perception and multimodal sensory integration, such as the middle temporal gyrus [44].
It has been debated to which extent CBS could be caused by sensory deprivation as a result of eye deficits or some brain lesions [45]. Some authors have suggested that the loss of vision may lead to deafferentation of the visual association cortex [46], leading to disinhibition and spontaneous development of hallucinations because of visual cortex activation [9]. Another theory, the ‘release phenomenon’ theory, claims that removal of visual input results in reduced cortical inhibition and thus releases percepts stored in the brain, resulting in visual hallucina-tions [47]. In individuals with CBS, visual loss due to ophthalmic pathology leads to a state of sensory deprivation that releases the visual cortex from regulation by externally produced visual stimuli, which may result in hallucinations (i.e., an inappropriate pattern of cortical excitation). The pathophysiology of CBS shares similarities with the phantom limb pain phe-nomenon [48]. Consequently, not only vision deficit, but also dysfunction in the primary and secondary visual systems could be major contributors to the occurrence of visual tions in CBS patients. The reasons why some patients with visual deficits develop hallucina-tions and CBS, and other do not, is yet unknown. No theory can explain why CBS is so rare in the LB population suffering from visual deprivation of the occipital cortex. Also, whether the connectivity changes observed in our CBS patient are theprimum movens to the hallucination
or only a result of them is not clear now.
The present study is not free of limitations. The main limits are represented by the small number of patients (i.e., 1 CBS patient and 14 LB subjects) and the fact that CBS and LB groups were examined using two different scanners. In addition, the LB group include different eye pathologies. For these reasons the current findings cannot be generalized to the entire LB pop-ulation and should be interpreted cautiously. The age difference between the CBS patient and
the comparison groups is also a limitation, however, we used the factor age as a regressor in the present analyses to limit the potential bias. Further studies should investigate functional connectivity in a greater number of CBS patients and with LB subjects acquired on the same scanner; nonetheless, this syndrome is relatively rare. Although hallucinations in CBS are visual in the majority of cases, few CBS patients also report somatosensory (or other modali-ties) hallucinations [49–50], which are worth to be investigated. The presence of hallucinations in other modalities occurring in CBS patients however remains controversial in the literature [49] and it is not clear to what extent eye disease may play a part in their emergence. More gen-erally, further studies are needed to determine a more detailed neurobiological explanation of CBS.
In conclusion, our overall resting state investigation showed brain connectivity changes specific to the CBS case, notably in visual related and salience networks. A functional connec-tivity reorganization following alterations in visual brain structures may contribute to visual hallucinations in CBS. Nonetheless, the explanation of this phenomenon remains incomplete. CBS symptoms can last for many years and have negatives consequences in around a third of CBS population [51], thus a better understanding of this pathology might enhance the health-care provided to this population and their quality of life. From a clinical perspective, a better understanding of this syndrome is essential since, for example, a recent study suggests that patients with CBS may present an increased risk of subsequently developing dementia, when combined with Mild Cognitive Impairment and partial impairment of insight [52]. Indeed, so far the interpretation of the connectivity changes, as well as their clinical significance, is still not understood. The present findings have important implications not only for the more gen-eral understanding of the functioning of the human brain, but also for our understanding of how hallucinations and blindness can change brain function and structure.
Supporting information
S1 Fig. Default mode network (DMN) connectivity in the C-LB group and in the C-CBS group. Cluster-massp-FWE <0.05 and primary threshold p-uncorrected <0.001.
(TIFF)
Acknowledgments
The authors thank the whole staff from the Neurology, Radiodiagnostic and Nuclear Medicine departments, University Hospital of Liege and the patients.
Author Contributions
Conceptualization: Charlotte Martial, Ron Kupers, Steven Laureys, Carol Di Perri.
Formal analysis: Charlotte Martial, Stephen Karl Larroque, Carlo Cavaliere, Carol Di Perri. Investigation: Charlotte Martial, Sarah Wannez, Jitka Annen, Ron Kupers.
Methodology: Charlotte Martial, Stephen Karl Larroque, Carlo Cavaliere, Sarah Wannez, Jitka
Annen.
Supervision: Steven Laureys, Carol Di Perri. Visualization: Charlotte Martial, Carol Di Perri.
Writing – original draft: Charlotte Martial, Stephen Karl Larroque, Carlo Cavaliere, Sarah
References
1. Damas-Mora J, Skelton-Robinson M, Jenner FA. The Charles Bonnet syndrome in perspective. Psy-chological Medicine. 1982; 12: 251–61. PMID:7100349
2. Terao T. The present state of Charles Bonnet syndrome. Psychogeriatrics. 2002; 2: 6–14.
3. Kazui H, Ishii R, Yoshida T, Ikezawa K, Takaya M, Tokunaga H, et al. Neuroimaging studies in patients with Charles Bonnet Syndrome. Psychogeriatrics. 2009; 9: 77–84.https://doi.org/10.1111/j.1479-8301. 2009.00288.xPMID:19604330
4. Rovner BW. The Charles Bonnet syndrome: Visual hallucinations caused by vision impairment. The Psychiatric Consultant. 2002; 57(6): 45–6.
5. Adachi N, Nagayama M, Anami K, Arima K, Matsudal H. Asymmetrical blood flow in the temporal lobe in the Charles Bonnet syndrome: serial neuroimaging study. Behavioural Neurology. 1994; 7: 97–9.
https://doi.org/10.3233/BEN-1994-7209PMID:24487295
6. Chen JJ. Diagnosis and treatment of psychiatric commordity in a patient with Charles Bonnet syndrome. Case Rep Psychiatry. 2014:195847.https://doi.org/10.1155/2014/195847PMID:25431721
7. Kishi T, Uegaki J, Kitani M, Fujimoto A, Naganuma R. The usefulness of single photon emission com-puted tomography in Charles Bonnet syndrome: a case with occipital lobe involvement. General Hospi-tal Psychiatry. 2000; 22: 132–5. PMID:10896496
8. Adachi N, Watanabe T, Matsuda H, Onuma T. Hyperperfusion in the lateral temporal cortex, the stria-tum and the thalamus during complex visual hallucinations: single photon emission computedtomogra-phy findings in patients with Charles Bonnet syndrome. Psychiatry and Clinical Neurosciences. 2000; 54: 157–62.https://doi.org/10.1046/j.1440-1819.2000.00652.xPMID:10803809
9. Ffytche DH, Howard RJ, Brammer MJ, David A, Woodruff P, Williams S. The anatomy of conscious vision: an fMRI study of visual hallucinations. Nature Neuroscience. 1998; 1: 738–742.https://doi.org/ 10.1038/3738PMID:10196592
10. Meppelink AM, de Jong BM, van der Hoeven JH, van Laar T. Lasting visual hallucinations in visual dep-rivation; fMRI correlates and the influence of rTMS. Journal of Neurology, Neurosurgery, and Psychia-try. 2010; 81(11): 1295–6.https://doi.org/10.1136/jnnp.2009.183087PMID:20547615
11. Caras I, Littman N, Abo A. Proceedings: Debilitating Eye Diseases. STEM CELLS Translational Medi-cine. 2014; 20(12): 1393–400.
12. Teunisse RJ, Cruysberg JRM, Verbeek A, Zitman FG. The Charles Bonnet syndrome: A large prospec-tive study in the Netherlands. British Journal of Psychiatry. 1995; 166: 254–7.https://doi.org/10.1192/ bjp.166.2.254PMID:7728372
13. Mattis S. Dementia Rating Scale: Professional Manual. Odessa, FL: Psychological Assessment Resources; 1988.
14. Wittich W, Phillips N, Nasreddine Z, Chertkow H. Sensitivity and specificity of the Montreal Cognitive Assessment modified for individuals who are visually impaired. Journal of Visual Impairment & Blind-ness. 2010; 104(6): 360–8.
15. Nasreddine ZS, Phillips NA, Bedirian V, Charbonneau S, Whitehead V, Collin I, et al. The Montreal Cog-nitive Assessment, MoCA: A brief screening tool for mild cogCog-nitive impairment. Journal of the American Geriatric Society. 2005; 53: 695–9.
16. Sokal RR, Rohlf FJ. Biometry: The Principles And Practice Of Statistics In Biological Research. New York: Freeman; 1995.
17. Di Perri C, Bahri MA, Amico E, Thibaut A, Heine L, Antonopoulos G, et al. Lancet Neurology. 2016; 15 (8): 830–42.https://doi.org/10.1016/S1474-4422(16)00111-3
18. Cecchetti L, Ricciardi E, Handjaras G, Kupers R, Ptito M, Pietrini P. Congenital blindness affects dien-cephalic but not mesendien-cephalic structures in the human brain. Brain Structure and Function. 2016; 221 (3): 1465–80.https://doi.org/10.1007/s00429-014-0984-5PMID:25560311
19. Hernowo AT, Boucard CC, Jansonius NM, Hooymans JM, Cornelissen FW. Automated morphometry of the visual pathway in primary open-angle glaucoma. Investigative ophthalmology & visual science. 2011; 52: 2758–66.
20. Bu¨rgel U, Amunts K, Hoemke L, Mohlberg H, Gilsbach JM, Zilles K. White matter fiber tracts of the human brain: three-dimensional mapping at microscopic resolution, topography and intersubject vari-ability. NeuroImage. 2006; 29: 1092–105.https://doi.org/10.1016/j.neuroimage.2005.08.040PMID:
16236527
21. Eickhoff SB, Stephan KE, Mohlberg H, Grefkes C, Fink GR, Amunts K, et al. A new SPM toolbox for combining probabilistic cytoarchitectonic maps and functional imaging data. NeuroImage. 2005; 25: 1325–35.https://doi.org/10.1016/j.neuroimage.2004.12.034PMID:15850749
22. Fischl B, Salat DH, Busa E, Albert M, Dieterich M, Haselgrove C, et al. Whole brain segmentation: auto-mated labeling of neuroanatomical structures in the human brain. Neuron. 2002; 33: 341–55. PMID:
11832223
23. Fischl B, van der Kouwe A, Destrieux C, Halgren E, Segonne F, Salat DH, et al. Automatically parcellat-ing the human cerebral cortex. Cerebral Cortex. 2004; 14: 11–22.https://doi.org/10.1093/cercor/ bhg087PMID:14654453
24. Desikan RS, Segonne F, Fischl B, Quinn BT, Dickerson BC, Blacker D, et al. An automated labeling system for subdividing the human cerebral cortex on MRI scans into gyral based regions of interest. Neuroimage. 2006; 31: 968–80.https://doi.org/10.1016/j.neuroimage.2006.01.021PMID:16530430
25. Power JD, Mitra A, Laumann TO, Snyder AZ, Schlaggar BL, Petersen SE. Methods to detect, charac-terize, and remove motion artifact in resting state fMRI. NeuroImage. 2014; 84: 320–41.https://doi.org/ 10.1016/j.neuroimage.2013.08.048PMID:23994314
26. Chai XJ, Castanon AN, Ongur D, Whitfield-Gabrieli S. Anticorrelations in resting state networks without global signal regression. Neuroimage. 2012; 59: 1420–8.https://doi.org/10.1016/j.neuroimage.2011. 08.048PMID:21889994
27. Behzadi Y, Restom K, Liau J, Liu TT. A component based noise correction method (CompCor) for BOLD and perfusion based fMRI. Neuroimage. 2007; 37(1): 90–101.https://doi.org/10.1016/j. neuroimage.2007.04.042PMID:17560126
28. Crawford JR, Garthwaite PH. Comparison of a single case to a control or normative sample in neuro-psychology: Development of a Bayesian approach. Cognitive Neuropsychology. 2007; 24: 343–72.
https://doi.org/10.1080/02643290701290146PMID:18416496
29. Molino I, Cavaliere C, Salvatore E, Quarantelli M, Colucci L, Fasanaro AM. Is anterior communicating artery syndrome related to fornix lesions? Journal of Alzheimer’s Disease. 2014; 42(3): S199–204. 30. Wetzels R, Matzke D, Lee MD, Rouder JN, Iverson GJ, Wagenmakers EJ. Statistical evidence in
exper-imental psychology: An empirical comparison using 855 t tests. Perspectives on Psychological Science. 2011; 6: 291–8.https://doi.org/10.1177/1745691611406923PMID:26168519
31. Raichle ME. The restless brain. Brain connectivity. 2011; 1: 3–12.https://doi.org/10.1089/brain.2011. 0019PMID:22432951
32. De Luca M, Beckmann CF, De Stefano N, Matthews PM, Smith SM. fMRI resting state networks define distinct modes of long-distance interactions in the human brain. Neuroimage. 2006; 29: 1359–67.
https://doi.org/10.1016/j.neuroimage.2005.08.035PMID:16260155
33. Seeley WW, Menon V, Schatzberg AF, Keller J, Glover GH, Kenna H, et al. Dissociable intrinsic con-nectivity networks for salience processing and executive control. Journal of Neuroscience. 2007; 27: 2349–56.https://doi.org/10.1523/JNEUROSCI.5587-06.2007PMID:17329432
34. Chumbley JR, Flandin G, Seghier ML, Friston KJ. Multinomial inference on distributed responses in SPM. Neuroimage. 2010; 53: 161–70.https://doi.org/10.1016/j.neuroimage.2010.05.076PMID:20570739
35. Chumbley J, Friston KJ. False discovery rate revised: FDR and topological inference using Gaussian random fields. Neuroimage. 2009; 44: 62–70.https://doi.org/10.1016/j.neuroimage.2008.05.021PMID:
18603449
36. Oso´rio E, Bastos-Leite AJ, Brandão I. Resting-state functional magnetic resonance imaging (fMRI) in charles bonnet syndrome. European Psychiatry. 2012; 27(1): 1.
37. Blom JD. A Dictionary of Hallucinations. Springer; 2010.
38. Whitfield-Gabrieli S, Ford JM. Default mode network activity and connectivity in psychopathology. Annual Review of Clinical Psychology. 2012; 8: 49–76. https://doi.org/10.1146/annurev-clinpsy-032511-143049PMID:22224834
39. Lewis DA, Curley AA, Glausier JR, Volk DW. Cortical parvalbumin interneurons and cognitive dysfunc-tion in schizophrenia. Trends in Neuroscience. 2012; 35(1): 57–67.
40. Vanneste S, Plazier M, der Loo EV, de Heyning PV, Congedo M, De Ridder D. The neural correlates of tinnitus-related distress. NeuroImage. 2010; 52: 470–80.https://doi.org/10.1016/j.neuroimage.2010.04. 029PMID:20417285
41. Vanneste S, De Ridder D. Stress-related functional connectivity changes between auditory cortex and cingulate in tinnitus. Brain Connectivity. 2015; 5: 371–83.https://doi.org/10.1089/brain.2014.0255
PMID:25611454
42. Sommer IE, Diederen KM, Blom JD, Willems A, Kushan L, Slotema K, et al. Auditory verbal hallucina-tions predominantly activate the right inferior frontal area. Brain. 2008; 131: 3169–77.https://doi.org/10. 1093/brain/awn251PMID:18854323
43. Menon V, Uddin LQ. Saliency, switching, attention and control: A network model of insula function. Brain Structure and Function. 2010; 214: 655–67.https://doi.org/10.1007/s00429-010-0262-0PMID:
44. Onitsuka T, Shenton ME, Salisbury DF, Dickey CC, Kasai K, Toner SK, et al. Middle and inferior tempo-ral gyrus grey matter volume abnormalities in chronic schizophrenia: An MRI study. American Journal of Psychiatry. 2004; 161(9): 1603–11.https://doi.org/10.1176/appi.ajp.161.9.1603PMID:15337650
45. Teunisse RJ, Cruysberg JR, Hoefnagels WH, Verbeek AL, Zitman FG. Visual hallucinations in psycho-logically normal people: Charles Bonnet’s syndrome. Lancet. 1996; 347: 794–7.https://doi.org/10. 1016/s0140-6736(96)90869-7PMID:8622335
46. Berrios GE, Brook P. The Charles Bonnet Syndrome and the problems of visual perceptual disorders in the elderly. Age and Ageing. 1982; 11: 17–23.https://doi.org/10.1093/ageing/11.1.17PMID:7041567
47. Cogan D. Visual hallucinations as release phenomena. Albrecht Von Graefes Arch Klin Exp Ophthal-mol. 1973; 188: 139–50. PMID:4543235
48. Schultz G, Melzack R. The Charles Bonnet syndrome: ‘Phantom visual images’. Perception. 1991; 20: 809–25.https://doi.org/10.1068/p200809PMID:1816537
49. Hori H, Terao T, Nakamura J. Charles Bonnet syndrome with auditory hallucinations: a diagnostic dilemma. Psychopathology. 2001; 34: 164–6.https://doi.org/10.1159/000049301PMID:11316964
50. O’Reilly R, Chamberlaine C. Charles Bonnet syndrome: incidence and demographic and clinical fea-tures. The Canadian Journal of Psychiatry. 1996; 41: 259–60. PMID:8726795
51. Cox TM, Ffytche DH. Negative outcome Charles Bonnet Syndrome. British Journal of Ophtalmology. 2014; 98(9): 1236–9.
52. Russell G, Harper R, Allen H, Baldwin R, Burns A. Cognitive impairment and Charles Bonnet syndrome: a prospective study. International Journal of Geriatric Psychiatry. 2018; 33: 39–46.https://doi.org/10. 1002/gps.4665PMID:28117918