HAL Id: hal-01233228
https://hal-amu.archives-ouvertes.fr/hal-01233228
Submitted on 24 Nov 2015
HAL is a multi-disciplinary open access
archive for the deposit and dissemination of
sci-entific research documents, whether they are
pub-lished or not. The documents may come from
teaching and research institutions in France or
abroad, or from public or private research centers.
L’archive ouverte pluridisciplinaire HAL, est
destinée au dépôt et à la diffusion de documents
scientifiques de niveau recherche, publiés ou non,
émanant des établissements d’enseignement et de
recherche français ou étrangers, des laboratoires
publics ou privés.
ozonolysis of α-pinene: effects of ozone, light and
temperature
C Denjean, P Formenti, B Picquet-Varrault, M Camredon, E Pangui, P Zapf,
Y Katrib, C Giorio, A Tapparo, B Temime-Roussel, et al.
To cite this version:
C Denjean, P Formenti, B Picquet-Varrault, M Camredon, E Pangui, et al.. Aging of secondary organic
aerosol generated from the ozonolysis of α-pinene: effects of ozone, light and temperature. Atmospheric
Chemistry and Physics, European Geosciences Union, 2015, 15, pp.883-897.
�10.5194/acp-15-883-2015�. �hal-01233228�
www.atmos-chem-phys.net/15/883/2015/ doi:10.5194/acp-15-883-2015
© Author(s) 2015. CC Attribution 3.0 License.
Aging of secondary organic aerosol generated from the ozonolysis
of α-pinene: effects of ozone, light and temperature
C. Denjean1,2, P. Formenti1, B. Picquet-Varrault1, M. Camredon1, E. Pangui1, P. Zapf1, Y. Katrib1, C. Giorio3,*, A. Tapparo3, B. Temime-Roussel4, A. Monod4, B. Aumont1, and J. F. Doussin1
1Laboratoire Interuniversitaire des Systèmes Atmosphériques (LISA), UMR-CNRS 7583, Université Paris-Est-Créteil
(UPEC) et Université Paris Diderot (UPD), Institut Pierre Simon Laplace (IPSL), Créteil, France
2Leibniz Institute for Tropospheric Research (TROPOS), Permoserstr. 15, 04318 Leipzig, Germany 3Dipartimento di Scienze Chimiche, Università degli Studi di Padova, Via Marzolo 1, 35131 Padova, Italy 4Aix Marseille Université, CNRS, LCE FRE 3416, 13331 Marseille, France
*now at: Department of Chemistry, University of Cambridge, Lensfield Road, CB2 1EW Cambridge, UK Correspondence to: C. Denjean (denjean@tropos.de)
Received: 18 July 2014 – Published in Atmos. Chem. Phys. Discuss.: 1 September 2014 Revised: 4 December 2014 – Accepted: 19 December 2014 – Published: 26 January 2015
Abstract. A series of experiments was conducted in the CE-SAM (French acronym for Experimental Multiphasic Atmo-spheric Simulation Chamber) simulation chamber to investi-gate the evolution of the physical and chemical properties of secondary organic aerosols (SOAs) during different forcings. The present experiments represent a first attempt to com-prehensively investigate the influence of oxidative process-ing, photochemistry, and diurnal temperature cycling upon SOA properties. SOAs generated from the ozonolysis of α-pinene were exposed under dry conditions (< 1 % relative hu-midity) to (1) elevated ozone concentrations, (2) light (un-der controlled temperature conditions) or (3) light and heat (6◦C light-induced temperature increase), and the resultant changes in SOA optical properties (i.e. absorption and scat-tering), hygroscopicity and chemical composition were mea-sured using a suite of instrumentation interfaced to the CE-SAM chamber. The complex refractive index (CRI) was de-rived from integrated nephelometer measurements of 525 nm wavelength, using Mie scattering calculations and measured number size distributions. The particle size growth factor (GF) was measured with a hygroscopic tandem differential mobility analyzer (H-TDMA). An aerosol mass spectrome-ter (AMS) was used for the despectrome-termination of the f44/ f43and
O : C ratio of the particles bulk.
No change in SOA size or chemical composition was ob-served during O3and light exposure at constant temperature;
in addition, GF and CRI of the SOA remained constant with
forcing. On the contrary, illumination of SOAs in the absence of temperature control led to an increase in the real part of the CRI from 1.35 (±0.03) to 1.49 (±0.03), an increase of the GF from 1.04 (±0.02) to 1.14 (±0.02) and an increase of the
f44/ f43ratio from 1.73 (±0.03) to 2.23 (±0.03). The
simu-lation of the experiments using the master chemical mecha-nism (MCM) and the Generator for Explicit Chemistry and Kinetics of Organics in the Atmosphere (GECKO-A) shows that these changes resulted from the evaporation of semi-volatile and less oxidized SOA species induced by the rel-atively minor increases in temperature (∼ 6◦C). These sur-prising results suggest that α-pinene–O3SOA properties may
be governed more by local temperature fluctuations than by oxidative processing and photochemistry.
1 Introduction
Atmospheric aerosols influence climate directly by altering the absorption and scattering of solar and terrestrial radiation (Haywood and Ramaswamy, 1998) and indirectly by chang-ing cloud properties (Lohmann and Feichter, 2005). One of the major uncertainties in estimating the aerosol radiative effect is associated with the contribution of secondary or-ganic aerosols (SOAs). SOAs are formed by condensation of species formed during gas-phase oxidation of volatile or-ganic compounds (VOCs) and are a major constituent of
at-mospheric organic aerosol Kanakidou et al., 2005; Turpin and Huntzicker, 1995; Zhang et al., 2007). During their at-mospheric lifetime, which ranges from 48 to 72 h (Wagstrom and Pandis, 2009), their physical and chemical properties do not stay constant but rather evolve in response to local atmospheric conditions. For example, studies have shown that SOAs can grow by condensation of low volatility oxi-dized species (Ellison et al., 1999) and by cloud processing (Cocker et al., 2001; Ervens and Volkamer, 2010; Volkamer et al., 2009). SOAs can also be oxidized by gas-phase ox-idants (Kalberer, 2004; Gao et al., 2004), undergo chemi-cal reactions in the particle phase (Kalberer, 2004; Gao et al., 2004) or partially evaporate (Warren et al., 2009). These changes in aerosol properties have also been observed in the field; for example, more oxidized, less volatile and more hy-groscopic SOAs are typically observed in remote areas as a result of continuous aging in the atmosphere (Jimenez et al., 2009; Ng et al., 2011; Rudich et al., 2007). Since SOA contains a wide variety of organic compounds, which vary in terms of their size, structure, functionality and oxidation state (Kroll and Seinfeld, 2008; Jimenez et al., 2009; de Gouw et al., 2005; Hallquist et al., 2009), the processes associated with SOA aging are very complex.
Experiments performed in simulation chambers have sig-nificantly improved our understanding of the SOA aging pro-cesses (Donahue et al., 2012; Qi et al., 2012; Yasmeen et al., 2012). In order to provide modellers with accurate param-eters for SOA aging in the atmosphere, these experiments must be atmospherically relevant (Kourtchev et al., 2014). While the O : C ratio of laboratory-generated SOAs is similar to that of freshly formed ambient SOAs, it is generally lower than that of aged ambient SOAs (Ng et al., 2010). In addi-tion, while the representation of SOAs in chemical transport models based on parameterization of chamber data showed a good agreement with nighttime SOA concentrations (in a rural site near Rotterdam, the Netherlands), an underpredic-tion of SOA concentraunderpredic-tions occurred during the day (Li et al., 2013).
Research has shown that the oxidative aging of SOAs in the atmosphere has a major influence on its properties. For example, studies have shown that highly oxygenated or-ganic particles are likely to have a higher hygroscopicity and cloud condensation nuclei (CCN) activity than freshly emit-ted particles, due to the increased polarity and solubility of their constituents (Massoli et al., 2010; Jimenez et al., 2009; Chang et al., 2010; Duplissy et al., 2011). Oxidative aging has also been shown to lead to changes in the real part of the complex refractive index (CRI) of SOAs (Cappa et al., 2011; Lambe et al., 2013; Flores et al., 2014), and to an in-crease in its UV absorption via the formation of additional carbonyl compounds and oligomeric products (Sareen et al., 2013; Nozière and Esteve, 2005; Shapiro et al., 2009; Lambe et al., 2013). To date, laboratory studies have primarily fo-cused on oxidative aging mediated by the heterogeneous re-active uptake of OH radical (Rudich et al., 2007; George and
Abbatt, 2010; Smith et al., 2009). On the other hand, oxida-tive aging by O3has received less attention.
Light exposure has also been shown to influence SOA properties; through photodissociation of molecules, such as carbonyls and organic peroxides, either in the gas or the par-ticle phase, it has been shown to induce a decrease in SOA mass concentration (Kroll et al., 2006; Bateman et al., 2011). There are also indications of significant photolytic process-ing of carbonyl compounds in aerosols durprocess-ing long-range transport (Hawkins and Russell, 2010). In addition, labo-ratory studies have revealed that photochemical processes alter the chemical composition of SOAs (Tritscher et al., 2011; Cappa et al., 2011; Qi et al., 2012; George and Abbatt, 2010; Donahue et al., 2012) and modify its hydrophilicity (Tritscher et al., 2011; George and Abbatt, 2010; George et al., 2009), optical properties (Cappa et al., 2011) and volatil-ity (Tritscher et al., 2011). In these studies, H2O2was used as
a photolytic OH precursor. Since this OH source requires the use of UV light, these experiments did not allow for the in-dividual effects of heterogeneous reactions by OH and direct photolysis on SOA properties to be distinguished.
SOA properties can also be affected by local temperature variations via the evaporation of volatile products. A number of studies have used thermodenuder-based techniques to in-vestigate the volatility of SOAs and to determine the effect of temperature on SOA properties (Asa-Awuku et al., 2008; Huffman et al., 2009; Cappa and Wilson, 2011). Volatile tan-dem differential mobility analyzers (V-TDMAs) have been used to measure the shrinkage of monodisperse particles after heating (Cappa and Wilson, 2011; Salo et al., 2011). In these studies, particles were exposed to elevated temperatures (up to 300◦C) for a short time. It has been shown, however, that
SOA exhibits a significantly slower response to changes in temperature than that predicted by models for liquid droplets (Cappa and Wilson, 2011). Recently, it has been suggested that SOA could be in an amorphous semi-solid or amorphous solid (glassy) state under dry conditions (Renbaum-Wolff et al., 2013; Saukko et al., 2012; Denjean et al., 2014b), which could limit the volatilization kinetics of the aerosol.
This study focuses on the SOA formed from the ozonolysis of α-pinene, which is an important source of SOAs on both regional and global scales (Guenther et al., 1995; Hallquist et al., 2009). In our companion paper (Denjean et al. 2014b), we explored the evolution of the physical, chemical, optical and hygroscopic properties of α-pinene–O3SOAs during the first
hours after its formation. However, Wang et al. (2011) have shown that particle lifetime can vary from 10 h to 4 days in the CESAM simulation chamber. CESAM is a powerful tool for the study of SOAs over longer timescales corresponding to their lifetime in the atmosphere (Yasmeen et al., 2012). In the present work, we investigate in the same chamber the effects of (i) additional ozone exposure, (ii) light exposure and (iii) temperature variation on the chemical composition, hygroscopicity and optical properties of α-pinene–O3SOA,
2 Methods
2.1 CESAM atmospheric simulation chamber
The present experiments were performed in the CESAM (French acronym for Experimental Multiphasic Atmo-spheric Simulation Chamber) atmoAtmo-spheric simulation cham-ber, which has previously been described in detail by Wang et al. (2011). In brief, CESAM is a stainless-steel chamber with a volume of 4.2 m3. Chamber illumination is accomplished using the borosilicate-filtered output of three high-pressure arc xenon lamps (4 kW, XPO 4000 W/HS, OSRAM), which provides a good reproduction of the solar energy distribution at the Earth’s surface over the 290–700 nm wavelength re-gion. The inner walls of the chamber are polished in order to provide good reflection inside the chamber and thus enhance the radiation homogeneity. During our experiments, the NO2
photolysis frequency JNO2 within the chamber was
approxi-mately 3 × 10⁻³s−1, which corresponds to a solar zenith an-gle of ∼ 70◦ (Carter et al., 2005). The simulation chamber was maintained at room temperature (±1◦C) using a refrig-erating liquid (70 % water / 30 % ethylene glycol), which was circulated in the double walls of the chamber. Temperature and relative humidity (RH) are monitored with a transmit-ter (HMP234, Vaisala) equipped with a thin-film capacitive humidity sensor (HUMICAP®, Vaisala). During our experi-ments, the temperature accuracy is ±0.1◦C at 20◦C and the
RH accuracy is ±1.9 % (up to 90 % RH). 2.2 Experimental details
Prior to each experiment, the chamber was evacuated to a secondary vacuum (typical pressure ∼ 4 × 10⁻⁴mbar) and
kept under vacuum overnight. The chamber was then filled to atmospheric pressure with a mixture of 200 mbar of oxy-gen (Air Liquide, ALPHAGAZ™class 1, purity 99.9 %) and 800 mbar of nitrogen produced from the evaporation of a pressurized liquid nitrogen tank (Messer, purity > 99.995 %, H2O < 5 ppm). The background conditions were typically:
particles concentration < 0.1 µg m−3, ozone mixing ratio < 5 ppb, gas-phase organics < 5 ppb and RH < 1 %. To avoid contamination, a slight overpressure of about 5 mbar with respect to the atmospheric pressure was maintained dur-ing each experiment by adddur-ing nitrogen (Messer, purity > 99.995 %, H2O < 5 ppm).
All aging experiments were carried out under the same ini-tial conditions with α-pinene and ozone reacting in the dark, with neither seeds nor OH scavenger. O3 was generated in
an O2flow using a commercial dielectric ozone SOA
gen-erator (MBT 802N, Messtechnik GmbH, Stahnsdorf, Ger-many) and introduced to the chamber through an injection port. Quantification of α-pinene was performed by evaporat-ing precisely measured amounts of the terpene into a glass bulb held under vacuum. When the O3concentration within
the chamber reached ∼ 250 ppb, α-pinene (Aldrich, 98 %)
was flushed from the bulb into the chamber in a flow of oxy-gen to a concentration of ∼ 200 ppb within the chamber. In all experiments, SOAs, formed directly after α-pinene injec-tion, and its precursors were essentially consumed after 4 h of reaction.
In our companion paper, we observed changes in the ox-idative degree and optical properties during the formation of SOAs, but these changes ceased after 9 h of reaction (Den-jean et al., 2014b). In the present study, therefore, SOAs were allowed to evolve for 14 h prior to simulating atmospheric processing, which was in turn conducted over a period of 6 h. Three different aging regimes were applied after 14 h of
α-pinene ozonolysis: (1) 700 ppb of ozone was introduced into the simulation chamber, (2) SOAs were exposed to light for 6 h in the absence of temperature control, during which time the temperature increased by ∼ 6◦C and (3) SOAs were
exposed to light for 6 h under controlled temperature condi-tions (±1◦C). For comparison purposes, control experiments
were performed: in these experiments, SOAs were allowed to remain in the chamber for 20 h under dark conditions. The specific experimental conditions associated with each aging regime are shown in Table 1. As discussed in our compan-ion paper (Denjean et al., 2014b), the variatcompan-ion of SOA mass concentration between the experiments was attributed to dif-ferent concentrations of α-pinene injected to the chamber. Despite this, the chemical, optical and hygroscopic proper-ties of SOA were found to be very similar between the ex-periments. Therefore, the experiments were considered to be comparable for studying the effect of forcing on SOA prop-erties.
During these experiments, the concentrations of α-pinene, ozone and VOCs were monitored using a Fourier transform infrared spectrometer (FTIR) from Bruker GmbH (Ettlingen, Germany) coupled to a multi-reflection cell with an optical path of 192 m. During the different forcings, the concentra-tions of gas-phase compounds were found to be below the detection limit. Ozone was also measured with a commercial instrument (Horiba APOA 370, Kyoto, Japan), with a detec-tion limit of 0.2 ppb and a precision of 0.1 ppb.
2.3 Measurement of SOA properties 2.3.1 Size distribution
SOA number size distributions between 14 and 505 nm were monitored using a scanning mobility particle sizer (SMPS; DMA Model 3080, CPC Model 3010; TSI) operated at flow rates of 3/0.3 Lpm (sheath flow/aerosol sample flow). In-strument calibration was conducted using polystyrene latex spheres (PSL) (Duke Scientific). Since the PSL diameters measured during calibration were ∼ 10 % larger than the cer-tified PSL diameters (for 100 nm PSL samples), a correction factor was applied to all measurements. Corrections for par-ticle loss by diffusion in the SMPS tubing and the contribu-tion of multiply charged particles were made using the SMPS
Table 1. Summary of experimental conditions.
Forcing details
Type of forcing Run Cmt =0a [O3]t =0b Lights on Tt =0/Tt =6 hc µg m−3 (ppb) (min) (◦C) E160411 50.4 0 0 20.5/22.3 Control E260411 112.5 0 0 20.4/21.3 experiments E301111 36.5 0 0 18.4/18.9 E091211 42.5 0 0 17.2/18.3 O3 E021211 57.8 680 0 18.1/17.7 exposure E071211 48.1 630 0 17.1/16.9
Light ex- E200411 78.0 0 348 21.4/27.9
posure with E281111 29.8 0 358 17.2/23.2 increasing E051211 50.5 0 346 16.4/22.7 temperature E120312 117 0 350 20.7/25.4
Light E030512 80.0 0 354 21.4/21.9
exposure E060512 84 0 361 19.8/20.1
aAerosol mass concentration estimated from the aerosol volume concentration corrected from dilution and
by assuming a density of 1.2 g cm−3.
bOzone concentrations determined using FTIR spectroscopy. cTemperature before forcing/temperature after forcing.
software (Aerosol Instrument Manager, version 9, TSI). The number size distribution was used to obtain SOA mass con-centrations, assuming homogeneous spherical particles and an effective density of 1.2 g m−3, as determined by Shilling et al. (2008), Saathoff et al. (2009) and Denjean et al. (2014b). 2.3.2 Chemical composition
SOA chemical composition was analyzed using a high-resolution time-of-flight aerosol mass spectrometer (HR-ToF-AMS, Aerodyne) (DeCarlo et al., 2006). Instrumental and data treatment details are given in our companion pa-per (Denjean et al., 2014b), and thus will be described only briefly here. The HR-ToF-AMS was used under standard conditions (vaporizer at 600◦C and electron ionization at 70 eV). The instrument was switched between two modali-ties: a single-reflectron configuration (V-mode), which offers higher sensitivity but lower resolving power (up to ∼ 2100 at
m/z 200), and a double-reflectron configuration (W-mode), which provides a higher resolving power (up to ∼ 4300 at
m/z200) but a lower sensitivity (De Carlo et al., 2006). De-fault collection efficiencies (CEs) and relative ionization ef-ficiencies (RIEs) were used for quantification of SOA com-position. High-resolution analysis was performed using V-mode data, by integrating each CxHyOz ion in the mass
range 12–180 m/z; W-mode data were used only to check for possible interferences. The method is based on the RIEs of molecules containing C, H and O atoms. The sum of the ion signal intensities from all fragments was used to estimate the O : C ratio of the SOA, and thus its degree of oxidation. Air interferences were removed by adjusting the
fragmenta-tion table (Aiken et al., 2007; Allan et al., 2004). Addifragmenta-tional modification of the fragmentation table was made for organic H2O+as suggested by Chen et al. (2011). The default
frag-mentation table derives the contribution from fragfrag-mentation of organic compounds (dehydration) to the ion H2O+as
or-ganic H2O+=0.225∗CO+2, considering that the measured
excess is due to the interference of water. Since the exper-iments were run under very dry conditions (RH < 1 %), the ion H2O+ has been totally assigned to fragmentation of
or-ganic compounds which corresponds to a oror-ganic H2O+to
CO+2 ratio of 0.8–1:1. Similar organic H2O+ to CO+2 were
obtained in previous studies of α-pinene ozonolysis (Chen et al., 2011; Chhabra et al., 2010). Measurement uncertainties of O : C were estimated to be ±30 %, as determined by Aiken et al (2007).
2.3.3 Optical properties
SOA optical properties were characterized by combining data obtained from an integrating nephelometer (Model M9003, Ecotech), a spectral aethalometer (Model AE31, Magee Scientific) and the SMPS described above. The in-tegrating nephelometer measured the scattering coefficient (σscatt)of 525 nm wavelength, as well as the temperature and
relative humidity of the incoming airflow, and was calibrated prior to the experiments using filtered air and CO2. The
neph-elometer collected light only from particles at scattering an-gles between 10◦and 170◦. Measured scattering coefficients were corrected for this angular truncation using Mie calcu-lations, which were performed using the measured SMPS size distribution. The aethalometer measured the SOA
ab-sorption coefficient at 7 wavelengths (370, 470, 520, 590, 660, 880 and 950 nm) by measuring the increase in atten-uation of transmitted light through its quartz fiber filter as a function of particle exposure time. In order to avoid arte-facts from the adsorption of ozone and VOCs on the filter, a charcoal denuder was installed upstream of the aethalometer (Weingartner et al., 2003). Measurements of light attenuation were corrected for aerosol scattering effects according to the method described by Collaud Coen et al. (2010) and using the parameters obtained by Denjean et al. (2014a, 2014b) for
α-pinene–O3SOAs.
These measurements were ultimately used to calculate the real and imaginary parts of the CRI, which together describe the scattering and absorbing characteristics of SOAs. The CRI retrieval procedure employed has been described and validated in Denjean et al. (2014a). In brief, the CRI of SOAs was retrieved at 525 nm by comparing the measured scatter-ing and absorbscatter-ing coefficients (σscat and σabs,respectively)
with those obtained from Mie scattering calculations (Bohren and Huffman, 1983) performed using the measured number size distribution. The absolute error associated with the real CRI was ±0.03 (Denjean et al., 2014b).
2.3.4 Hygroscopic properties
SOA hygroscopic properties were analyzed with a custom-built hygroscopic tandem differential mobility analyzer (H-TDMA), which is described in detail in Denjean et al. (2014a). The first differential mobility analyzer (DMA) was used to select particles with a mobility diameter of 200 nm, which were then humidified at a constant RH of 90 ± 1 % (residence time ∼ 15 s). The second DMA, which was coupled to a CPC, measured the humidified size distri-bution (with respect to the mobility diameter). Both DMAs were calibrated using monodisperse PSL particles (Duke Sci-entific) with size diameters of 70, 100, 200 and 300 and 500 nm. These size distributions were fitted to log-normal size distributions to obtain the dry geometric mean diame-ter, Dp,m(dry), and the geometric mean diameter of the
hu-midified aerosol, Dp,m (90 % RH). These values were used
to obtain the size growth factor (GF), which is defined as the ratio of Dp,m (90 % RH) to Dp,m (dry). The uncertainties in
the calculated GF are associated with uncertainties in par-ticle size distributions arising from DMA classification and calibration, as well as with uncertainties in the estimation of Dp,mfrom size distributions, and are estimated to ±0.02.
Prior to each experiment, the experimental set-up was vali-dated by comparing measurements of the GF of ammonium sulfate particles to those predicted by Köhler theory (Den-jean et al., 2014a).
2.4 Modelling SOA formation and aging
In order to assist in the interpretation of experimental results, the α-pinene ozonolysis experiments were simulated using a
box model that included the MCM (version 3.1) (Saunders et al., 2003) and the Generator for Explicit Chemistry and Kinetics of Organics in the Atmosphere (GECKO-A) (Au-mont et al., 2005). The MCM v3.1 oxidation scheme for α-pinene contains 329 organic species and 973 reactions. The GECKO-A chemical scheme for α-pinene oxidation, which provides a more detailed description of the gaseous oxida-tion of organic species and takes into account minor reacoxida-tion pathways not considered by the MCM, involves 5.7 × 10⁴ or-ganic species reacting according to 1.7 × 10⁶reactions (Val-orso et al., 2011). Both models simulate gas–particle parti-tioning in terms of equilibria between the gas phase and an ideal liquid homogeneous condensed phase (Camredon et al., 2007).
Vapour pressures and boiling points for secondary organic species were estimated using the methods developed by Nan-noolal et al. (2004, 2008), as they have been shown to pro-vide the most reliable estimates for the purpose of SOA for-mation (Barley and McFiggans, 2010). Accretion, oxidation and photolysis in the condensed phase were not taken into ac-count in this investigation in the models. In addition, recent studies (Renbaum-Wolff et al., 2013; Saukko et al., 2012; Denjean et al., 2014b) suggest that α-pinene-O3 SOA
vis-cosity increases with aging. Due to possible kinetic limita-tions, heterogeneous chemistry and particle-phase reactions can be limited in highly viscous aerosol. The effect of vis-cosity on rate constants were not taken into account in the current MCM and Gecko-A models.
Time integration of the chemical schemes was solved us-ing the two-step solver (Verwer et al., 1994, 1996). The gas– particle partitioning module was solved using the iterative method described in Pankow (2008). Simulations were ini-tialized at a time point corresponding to α-pinene injection. This injection was implemented in the model as a constant flux over the injection time period that reproduced the ob-served concentration. Dilution within the chamber (arising from the periodical injection of N2 to compensate for
in-strumental sampling flows) was described as a measurement-constrained first-order process and applied in the simulations to both gas and aerosols. The temperature used in the simu-lations was that observed in the CESAM chamber during the experiments. Ozone-wall loss is significant in the CESAM chamber (Wang et al., 2011). The ozone loss rate employed in the simulations, therefore, was adjusted for each experi-ment in order to reproduce its measured decay.
3 Results
3.1 Changes in SOA size distribution during simulated atmospheric processing
Figure 1 shows the temporal evolution of SOA mass con-centrations (normalized to the mass concentration at the be-ginning of each aging experiment and corrected for dilution
Figure 1. Temporal evolution of SOA mass concentrations
(nor-malized to the mass concentration at the beginning of each forcing) during and after simulated atmospheric processing. In the control experiment (blue symbols), SOA was left to evolve in the chamber under dark conditions. In the O3aging experiments (green), SOA was exposed to an excess of ozone (∼ 700 ppb) under constant tem-perature conditions. In the photochemical aging experiments, SOA was exposed to light for 6 h, either under constant temperature con-ditions (yellow) or with light-induced heating (red). Here, the initial time t = 0 corresponds to the beginning of simulated aging, which was commenced after SOA was allowed to form and stabilize for 14 h.
within the chamber) during and after simulated atmospheric processing. As shown in this figure, the SOA mass concen-trations in the control experiments decreased by ∼ 15 % over the 6 h duration of the experiment. Since these measurements were performed after the total consumption of O3, this mass
decrease cannot be attributed to O3-induced fragmentation
reactions. It is thus probable that the SOA mass decrease ob-served in the control experiments arose via losses of particle and gaseous compounds to the chamber walls. Similar be-haviour was observed when SOA was exposed to ozone and to light under controlled temperature conditions, which sug-gests that these forcings did not lead to significant fragmen-tation or functionalization. On the contrary, exposure of SOA to light and increasing temperature led to a 40 % loss in total SOA mass concentration and, as shown in Fig. 2, to a change in the SOA number size distribution: as the temperature in-creased from 20◦C to 26◦C, the geometric mean diameter of the normalized SOA number size distribution decreased from 286 nm to 249 nm, which also indicates that significant evaporation of SOA particles occurred.
3.2 Changes in SOA optical and hygroscopic properties during simulated atmospheric processing
Since the CRI is related to the aerosol chemical composition, density, molecular weight and polarization (Liu and Daum,
Figure 2. Temporal evolution of SOA number size distribution
(normalized to the total number concentration) (a) during pho-tochemical aging in the absence of temperature control (experi-ment E120312) and (b) during a control experi(experi-ment (experi(experi-ment E160411). The temporal evolution of the median diameter during photochemical aging in the absence of temperature control (exper-iments E201411, E281111, E051211 and E120312) and during a control experiment (Experiment E160411) is shown in (c).
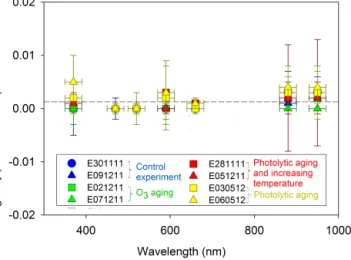
2008), it was thus expected to be influenced by atmospheric processing. The imaginary part of the SOA CRI over the 370–950 nm wavelength range is shown in Fig. 3. Its value was almost zero at all the wavelengths studied, which indi-cates that SOA, even after simulated atmospheric process-ing, has a pure scattering effect in the visible to near-UV region. The formation of chromophores has been observed previously from the ozonolysis of biogenic terpenes (Bones
Figure 3. Wavelength dependence of the imaginary part of the
com-plex refractive index of SOA before and after simulated atmospheric processing. In the control experiment (blue symbols), SOA was left to evolve in the chamber under dark conditions. In the O3 ag-ing experiments (green), SOA was exposed to an excess of ozone (∼ 700 ppb) under constant temperature conditions. In the photo-chemical aging experiments, SOA was exposed to light for 6 h, ei-ther under constant temperature conditions (yellow) or with light-induced heating (red).
et al., 2010; Laskin et al., 2010; Zhong et al., 2012). Some oligomers formed in particle-phase can contain long conju-gated structures which increase the light absorption proper-ties of SOA in the visible. Interestingly, while one might have expected the formation of chromophores during the aging processes, our results indicate that this phenomenon occurred only weakly for α-pinene–O3SOA and/or that the specific
absorption of any potential aging products was not signif-icant. Unlike toluene (Nakayama et al., 2010) or limonene (Bones et al., 2010), α-pinene–O3SOA products did not
con-tain long conjugated structures which absorbed visible radi-ation, at least under our experimental conditions when con-ducted in the absence of NOxor seed particles.
The influence of atmospheric processing upon the real part of the SOA CRI is shown in Fig. 4. No discernible change in real CRI was observed when the SOA was ex-posed to O3or to light at constant temperature. On the
con-trary, a significant increase in the real CRI was observed, 1.35 (±0.03) to 1.49 (±0.03), after photolytic forcing with increasing temperature. The hygroscopic properties of SOA were studied by measuring the GF at a constant relative hu-midity (90 ± 1 %). As shown in Fig. 5, the GF remained con-stant (∼ 1.04 ± 0.02) both during O3 exposure and during
photochemical aging at constant temperature. These results are consistent with our observations of constant mass con-centration and CRI of SOA, and confirm that no significant processing of the SOA occurred under these conditions. In contrast, a significant increase in the GF, from 1.04 (±0.02) to 1.14 (±0.02), was observed with increasing temperature.
Figure 4. Measurements of the real part of the complex refractive
index of SOA before and after simulated atmospheric processing. In the control experiment (blue symbols), SOA was left to evolve in the chamber under dark conditions. In the O3aging experiments (green), SOA was exposed to an excess of ozone (∼ 700 ppb) un-der constant temperature conditions. In the photochemical aging ex-periments, SOA was exposed to light for 6 h, either under constant temperature conditions (yellow) or with light-induced heating (red). Here, the initial time t=0 corresponds to the beginning of simulated aging, which was commenced after SOA was allowed to form and stabilize for 14 h.
3.3 Changes in SOA chemical composition during simulated atmospheric processing
The results presented in the previous two sections suggest that the exposure of the aging of SOA to light and increas-ing temperature resulted in changes in its physical, optical and hygroscopic properties, which are likely to be linked to changes in its chemical composition. Indeed, as shown in Fig. 6a, the increase in the O : C ratio of bulk SOA during its exposure to light and increasing temperature, 0.55 (±0.16) to 0.59 (±0.18), was much larger than that observed for SOA under control conditions. The increase in the O : C ratio was, however, within the measurement uncertainties (±30 %) es-timated from Aiken et al. (2007). These uncertainties may be overestimated compared to the experimental variability and even experimental reproducibility observed in this study. In fact, we estimated the experimental uncertainties to be ±0.01 from the standard deviation of the experimental values before the forcing. A new parameterization of the O : C ratio de-rived from the AMS was recently presented by Canagaratna et al. (2014). Application of this new parameterization to our measurements resulted in a O : C ratio similar to that obtained with our modified fragmentation table in which the measured fragment H2O+ was assigned to organic compounds. This
indicates that the two methodologies agree under very dry conditions (RH < 1 %). The average O : C ratio obtained with both parameterizations was 20 % larger than that obtained
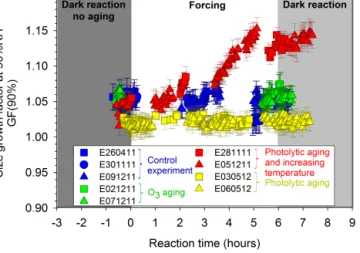
Figure 5. Temporal evolution of SOA hygroscopicity, here
parame-terized using the size growth factor (GF), during and after simulated atmospheric processing. In the control experiment (blue symbols), SOA was left to evolve in the chamber under dark conditions. In the O3aging experiments (green), SOA was exposed to an excess of ozone (∼ 700 ppb) under constant temperature conditions. In the photochemical aging experiments, SOA was exposed to light for 6 h, either under constant temperature conditions (yellow) or with light-induced heating (red). Here, the initial time t = 0 corresponds to the beginning of simulated aging, which was commenced after SOA was allowed to form and stabilize for 14 h.
with the Aiken method and can be attributed to an underes-timation in the Aiken method of the CO+ and H
2O+ ions
produced from many oxidized species.
The fragments f44, defined as the ratio of the m/z 44 (a
major fragment of organic acids and hydroperoxides) signal to the total organic aerosol signal, and f43, defined as the
ra-tio of m/z 43 (associated with less oxygenated groups, e.g. aldehydes and alcohols) signal to the total organic aerosol signal, have been widely used in laboratory and field studies as indicators of SOA functionality and degree of oxidation (Ng et al., 2010; Alfarra et al., 2013; Poulain et al., 2010; Pfaffenberger et al., 2013). As shown in Fig. 6b, in the ex-periment performed under illumination but in the absence of temperature control, the f44/ f43 ratio of SOA increased
from 1.73 (±0.03) to 2.23 (±0.03) as the chamber temper-ature increased. This result implies a tempertemper-ature-mediated increase in particle-phase oxidized species. On the contrary, only a small increase in the f44/ f43ratio, from 1.93 (±0.03)
to 2.03 (±0.03), was observed during the control experiment, which implies that the SOA composition in this experiment remained relatively constant.
3.4 Effect of phase partitioning on SOA properties During the aging of SOAs by photolysis with increasing tem-perature, we observed a decrease of the mass concentration (Fig. 1) which was associated with an increase of the f44/ f43
ratio of bulk particles (Fig. 6b). These evolutions may result
from possible shifts of some semi-volatile organics to the gas phase as temperature increases. A second possible explana-tion would be the photochemical reacexplana-tions that occur in the condensed phase combined with the evaporation of less oxi-dized compounds. In this case, photolysis could lead to a loss of semi-volatile and less oxidized compounds in the particle phase due to the fragmentation of condensed-phase species (Donahue et al., 2012; Henry and Donahue, 2012).
In order to investigate if the increase in temperature can explain the SOA mass decrease, the SOA formation and evo-lution were modelled with the detailed chemical schemes GECKO-A and MCM. In these models, the simulated SOA formation started at the initial step of α-pinene ozonolysis. The effects of temperature on phase partitioning were sim-ulated with both models. The effects of photochemical re-actions and heterogeneous rere-actions by O3were ignored in
these simulations. As shown in Fig. 7 for the initial SOA for-mation period, the time profiles of α-pinene and ozone con-centrations were well reproduced by both models within the measurement uncertainties. Although the temporal profile of the SOA formation was also well reproduced by the mod-els, the simulated mass concentrations of SOAs obtained us-ing the GECKO-A and MCM models (302 and 337 µg m−3, respectively) were higher than those observed in the exper-iment (130 µg m−3). This overestimation of the simulated SOA mass concentration might be due either to an underesti-mation of the vapour pressure with the Nannoolal method used in this study or some oxidation processes occurring in the aerosol phase and leading to fragmentation not im-plemented in the model. In addition, an unavoidable conse-quence of simulation chamber measurements is the interac-tion of gases with the chamber wall surfaces. It is plausible that the VOC-wall losses affect the SOA mass concentration by being a sink for semi-volatile products preventing them from condensing on the aerosol phase.
Four experiments, each of which exhibited different tem-perature increases, were simulated using these models. SOA mass concentration loss was calculated as the difference be-tween the mass concentration before and after each forcing. For the simulations, only the effects of the temperature on phase partitioning were simulated with both models. The ef-fects of photochemical reaction on the gas and particle phase were omitted. A comparison between the observed and mod-elled loss of SOA mass concentration under these tempera-ture conditions is presented in Fig. 8a. As shown in this fig-ure, both the temporal profile and magnitude of SOA mass loss observed in these experiments were well reproduced by the GECKO-A and MCM models. This finding suggests that the observed heating-induced loss in SOA mass concentra-tion can be explained by the temperature-dependent gas– particle phase partitioning of the semi-volatile components of SOA.
The measured and simulated O : C ratios for these exper-iments are shown in Fig. 8b. Before the forcing, both mod-els predict an O : C ratio of 0.49, which is within the
uncer-Figure 6. Evolution of the (a) O : C ratio and (b) f44/ f43 ratio of SOAs during the control experiment (blue circles) and during ex-posure to light with increasing temperature (red circles). The tem-perature profiles within the chamber during the two experiments are shown in (c). Here, the initial time t = 0 corresponds to the be-ginning of simulated aging, which was commenced after SOA was allowed to form and stabilize for 14 h.
tainty of the experimental value (0.55 ± 0.16) obtained with the AMS. During the aging experiments, the O : C ratio sim-ulated with the two models increased with increasing tem-perature; for example, experiment E200411, which showed the highest temperature increase (+6.5◦C; red in Fig. 8c), also showed the highest increase in simulated O : C ratio (from 0.49 to 0.51); on the contrary, experiment E060512
Figure 7. Comparison of temporal profiles of measured α-pinene
(red circles), ozone (blue circles) and SOA mass concentration (green circles) with those modelled using GECKO-A (dashed lines) and the master chemical mechanism (MCM) (solid lines). The ex-perimental data are taken from experiment E160410.
exhibited constant values for both temperature and simu-lated O : C ratio (yellow in Fig. 8b and c). These results sug-gest that the changes in SOA physical and chemical proper-ties observed in these experiments resulted from the heating-induced evaporation of semi-volatile and less oxidized SOA species, which in turn modified the optical and hygroscopic properties of the condensed phase.
4 Discussion
Our results have shown that exposure of SOAs to increas-ing temperature enhances its hydrophilicity, degree of oxida-tion and scattering properties. On the contrary, the few previ-ous studies investigating the changes in physical and chem-ical properties of α-pinene–O3SOAs as a function of
tem-perature have largely found little effect: Cappa and Wilson (2011) observed a reduction in the total mass concentration but no change in the mass spectra of α-pinene–O3SOAs
af-ter heating at 170◦C, and Kim and Paulson (2013) showed no significant change over temperatures ranging from 23 to 86◦C in the real CRI of SOAs. Using AMS data, Huffman et al. (2009) observed an increase in SOA oxygen content during SOA evaporation. This trend is in good agreement with the increase in the CO+2 fragment (m/z 44) with SOA evaporation observed by Kostenidou et al. (2009). Finally, Warren et al. (2009) showed that the GF of SOAs decreased with decreasing temperature from 27◦C to 5◦C. These
dis-agreements with the present study may be attributable to two differences in experimental conditions. First, in the present study, the long timescale of the experiments (20 h) allows for stability in the chemical composition of the semi-volatile component of SOAs before processing. On the contrary, in the previous studies, SOA volatility was measured only sev-eral minutes after its formation. Since the chemical
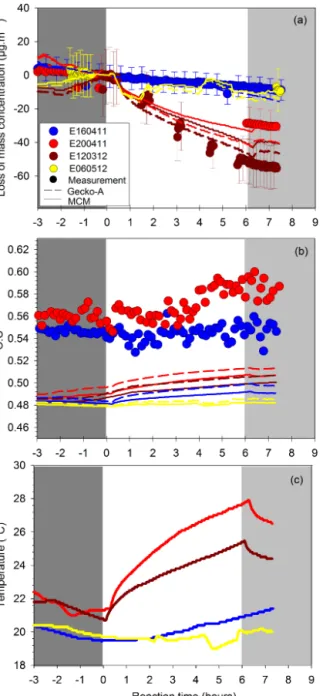
composi-Figure 8. (a) Loss in SOA mass concentration (calculated as the
difference between the SOA mass concentrations before and after simulated atmospheric processing) and (b) O : C ratio of the bulk SOAs for four experiments exhibiting (c) different temperature in-creases. Here, the experimental data (filled circles) are compared with results obtained using the MCM (solid lines) and the GECKO-A (dashed lines) models. The blue points refer to the control ex-periment (E160411), the yellow points refer to an exex-periment in which SOA was exposed to light under controlled temperature con-ditions (E060512), and the red and brown points refer to experi-ments in which SOA was exposed to light and increasing tempera-ture (E200411; E120312). Here, the initial time t = 0 corresponds to the beginning of simulated aging, which was commenced after SOA was allowed to form and stabilize for 14 h.
tion of SOAs has been observed to vary significantly during its formation (Shilling et al., 2008; Chhabra et al., 2010; Den-jean et al., 2014b), it is likely that the volatility of the con-densed species also varies during this time period. Second, in most of the previous studies, temperature variation was performed using a thermodenuder. The timescale for aerosol evaporation within thermodenuders (∼ 16 s) is significantly lower than in simulation chambers (several hours) and, ow-ing to mass transfer limitations, may not be long enough for SOA evaporation to occur (Lee et al., 2011).
Surprisingly, our results suggest that exposure of α-pinene SOAs to light and O3does not significantly change its
chem-ical, hygroscopic and optical properties. These observations suggest that, under our experimental conditions, neither sig-nificant photolysis nor ozonolysis of the particle-phase prod-ucts occurred.
Several previous studies have reported a decline in α-pinene–O3SOA mass after irradiation under exposure to low
OH concentrations (Donahue et al., 2012; Henry and Don-ahue, 2012). These authors used UV lights (∼ 360 nm) to ini-tiate photochemistry; on the contrary, a more realistic repro-duction of the solar energy distribution at the Earth’s surface was used in our study (Wang et al., 2011). In a test of the effect of light source upon SOA aging, Donahue et al. (2012) observed a monotonic decrease in SOA mass during aging with 360 nm UV lights, but an increase in SOA mass during aging with sunlight or quasi-solar lamps. These observations can be explained by the fact that some oxygenated organ-ics in the SOA condensed phase, such as carbonyls or per-oxides, undergo photodissociation by photolysis at the spe-cific wavelength of 360 nm. Together, these results highlight the strong influence of the light source on the photodisso-ciation of SOAs, and underscore the utility of experiments performed under realistic illumination conditions.
In addition, the molecular structure of α-pinene, which contains only one double bond and thus one active site for ozone reaction, limits the gas-phase oxidation by ozone of reaction products of α-pinene. Since no scavenger of OH rad-icals was added, α-pinene–O3SOA is likely a mixture of OH
and O3oxidation products of α-pinene. Therefore, some of
the products may still contain unreacted C=C bonds, which can then react with O3. Our results indicate that the relative
contribution of the products of these reactions may not be sufficient to significantly affect the chemical properties of SOAs during the ozone-induced forcing.
Recent literature has highlighted that α-pinene–O3 SOA
is not composed of a homogeneous chemical mixture. For example, when Maurin et al. (2015) exposed α-pinene–O3
SOA to high concentrations of O3, they observed a
con-stant particle-phase concentration of verbenone, an unsatu-rated oxygenated product. Since this molecule would have been expected to be consumed by heterogeneous reaction with O3, and since heterogeneous particle-phase reactions
are predicted to occur mainly at the surface of the particles (Shiraiwa et al., 2013), these authors postulated that reaction
of O3with verbenone was kinetically limited by the diffusion
of buried verbenone to the particle surface. This hypothesis is also supported by our observation that α-pinene–O3SOA
exhibits a core-shell structure, with less oxidized species at its surface (Denjean et al., 2014b). The effect of the forcing would depend not only on the chemical composition of the bulk particle, but also on the chemical surface and the phase of the particle.
5 Conclusions
We have demonstrated that the size, chemical composition, hygroscopicity and optical properties of α-pinene–O3SOAs
change dramatically in response to relatively minor increases in temperature (∼ 6◦C). These changes, in turn, have
impli-cations for the role that SOA plays in climate. For example, the volatilization-induced increase in the real part of the SOA CRI is likely to enhance the direct radiative effect of SOA by increasing its ability to scatter radiation. The direct radiative effect of SOA can be parameterized using the mass extinc-tion efficiency kext at 525 nm, which is defined as the ratio
of the measured σscatat 525 nm to the SOA mass
concentra-tion. In our companion paper (Denjean et al. 2014b), we have estimated a value of kext=1.7 ± 0.5 m2g−1for unprocessed
SOAs. In the present experiments, we estimate a value of
kext=2.8 ± 0.5 m2g−1for SOAs exposed to light and
tem-perature increase, which implies that this aging regime led to a ∼ 40 % enhancement in this parameter. We attribute this en-hancement to both the decrease in SOA particle size and the increase in the scattering component of the CRI upon heat-ing.
As shown in this work, exposure of SOAs to increasing temperature also leads to an increase in SOA hygroscop-icity: the SOA GF increased from 1.04 to 1.14 as a result of this forcing. In order to estimate the influence of these changes in hygroscopicity on the direct radiative effect of SOAs, we made the simplified assumption that SOA exhibits a homogeneous mixing state with water. We used Mie scat-tering calculations for homogeneous spheres to determine
σscat at 90 % RH both from the measured GF and the CRI.
The CRI calculations were based on volume-weighted CRI of values of α-pinene–O3SOA and water. We estimate that
kext (90 % RH) = 2.8 ± 0.7 m2g−1after SOA volatilization,
which is significantly higher than the value of kext (90 %
RH) = 2.3 ± 0.7 m2g−1calculated in Denjean et al. (2014b)
for unprocessed SOAs. Since we have shown that volatiliza-tion of condensed-phase species takes place over a range of temperatures consistent with diurnal fluctuations, we suggest that these changes in kext are representative of the diurnal
evolution of SOAs during its lifetime in the atmosphere. Our results also suggest that α-pinene–O3 SOA is quite
insensitive to light- and ozone-induced aging under our ex-perimental conditions. Insensitivity to ozone-induced aging is most likely a result of the molecular structure of α-pinene
which limit the gas-phase oxidation by ozone of reaction products of α-pinene. In addition, several recent studies have reported that α-pinene–O3SOA undergoes a transition from
a more glassy state to a more liquid state with increasing RH (Saukko et al., 2012; Renbaum-Wolff et al., 2013; Den-jean et al., 2014b). On the basis of viscosity data and the Stokes–Einstein equation, Renbaum-Wolff et al. (2013) es-timated that the change in α-pinene–O3 SOA viscosity
as-sociated with its transition from a solid to a semi-solid state increases the bulk diffusion coefficient of particles by 6 or-ders of magnitude (from < 10−17cm2s−1to 10−11cm2s−1). Since an increase in bulk diffusion coefficient would be ex-pected to be accompanied by an increase in particle reac-tivity, we suggest that future studies examine the effect of ozone and light exposure on α-pinene–O3 SOA properties
under humidified conditions (i.e. RH > 30 %). Beyond its ef-fect on the physical state of the particles, the relative hu-midity may influence the chemical composition of SOAs. Recently, Kristensen et al. (2014) observed that α-pinene– O3SOAs increased concentrations of high molecular weight
compounds, such as dimer esters, at higher RH (> 50 %) rel-ative to lower RH (< 30 %). An increase in high molecular weight compounds with increase RH could lead to a change in hygroscopic and optical properties of α-pinene–O3SOAs
as well as its sensitivity to aging processes. In addition, fur-ther experimental studies on SOAs which exhibit different viscosity are required in order to evaluate the atmospheric implication of the oxidative processing and photochemistry.
Acknowledgements. This research work has been supported by
the European Community within the seventh Framework Program Eurochamp-2 (EU-FP7 grant agreement no. 228335). We also acknowledge the French National Research Agency (ANR) through the CUMULUS project. We thank Frank Siekmann and Sylvain Ravier (Aix-Marseille Université, France) for their help in calibrating the AMS during the measurement campaign. We thank Sarah Styler (Leibniz Institute for Tropospheric Research, Germany) for helpful revision of the manuscript.
Edited by: A. Virtanen
References
Aiken, A. C., DeCarlo, P. F., and Jimenez, J. L.: Elemen-tal analysis of organic species with electron ionization high-resolution mass spectrometry, Anal. Chem., 79, 8350–8358, doi:10.1021/ac071150w, 2007.
Alfarra, M. R., Good, N., Wyche, K. P., Hamilton, J. F., Monks, P. S., Lewis, A. C., and McFiggans, G.: Water uptake is independent of the inferred composition of secondary aerosols derived from multiple biogenic VOCs, Atmos. Chem. Phys., 13, 11769–11789, doi:10.5194/acp-13-11769-2013, 2013.
Allan, J. D., Delia, A. E., Coe, H., Bower, K. N., Alfarra, M. R., Jimenez, J. L., Middlebrook, A. M., Drewnick, F., Onasch, T. B.,
Canagaratna, M. R., Jayne, J. T., and Worsnop, D. R.: A gen-eralised method for the extraction of chemically resolved mass spectra from Aerodyne aerosol mass spectrometer data, J. Aerosol Sci., 35, 909–922, doi:10.1016/j.jaerosci.2004.02.007, 2004.
Asa-Awuku, A., Engelhart, G. J., Lee, B. H., Pandis, S. N., and Nenes, A.: Relating CCN activity, volatility, and droplet growth kinetics of β-caryophyllene secondary organic aerosol, Atmos. Chem. Phys., 9, 795–812, doi:10.5194/acp-9-795-2009, 2009. Aumont, B., Szopa, S., and Madronich, S.: Modelling the evolution
of organic carbon during its gas-phase tropospheric oxidation: development of an explicit model based on a self generating ap-proach, Atmos. Chem. Phys., 5, 2497–2517, doi:10.5194/acp-5-2497-2005, 2005.
Barley, M. H. and McFiggans, G.: The critical assessment of vapour pressure estimation methods for use in modelling the formation of atmospheric organic aerosol, Atmos. Chem. Phys., 10, 749– 767, doi:10.5194/acp-10-749-2010, 2010.
Bateman, A. P., Nizkorodov, S. A., Laskin, J., and Laskin, A.: Photolytic processing of secondary organic aerosols dissolved in cloud droplets, Phys. Chem. Chem. Phys., 13, 12199–12212, doi:10.1039/c1cp20526a, 2011.
Bohren, C. F. and Huffman, D. R.: Absorption and Scattering of Light by Small Particles, Wiley, New York, 1983.
Bones, D. L., Henricksen, D. K., Mang, S. A., Gonsior, M., Bate-man, A. P., Nguyen, T. B., Cooper, W. J., and Nizkorodov, S. A.: Appearance of strong absorbers and fluorophores in limonene-O3 secondary organic aerosol due to NH4+-mediated chemi-cal aging over long time schemi-cales, J. Geophys. Res. Atmos., 115, D05203, doi:10.1029/2009JD012864, 2010.
Camredon, M., Aumont, B., Lee-Taylor, J., and Madronich, S.: The SOA/VOC/NOxsystem: an explicit model of secondary
or-ganic aerosol formation, Atmos. Chem. Phys., 7, 5599–5610, doi:10.5194/acp-7-5599-2007, 2007.
Canagaratna, M. R., Jimenez, J. L., Kroll, J. H., Chen, Q., Kessler, S. H., Massoli, P., Hildebrandt Ruiz, L., Fortner, E., Williams, L. R., Wilson, K. R., Surratt, J. D., Donahue, N. M., Jayne, J. T., and Worsnop, D. R.: Elemental ratio measurements of or-ganic compounds using aerosol mass spectrometry: character-ization, improved calibration, and implications, Atmos. Chem. Phys. Discuss., 14, 19791–19835, doi:10.5194/acpd-14-19791-2014, 2014.
Cappa, C. D. and Wilson, K. R.: Evolution of organic aerosol mass spectra upon heating: implications for OA phase and partitioning behavior, Atmos. Chem. Phys., 11, 1895–1911, doi:10.5194/acp-11-1895-2011, 2011.
Cappa, C. D., Che, D. L., Kessler, S. H., Kroll, J. H., and Wil-son, K. R.: Variations in organic aerosol optical and hygroscopic properties upon heterogeneous OH oxidation, J. Geophys. Res., 116, D15204, doi:10.1029/2011JD015918, 2011.
Carter, W. P. L., Cocker Iii, D. R., Fitz, D. R., Malkina, I. L., Bu-miller, K., Sauer, C. G., Pisano, J. T., Bufalino, C., and Song, C.: A new environmental chamber for evaluation of gas-phase chem-ical mechanisms and secondary aerosol formation, Atmos. Envi-ron., 39, 7768–7788, doi:10.1016/j.atmosenv.2005.08.040, 2005. Chang, R. Y.-W., Slowik, J. G., Shantz, N. C., Vlasenko, A., Lig-gio, J., Sjostedt, S. J., Leaitch, W. R., and Abbatt, J. P. D.: The hy-groscopicity parameter (κ) of ambient organic aerosol at a field site subject to biogenic and anthropogenic influences:
relation-ship to degree of aerosol oxidation, Atmos. Chem. Phys., 10, 5047–5064, doi:10.5194/acp-10-5047-2010, 2010.
Chen, Q., Liu, Y. J., Donahue, N. M., Shilling, J. E., and Martin, S. T.: Particle-Phase Chemistry of Secondary Organic Material: Modeled Compared to Measured O : C and H:C Elemental Ra-tios Provide Constraints, Environ. Sci. Technol., 45, 4763–4770, doi:10.1021/es104398s, 2011.
Chhabra, P. S., Flagan, R. C., and Seinfeld, J. H.: Elemental analysis of chamber organic aerosol using an aerodyne high-resolution aerosol mass spectrometer, Atmos. Chem. Phys., 10, 4111–4131, doi:10.5194/acp-10-4111-2010, 2010.
Cocker, D. R., Clegg, S. L., Flagan, R. C., and Seinfeld, J. H.: The effect of water on gas-particle partitioning of secondary organic aerosol. Part I: alpha-pinene/ozone system, Atmos. Environ., 35, 6049–6072, doi:10.1016/s1352-2310(01)00404-6, 2001. Collaud Coen, M., Weingartner, E., Apituley, A., Ceburnis, D.,
Fierz-Schmidhauser, R., Flentje, H., Henzing, J. S., Jen-nings, S. G., Moerman, M., Petzold, A., Schmid, O., and Bal-tensperger, U.: Minimizing light absorption measurement arti-facts of the Aethalometer: evaluation of five correction algo-rithms, Atmos. Meas. Tech., 3, 457–474, doi:10.5194/amt-3-457-2010, 2010.
de Gouw, J. A., Middlebrook, A. M., Warneke, C., Goldan, P. D., Kuster, W. C., Roberts, J. M., Fehsenfeld, F. C., Worsnop, D. R., Canagaratna, M. R., Pszenny, A. A. P., Keene, W. C., Marchewka, M., Bertman, S. B., and Bates, T. S.: Budget of organic carbon in a polluted atmosphere: results from the New England Air Quality Study in 2002, J. Geophys. Res.-Atmos., 110, D16305, doi:10.1029/2004JD005623, 2005.
DeCarlo, P. F., Kimmel, J. R., Trimborn, A., Northway, M. J., Jayne, J. T., Aiken, A. C., Gonin, M., Fuhrer, K., Horvath, T., Docherty, K. S., Worsnop, D. R., and Jimenez, J. L.: Field-deployable, high-resolution, time-of-flight aerosol mass spec-trometer, Anal. Chem., 78, 8281–8289, doi:10.1021/ac061249n, 2006.
Denjean, C., Formenti, P., Picquet-Varrault, B., Katrib, Y., Pan-gui, E., Zapf, P., and Doussin, J. F.: A new experimental approach to study the hygroscopic and optical properties of aerosols: ap-plication to ammonium sulfate particles, Atmos. Meas. Tech., 7, 183–197, doi:10.5194/amt-7-183-2014, 2014a.
Denjean, C., Formenti, P., Picquet-Varrault, B., Pangui, E., Zapf, P., Katrib, Y., Giorio, C., Tapparo, A., Monod, A., Temime-Roussel, B., Decorse, P., Mangeney, C., and Doussin, J. F.: Re-lating hygroscopicity and optical properties to chemical compo-sition and structure of secondary organic aerosol particles gen-erated from the ozonolysis of α-pinene, Atmos. Chem. Phys. Discuss., 14, 10543–10596, doi:10.5194/acpd-14-10543-2014, 2014b.
Donahue, N. M., Henry, K. M., Mentel, T. F., Kiendler-Scharr, A., Spindler, C., Bohn, B., Brauers, T., Dorn, H. P., Fuchs, H., Till-mann, R., Wahner, A., Saathoff, H., NauTill-mann, K. H., Mohler, O., Leisner, T., Muller, L., Reinnig, M. C., Hoffmann, T., Salo, K., Hallquist, M., Frosch, M., Bilde, M., Tritscher, T., Barmet, P., Praplan, A. P., DeCarlo, P. F., Dommen, J., Prevot, A. S. H., and Baltensperger, U.: Aging of biogenic secondary organic aerosol via gas-phase OH radical reactions, P. Natl. Acad. Sci. USA, 109, 13503–13508, doi:10.1073/pnas.1115186109, 2012.
Duplissy, J., DeCarlo, P. F., Dommen, J., Alfarra, M. R., Met-zger, A., Barmpadimos, I., Prevot, A. S. H., Weingartner, E.,
Tritscher, T., Gysel, M., Aiken, A. C., Jimenez, J. L., Cana-garatna, M. R., Worsnop, D. R., Collins, D. R., Tomlinson, J., and Baltensperger, U.: Relating hygroscopicity and composition of organic aerosol particulate matter, Atmos. Chem. Phys., 11, 1155–1165, doi:10.5194/acp-11-1155-2011, 2011.
Ellison, G. B., Tuck, A. F., and Vaida, V.: Atmospheric process-ing of organic aerosols, J. Geophys. Res.-Atmos., 104, 11633– 11641, doi:10.1029/1999jd900073, 1999.
Ervens, B. and Volkamer, R.: Glyoxal processing by aerosol multi-phase chemistry: towards a kinetic modeling framework of sec-ondary organic aerosol formation in aqueous particles, Atmos. Chem. Phys., 10, 8219–8244, doi:10.5194/acp-10-8219-2010, 2010.
Flores, J. M., Zhao, D. F., Segev, L., Schlag, P., Kiendler-Scharr, A., Fuchs, H., Watne, Å. K., Bluvshtein, N., Mentel, Th. F., Hal-lquist, M., and Rudich, Y.: Evolution of the complex refractive index in the UV spectral region in ageing secondary organic aerosol, Atmos. Chem. Phys., 14, 5793–5806, doi:10.5194/acp-14-5793-2014, 2014.
Gao, S., Ng, N. L., Keywood, M., Varutbangkul, V., Bahreini, R., Nenes, A., He, J., Yoo, K. Y., Beauchamp, J. L., Hodyss, R. P., Flagan, R. C., and Seinfeld, J. H.: Particle phase acidity and oligomer formation in secondary organic aerosol, Environ. Sci. Technol., 38, 6582–6589, doi:10.1021/es049125k, 2004. George, I. J., Chang, R. Y. W., Danov, V., Vlasenko, A.,
and Abbatt, J. P. D.: Modification of cloud condensation nucleus activity of organic aerosols by hydroxyl radical heterogeneous oxidation, Atmos. Environ., 43, 5038–5045, doi:10.1016/j.atmosenv.2009.06.043, 2009.
George, I. J. and Abbatt, J. P. D.: Chemical evolution of secondary organic aerosol from OH-initiated heterogeneous oxidation, At-mos. Chem. Phys., 10, 5551–5563, doi:10.5194/acp-10-5551-2010, 2010.
Guenther, A., Hewitt, C. N., Erickson, D., Fall, R., Geron, C., Graedel, T., Harley, P., Klinger, L., Lerdau, M., Mckay, W. A., Pierce, T., Scholes, B., Steinbrecher, R., Tallamraju, R., Tay-lor, J., and Zimmerman, P.: A global model of natural volatile organic compound emissions, J. Geophys. Res., 100, 8873–8892, doi:10.1029/94JD02950, 1995.
Hallquist, M., Wenger, J. C., Baltensperger, U., Rudich, Y., Simp-son, D., Claeys, M., Dommen, J., Donahue, N. M., George, C., Goldstein, A. H., Hamilton, J. F., Herrmann, H., Hoffmann, T., Iinuma, Y., Jang, M., Jenkin, M. E., Jimenez, J. L., Kiendler-Scharr, A., Maenhaut, W., McFiggans, G., Mentel, Th. F., Monod, A., Prévôt, A. S. H., Seinfeld, J. H., Surratt, J. D., Szmigielski, R., and Wildt, J.: The formation, properties and im-pact of secondary organic aerosol: current and emerging issues, Atmos. Chem. Phys., 9, 5155–5236, doi:10.5194/acp-9-5155-2009, 2009.
Hawkins, L. N. and Russell, L. M.: Oxidation of ketone groups in transported biomass burning aerosol from the 2008 North-ern California Lightning Series fires, Atmos. Environ., 44, 4142– 4154, doi:10.1016/j.atmosenv.2010.07.036, 2010.
Haywood, J. M. and Ramaswamy, V.: Global sensitivity studies of the direct radiative forcing due to anthropogenic sulfate and black carbon aerosols, J. Geophys. Res.-Atmos., 103, 6043– 6058, doi:10.1029/97JD03426, 1998.
Henry, K. M. and Donahue, N. M.: Photochemical aging of alpha-pinene secondary organic aerosol: effects of oh radical
sources and photolysis, J. Phys. Chem. A, 116, 5932–5940, doi:10.1021/jp210288s, 2012.
Huffman, J. A., Docherty, K. S., Mohr, C., Cubison, M. J., Ul-brich, I. M., Ziemann, P. J., Onasch, T. B., and Jimenez, J. L.: Chemically-resolved volatility measurements of organic aerosol from different sources, Environ. Sci. Technol., 43, 5351–5357, doi:10.1021/es803539d, 2009.
Jimenez, J. L., Canagaratna, M. R., Donahue, N. M., Pre-vot, A. S. H., Zhang, Q., Kroll, J. H., DeCarlo, P. F., Allan, J. D., Coe, H., Ng, N. L., Aiken, A. C., Docherty, K. S., Ulbrich, I. M., Grieshop, A. P., Robinson, A. L., Duplissy, J., Smith, J. D., Wil-son, K. R., Lanz, V. A., Hueglin, C., Sun, Y. L., Tian, J., Laakso-nen, A., RaatikaiLaakso-nen, T., RautiaiLaakso-nen, J., Vaattovaara, P., Ehn, M., Kulmala, M., Tomlinson, J. M., Collins, D. R., Cubison, M. J., E., Dunlea, J., Huffman, J. A., Onasch, T. B., Alfarra, M. R., Williams, P. I., Bower, K., Kondo, Y., Schneider, J., Drewnick, F., Borrmann, S., Weimer, S., Demerjian, K., Salcedo, D., Cot-trell, L., Griffin, R., Takami, A., Miyoshi, T., Hatakeyama, S., Shimono, A., Sun, J. Y., Zhang, Y. M., Dzepina, K., Kim-mel, J. R., Sueper, D., Jayne, J. T., Herndon, S. C., Trim-born, A. M., Williams, L. R., Wood, E. C., Middlebrook, A. M., Kolb, C. E., Baltensperger, U., and Worsnop, D. R.: Evolution of organic aerosols in the atmosphere, Science, 326, 1525–1529, doi:10.1126/science.1180353, 2009.
Kalberer, M., Paulsen, D., Sax, M., Steinbacher, M., Dommen, J., Prevot, A. S. H., Fisseha, R., Weingartner, E., Frankevich, V., Zenobi, R., and Baltensperger, U.: Identification of polymers as major components of atmospheric organic aerosols, Science, 303, 1659–1662, doi:10.1126/science.1092185, 2004.
Kanakidou, M., Seinfeld, J. H., Pandis, S. N., Barnes, I., Den-tener, F. J., Facchini, M. C., Van Dingenen, R., Ervens, B., Nenes, A., Nielsen, C. J., Swietlicki, E., Putaud, J. P., Balkan-ski, Y., Fuzzi, S., Horth, J., Moortgat, G. K., Winterhalter, R., Myhre, C. E. L., Tsigaridis, K., Vignati, E., Stephanou, E. G., and Wilson, J.: Organic aerosol and global climate modelling: a review, Atmos. Chem. Phys., 5, 1053–1123, doi:10.5194/acp-5-1053-2005, 2005.
Kim, H. and Paulson, S. E.: Real refractive indices and volatility of secondary organic aerosol generated from photooxidation and ozonolysis of limonene, α-pinene and toluene, Atmos. Chem. Phys., 13, 7711–7723, doi:10.5194/acp-13-7711-2013, 2013. Kristensen, K., Cui, T., Zhang, H., Gold, A., Glasius, M., and
Surratt, J. D.: Dimer esters in α-pinene secondary organic aerosol: effect of hydroxyl radical, ozone, relative humidity and aerosol acidity, Atmos. Chem. Phys. Discuss., 13, 32529–32574, doi:10.5194/acpd-13-32529-2013, 2013.
Kostenidou, E., Lee, B. H., Engelhart, G. J., Pierce, J. R., and Pan-dis, S. N.: Mass spectra deconvolution of low, medium, and high volatility biogenic secondary organic aerosol, Environ. Sci. Tech-nol., 43, 4884–4889, doi:10.1021/es803676g, 2009.
Kourtchev, I., Fuller, S. J., Giorio, C., Healy, R. M., Wilson, E., O’Connor, I., Wenger, J. C., McLeod, M., Aalto, J., Ru-uskanen, T. M., Maenhaut, W., Jones, R., Venables, D. S., Sodeau, J. R., Kulmala, M., and Kalberer, M.: Molecular com-position of biogenic secondary organic aerosols using ultrahigh-resolution mass spectrometry: comparing laboratory and field studies, Atmos. Chem. Phys., 14, 2155–2167, doi:10.5194/acp-14-2155-2014, 2014.
Kroll, J. H. and Seinfeld, J. H.: Chemistry of secondary ganic aerosol: formation and evolution of low-volatility or-ganics in the atmosphere, Atmos. Environ., 42, 3593–3624, doi:10.1016/j.atmosenv.2008.01.003, 2008.
Kroll, J. H., Ng, N. L., Murphy, S. M., Flagan, R. C., and Se-infeld, J. H.: Secondary organic aerosol formation from iso-prene photooxidation, Environ. Sci. Technol., 40, 1869–1877, doi:10.1021/es0524301, 2006.
Lambe, A. T., Cappa, C. D., Massoli, P., Onasch, T. B., Forestieri, S. D., Martin, A. T., Cummings, M. J., Croas-dale, D. R., Brune, W. H., Worsnop, D. R., and Davidovits, P.: Relationship between oxidation level and optical properties of secondary organic aerosol, Environ. Sci. Technol., 47, 6349– 6357, doi:10.1021/es401043j, 2013.
Laskin, J., Laskin, A., Roach, P. J., Slysz, G. W., Anderson, G. A., Nizkorodov, S. A., Bones, D. L., and Nguyen, L. Q.: High-Resolution Desorption Electrospray Ionization Mass Spectrom-etry for Chemical Characterization of Organic Aerosols, Analyt. Chem., 82, 2048–2058, doi:10.1021/ac902801f, 2010.
Lee, B.-H., Pierce, J. R., Engelhart, G. J., and Pandis, S. N.: Volatility of secondary organic aerosol from the ozonol-ysis of monoterpenes, Atmos. Environ., 45, 2443–2452, doi:10.1016/j.atmosenv.2011.02.004, 2011.
Li, Y. P., Elbern, H., Lu, K. D., Friese, E., Kiendler-Scharr, A., Mentel, Th. F., Wang, X. S., Wahner, A., and Zhang, Y. H.: Up-dated aerosol module and its application to simulate secondary organic aerosols during IMPACT campaign May 2008, Atmos. Chem. Phys., 13, 6289–6304, doi:10.5194/acp-13-6289-2013, 2013.
Liu, Y. G. and Daum, P. H.: Relationship of refractive index to mass density and self-consistency of mixing rules for multicomponent mixtures like ambient aerosols, J. Aerosol Sci., 39, 974–986, doi:10.1016/j.jaerosci.2008.06.006, 2008.
Lohmann, U. and Feichter, J.: Global indirect aerosol effects: a re-view, Atmos. Chem. Phys., 5, 715–737, doi:10.5194/acp-5-715-2005, 2005.
Massoli, P., Lambe, A. T., Ahern, A. T., Williams, L. R., Ehn, M., Mikkilä, J., Canagaratna, M. R., Brune, W. H., Onasch, T. B., Jayne, J. T., Petäjä, T., Kulmala, M., Laaksonen, A., Kolb, C. E., Davidovits, P., and Worsnop, D. R.: Relationship between aerosol oxidation level and hygroscopic properties of laboratory generated secondary organic aerosol (SOA) particles, Geophys. Res. Lett., 37, L24801, doi:10.1029/2010GL045258, 2010. Maurin, N., Perraudin, E., Buzinski, H., Pardon, P., Pangui, E., and
Doussin, J.-F.: Chemical composition and aging at the molecular level of secondary organic aerosol formed from ozonolysis of
α-pinene – Part 2: effect of aging induced by ozone, light and humidity, Atmos. Chem. Phys. Discuss., in preparation, 2015. Nakayama, T., Matsumi, Y., Sato, K., Imamura, T., Yamazaki, A.,
and Uchiyama, A.: Laboratory studies on optical properties of secondary organic aerosols generated during the photooxidation of toluene and the ozonolysis of alpha-pinene, J. Geophys. Res.-Atmos., 115, doi:10.1029/2010jd014387, 2010.
Nannoolal, Y., Rarey, J., Ramjugernath, D., and Cordes, W.: Esti-mation of pure component properties Part 1. EstiEsti-mation of the normal boiling point of non-electrolyte organic compounds via group contributions and group interactions, Fluid Phase Equi-libr., 226, 45–63, doi:10.1016/j.fluid.2004.09.001, 2004.
Nannoolal, Y., Rarey, J., and Ramjugernath, D.: Estimation of pure component properties – Part 3. Estimation of the vapor pres-sure of non-electrolyte organic compounds via group contribu-tions and group interaccontribu-tions, Fluid Phase Equilibr., 269, 117– 133, doi:10.1016/j.fluid.2008.04.020, 2008.
Ng, N. L., Canagaratna, M. R., Zhang, Q., Jimenez, J. L., Tian, J., Ulbrich, I. M., Kroll, J. H., Docherty, K. S., Chhabra, P. S., Bahreini, R., Murphy, S. M., Seinfeld, J. H., Hildebrandt, L., Donahue, N. M., DeCarlo, P. F., Lanz, V. A., Prévôt, A. S. H., Dinar, E., Rudich, Y., and Worsnop, D. R.: Organic aerosol components observed in Northern Hemispheric datasets from Aerosol Mass Spectrometry, Atmos. Chem. Phys., 10, 4625– 4641, doi:10.5194/acp-10-4625-2010, 2010.
Ng, N. L., Canagaratna, M. R., Jimenez, J. L., Chhabra, P. S., Se-infeld, J. H., and Worsnop, D. R.: Changes in organic aerosol composition with aging inferred from aerosol mass spectra, At-mos. Chem. Phys., 11, 6465–6474, doi:10.5194/acp-11-6465-2011, 2011.
Nozière, B. and Esteve, W.: Organic reactions increasing the ab-sorption index of atmospheric sulfuric acid aerosols, Geophys. Res. Lett., 32, L03812, doi:10.1029/2004GL021942, 2005. Pankow, J. F. and Asher, W. E.: SIMPOL.1: a simple group
contribution method for predicting vapor pressures and en-thalpies of vaporization of multifunctional organic compounds, Atmos. Chem. Phys., 8, 2773–2796, doi:10.5194/acp-8-2773-2008, 2008.
Pfaffenberger, L., Barmet, P., Slowik, J. G., Praplan, A. P., Dom-men, J., Prévôt, A. S. H., and Baltensperger, U.: The link between organic aerosol mass loading and degree of oxygenation: an α-pinene photooxidation study, Atmos. Chem. Phys., 13, 6493– 6506, doi:10.5194/acp-13-6493-2013, 2013.
Poulain, L., Wu, Z., Petters, M. D., Wex, H., Hallbauer, E., Wehner, B., Massling, A., Kreidenweis, S. M., and Stratmann, F.: Towards closing the gap between hygroscopic growth and CCN activation for secondary organic aerosols – Part 3: Influence of the chemical composition on the hygroscopic properties and volatile fractions of aerosols, Atmos. Chem. Phys., 10, 3775– 3785, doi:10.5194/acp-10-3775-2010, 2010.
Qi, L., Nakao, S., and Cocker, D. R.: Aging of secondary or-ganic aerosol from α-pinene ozonolysis: roles of hydroxyl and nitrate radicals, J. Air Waste Manage., 62, 1359–1369, doi:10.1080/10962247.2012.712082, 2012.
Renbaum-Wolff, L., Grayson, J. W., Bateman, A. P., Kuwata, M., Sellier, M., Murray, B. J., Shilling, J. E., Martin, S. T., and Bertram, A. K.: Viscosity of α-pinene secondary organic material and implications for particle growth and reactivity, P. Natl. Acad. Sci. USA, 110, 8014–8019, doi:10.1073/pnas.1219548110, 2013.
Rudich, Y.: Laboratory perspectives on the chemical transforma-tions of organic matter in atmospheric particles, Chem. Rev., 103, 5097–5124, doi:10.1021/cr020508f, 2003.
Saathoff, H., Naumann, K.-H., Möhler, O., Jonsson, Å. M., Hal-lquist, M., Kiendler-Scharr, A., Mentel, Th. F., Tillmann, R., and Schurath, U.: Temperature dependence of yields of secondary or-ganic aerosols from the ozonolysis of α-pinene and limonene, Atmos. Chem. Phys., 9, 1551–1577, doi:10.5194/acp-9-1551-2009, 2009.
Salo, K., Hallquist, M., Jonsson, Å. M., Saathoff, H., Naumann, K.-H., Spindler, C., Tillmann, R., Fuchs, K.-H., Bohn, B., Rubach, F.,