HAL Id: hal-02983152
https://hal.archives-ouvertes.fr/hal-02983152
Submitted on 2 Nov 2020
HAL is a multi-disciplinary open access
archive for the deposit and dissemination of
sci-entific research documents, whether they are
pub-lished or not. The documents may come from
teaching and research institutions in France or
abroad, or from public or private research centers.
L’archive ouverte pluridisciplinaire HAL, est
destinée au dépôt et à la diffusion de documents
scientifiques de niveau recherche, publiés ou non,
émanant des établissements d’enseignement et de
recherche français ou étrangers, des laboratoires
publics ou privés.
MOOCs as a remedial complement: Students’ adoption
and learning outcomes
Josefina Hernández, M. Fernanda Rodríguez, Isabel Hilliger, Mar
Pérez-Sanagustin
To cite this version:
Josefina Hernández, M. Fernanda Rodríguez, Isabel Hilliger, Mar Pérez-Sanagustin.
MOOCs
as a remedial complement: Students’ adoption and learning outcomes.
IEEE Transactions on
Learning Technologies, Institute of Electrical and Electronics Engineers, 2018, 12 (1), pp.133-141.
�10.1109/TLT.2018.2830373�. �hal-02983152�
MOOCs as a Remedial Complement: Students’
Adoption and Learning Outcomes
Josefina Hernandez , Fernanda Rodr
!ıguez , Isabel Hilliger , and Mar P!erez-Sanagust!ın
Abstract—The effectiveness of remedial mathematics courses in post-secondary education has been a controversial topic for years. Higher Education institutions need their students to have basic understandings of the subjects to be imparted in the first semesters, but since they come with different backgrounds and prior knowledge, this is not always possible and many students struggle in their first courses. This paper presents the results of students’ adoption and learning outcomes of using four MOOCs as a complementary study resource for an on-campus calculus diagnostic exam. Over 700 newly admitted university students had to take a mandatory diagnostic exam on four calculus topics before classes started. MOOCs were proposed as a voluntary support for studying these subjects. Following a mixed method analysis, we studied why and when the students used the online courses and we also measured the effects of its use in terms of the students’ diagnostic exam grades and learning outcomes. The results show that students mostly used the MOOCs to study the subjects that were not covered in their secondary studies. Students who were active in these course topics obtained better scores, having more chances of passing the diagnostic exam than students who did not study with the MOOCs. Furthermore, students not only used the MOOCs for studying for the exam, but also for refreshing concepts for future courses.
Index Terms—MOOCs, post-secondary education, higher edu-cation, remedial courses, adoption, learning outcomes, mathe-matics, calculus.
I. INTRODUCTION
M
ASSIVE Open Online Courses (MOOCs) present new opportunities for teaching and learning [16]. To makecommon strategies of this complementary use of MOOCs is the “flipped classroom”, the literature also reports other ways of reusing and integrating MOOCs into formal education [20], [21]. One of these MOOC-based models is to use MOOCs as a complementary resource for remedial courses. Therefore, this model suggests using MOOCs to help post-secondary stu-dents acquire and review the knowledge needed for getting into the university, or to continue their HE studies [15], [19]. Even though this latter model of MOOC reutilization is becoming more popular among HE institutions, most results in the literature focus on students’ changes in motivation or satisfaction; only a few studies measure the effects of these models on students’ learning outcomes [3], [25] and their adoption of the teaching methodology.
To provide more evidence on the efficacy of these MOOC-based models, this work presents an innovative use of MOOCs as a complementary resource for a remedial course in calculus, and analyses the effects of this innovation in terms of students’ adoption and learning outcomes. Specifically, this paper extends a previous work published in a conference paper in which we presented the case of the School of Engineering of Pontificia Universidad Cat!olica de Chile (UC-Engineering) where 4 MOOCs were used by over 700 freshmen students as complementary remedial resources for the study of a calculus diagnostic exam (DE) [20]. On this opportunity, we comple-ment the previous study by presenting more details of the innovation, with a deeper understanding of the students’ adop-tion and learning outcomes by analyzing the data with the mixed method approach. First, we analyzed the reasons why students adopted the MOOCs through focus groups and semi-structured interviews. Second, we analyzed the differences in students’ learning outcomes of comparable groups of students when participating in different diagnostic exam opportunities.
The article is structured as follows. First, we present related work in the field, followed by a description of the MOOCs: the context and the MOOCs’ structure and components. Second, we explain how the assessment of this innovation was approached, with a description of the pilot study, the MOOC integration proposal, the curricular alignment, the data gather-ing techniques, participants and samples, and the data analysis. Finally, we present the results, a discussion and conclusions.
II. RELATEDWORK
Post-secondary remediation and reusing MOOCs for on-campus education are some of the main trends in HE institu-tions. In this section, we revise some of these initiatives. the most of them, Higher Education (HE) institutions are
exploring and experimenting with blended teaching methodol-ogies that aim at integrating MOOCs as a complement in the formal curriculum [20], [21]. Although one of the most This work was been supported in part by the Proyecto de Iniciacio_n Fondecyt under Grant 2015 No. 11150231, in part by the Clo-ver 2030 Engineering Strategy under Grant 14ENI2-26862, and in part by the Erasmusþ Programme of the European Union, MOOC-Maker under Grant 561533-EPP-1-2015-1-ES-EPPKA2-CBHE-JP. (Corresponding author: Jose-fina
Hernandez Correa.)
J. Hernandez, F. Rodr!ıguez, and I. Hillliger are with the School of Engineer-ing, Pontificia Universidad Cat!olica de Chile Avda, Vicu~na Mackenna 486, Macul, Santiago de Chile (e-mail: [email protected]; [email protected]; [email protected]).
M. P!erez-Sanagust!ın is with the IRIT, Universit!e Tolouse III Paul Sabatier, 118 Route de Narbonne, F-31062 TOULOUSE CEDEX 9, Tolouse, France, and the School of Engineering, Pontificia Universidad Cat!olica de Chile Santiago, Chile (e-mail: [email protected]).
A. Remediation in Post-Secondary Education
Post-secondary education students who have been accepted in the same college or university degree come with differences in their previous knowledge on the subjects they will study in the university [9]. To deal with these differences, one of the solutions proposed by HE institutions is remedial education. Remedial education is defined as coursework below college-level offered at a post-secondary institution, and it has become a topic of considerable debate in HE [4]. For example, Calcagno [4] suggests that math and reading remedial courses have mixed benefits: remediation might promote early persis-tence in college, but it does not necessarily help students in the completion of college-level credits or eventual degree completion. Also, [23] compares the long-term academic out-comes of students who remediate successfully (achieve col-lege-level math skills) with those of students who achieve college-level math skills without remedial assistance, finding that remedial math programs are highly effective at resolving skill deficiencies.
Despite its significant role in higher education, evaluations of the effectiveness of remedial programs is still scarce in the recent literature, and even more so regarding the efficacy of remedial math programs [4], [23].
B. MOOCs As a Complement in On-Campus Courses
There is consensus in the literature that technologies can enhance the learning and teaching of mathematics, opening windows on learners’ knowledge development by means of interactions with digital tools that mediate learning trajecto-ries. However, there are challenges involved in balancing the use of mental, paper-and-pencil and digital tools in both assessment and teaching activities [13], and MOOCs could be a powerful resource for this purpose [11].
From the cMOOCs to the xMOOCs, including the hMOOCs [11], the flipped classroom pedagogy model that uses MOOCs, and the remedial pedagogy with MOOCS, higher education institutions are working and studying different models to extend their curriculum and offer new opportunities for stu-dents [17], [22], [28].
Most prior studies have analyzed the use of MOOCs to sup-port the flipped classroom strategy, where the MOOC is used as a driver in the classroom experience. For example, some publications by Eric Mazur, one of the main references in this strategy worldwide, suggest that the flipped class results in sig-nificant learning gains when compared to traditional instruction [8], [10]. Another example in this line is the case study of an engineering course imparted by the School of Engineering at Pontificia Universidad Cat!olica de Chile (UC-Engineering). The results of this study show that up to 96 percent of the stu-dents were active in the MOOC before class, and stustu-dents who were more active showed better scores on the course exams than those less active [24].
There are also some studies that analyze MOOCs as a replacement or MOOCs as an added value. That is, using MOOCs for replacing a traditional course, or using it for com-plementing a traditional course. For example, one study shows
that Stanford University integrated MOOCs in a traditional course [14]. The results show that students’ attendance increased by 20 percent and their engagement with the course content increased by 40 percent [6]. Another example was proposed by the University of Washington, which introduced MOOCs for supporting a blended learning methodology in a traditional biology class. They were able to reduce its fail rate from 17 percent to 4 percent. Furthermore, the approval rates of the course increased from 14 percent to 24 percent since the initiative [2].
Other researchers have investigated the use of MOOCs as a remedial course or “zero course”. Universidad Carlos III de Madrid, for example, analyzed the effect of a zero-level course where students took a diagnostic and a final exam. The results indicated that students increased by 21 percent the score in the final exam after the course [19]. Also, the Univer-sity of California at Irvine (UCI) developed a course to help under-prepared students who had been accepted to the UCI gain skills and knowledge that would increase their probability of success in a large freshmen STEM course. Results showed that university students entering with low preparation outper-formed students who had the credentials to become biology majors [15].
All these cases offer some understanding on how MOOCs can be reused in different scenarios. However, there is not enough empirical evidence that fully analyzes and reports on the effects of students’ adoption and student’s learning out-comes of these types of initiatives.
III. INNOVATING WITHMOOCS AS ACOMPLEMENT
A. Context
UC-Engineering accepts over 700 freshmen students every year by conducting a rigorous selection process. To get accepted in this program, students have to achieve outstanding results in a national admission. This exam evaluates their knowledge in math, science, and language (Spanish). Addi-tionally, they have to be in the top positions of their high school rankings and have obtained excellent high school grades. Even so, the new students have very different back-grounds on basic calculus concepts to successfully address the calculus courses that are imparted in the first year. Consequently, most of the students struggle during their first semester to pass their courses. The average fail rate of the first semester math courses (Calculus I and Algebra) is over 30 percent in each.
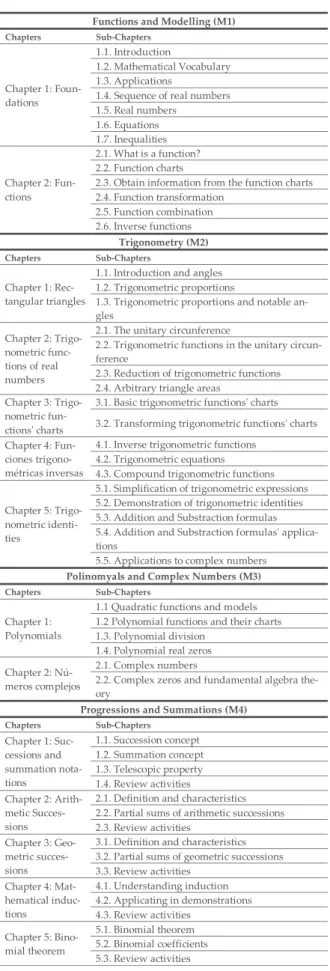
To address this problem, UC-Engineering freshmen have been required to take a calculus diagnostic exam since 2014. The DE is divided into 4 modules: Functions and Modelling (M1), Trigonometry (M2), Polynomials and Complex Numbers (M3), and Progressions and Summations (M4). Students must pass each module separately. There are three different instances of this exam. The first instance (DE-Instance 1) is right after they are informed that they have been admitted in engineering (about two months before classes start). After DE-Instance 1, students who fail in a specific content may take a 2-day inten-sive traditional course on each of the failed modules where
professors reinforce main theoretical topics and facilitate students’ learning with guided exercises. This course is volun-tary. After undertaking traditional courses, students have a sec-ond opportunity to take the diagnostic exam (DE-Instance 2). Either if they choose not to take the remedial courses or if they fail one or more modules, students are given a third opportunity to take the diagnostic exam in the modules they have not passed, right before classes begin (DE-Instance 3).
B. MOOCs’ Structure and Components
To help students study for the diagnostic exams, the school decided to produce 4 MOOCs. There is one course for each module as a complementary support, but they do not follow the same structure than the remedial courses offered in January. The MOOCs were produced by 3 teaching assistants and were deployed in the Open EdX platform as part of the UC-Engineering online initiative (“Ingenier!ıa UC Online”: http://online.ing.uc.cl/). These courses were produced as MOOCs and not SPOCs in order to make them available to everyone. Nonetheless, all the contents of the MOOC were designed to align with the learning objectives and topics addressed in the diagnostic exam. All the MOOCs are self-paced, so no restrictions or deadlines were proposed.
The four MOOCs are Functions and Modelling (M1), Trigo-nometry (M2), Polynomials and Complex Numbers (M3), and Progressions and Summations (M4). The different resources available in the MOOCs are videos, readings, example exer-cises, exercises and GeoGebra Interactive Modules. The videos are recordings of teachers explaining different concepts, as if they were teaching a class. The readings are lectures or texts that explain a concept, like a chapter in a book. The example exercises are problems with their resolutions step by step. The exercises consist in problems that the students must solve and respond in the platform. Once they submit their answers, they get immediate feedback as if to whether they got it right or wrong. All the assessments are multiple choice (quizzes and exams). Finally, the course includes exercises designed with GeoGebra, a software for studying algebra and geometry capa-ble of representing geometric figures, functions and charts. It also allows the user to create geometric constructions and insert equations and algebraic formulas to show on a graph. These graphs can be embedded in MOOCs in the Open EdX platform as an exercise, so students can interact with the figures and functions in real time. Each MOOC has different assessments depending on their structure.
Tables I through III show in detail how each MOOC is structured, their chapters and sub-chapters, how many videos (V), readings (R), example exercises (EE), exercises (E) and GeoGebra Interactive Modules (GG) they have, and finally, each MOOCs’ assessments.
IV. ASSESSMENTS OF THEINNOVATION
Since participating in the MOOCs was voluntary, this study analyzes the impact of this initiative both in terms of students’ adoption and learning outcomes. Specifically, two research questions were addressed:
TABLE I MOOCS’STRUCTURES
! RQ1. What is the students’ adoption of this MOOC
initiative? This question aims at studying who uses the MOOCs, and how and when these are used. Adoption can be measured by the levels of use of an innovation [5], for example, collecting quantitative data from their actual use [1]. Consequently, we ana-lyzed the students’ movements in the MOOCs from the beginning to the end of the study to understand the activity patterns in the different periods. We also analyzed the students’ interactions with the vid-eos, readings and the exercises (quizzes and other activities).
! RQ2. What are the effects of participating in the
MOOCs in terms of students’ learning outcomes?This question aims at understanding whether using the online platform gives the students a better chance of passing the diagnostic exam. For this, we will analyze whether the average scores of active students were higher than the ones of non-active students in the different DE instances, and determine whether there’s an association between students’ adoption and students’ approval rates.
A. Description of the Pilot Study
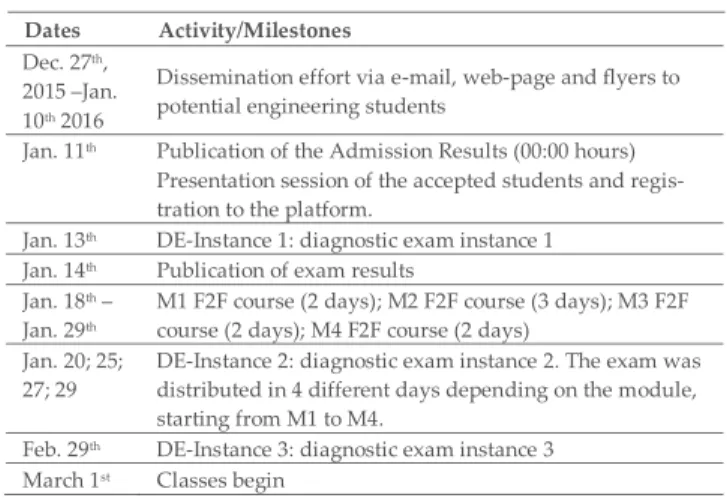
The case study took place at UC-Engineering between December 27th, 2015 and March 1st, 2016.
Students were required to take a diagnostic exam to assess their prior knowledge and skills in calculus, and they were given 3 instances to pass it or they would fail a first semester calculus course (Calculus I). Table IV shows a time line of the different milestones in this case study.
B. MOOC Integration Proposal
The MOOCs were available before the students knew that they had been admitted in UC-Engineering. MOOCs were announced by e-mail and flyers a week before releasing the admission results to all those that had manifested their interest in studying at UC-Engineering. Additional outreach to students involved posting in the official Engineers’ web page, so all pro-spective students were informed that they could register on the platform and take the MOOCs. Once accepted, all freshmen were registered in the MOOC provider platform during the admission day, so all of them could access the 4 MOOCs.
Students had 2 days to study for DE1 since they were noti-fied that they had been accepted, and all the dissemination activities suggested to study from the MOOCs as much as possible.
For DE2, UC-Engineering offered the students remedial face-to-face (F2F) courses from 9 am to 5 pm. During this period, the MOOCs were promoted through flyers and emails. Additionally, two teacher assistants were available from 5 pm to 8 pm every day on campus in a classroom, hoping the stu-dents would go study there after the remedial course. In aver-age, they received around 10 students each day.
Finally, students had one month to study for DE3. During this time, we did not provide any extra support other than the online MOOCs.
C. Curricular Alignment
The MOOCs were created to help students study for the diagnostic exam. Therefore, everything that is taught in the MOOCs is asked in the DE.
TABLE III MOOCS’ASSESSMENTS
TABLE II MOOCS’CONTENTS
TABLE IV PILOTSTUDYTIMELINE
D. Methodology and Data Gathering Techniques
To address the two research questions, we used a mixed method approach [7]. Quantitative and qualitative data was collected and analyzed in parallel to better understand students’ adoption and learning outcomes.
Concerning quantitative data, we worked with the students’ scores in the 3 instances of diagnostic exams (ScoresDEX-MY; where X goes from 1 to 3 and corresponds to the diagnostic exam instance, and Y goes from 1 to 4 and corresponds to the module). All diagnostic exams contemplate a 0-100 percent scale, where a 100 percent score would mean that they got every question right; students pass the exams if they get a score of 60 percent or higher.
The students’ prior knowledge was determined by analyzing the students’ scores in the Chilean university admission system composed by: Math (MAT), Science (CIE), and Language (LEN) scores in the national university admission exams, along with a score associated to their high school grades (NEM) and class ranking (RKG). All these individual scores have a scale from 0 to 850. Finally, the admission score (PING) is computed as: 20 percent NEM, 20 percent RKG, 10 percent LEN, 35 percent MAT and 15 percent CIE. This datum was taken as a reference for students’ prior knowledge and skills.
To classify the students into “active” and “non-active” depending on their interaction with the MOOC courses, we worked with Open EdX MOOC Platform Movement Logs in each MOOC for each month that the experiment took place. We analyzed the students’ movements in the MOOCs in three separate periods: before Instance 1 (BI1); after Instance 1 and before Instance 2 (BI2); and after DE-Instance 2 and before DE-DE-Instance 3 (BDE-I3). Active stu-dents (A) are the ones who have registered any movement in a module of the MOOC. Non-active students (NA) are the ones who either did not register in a module or registered without conducting any interaction or movement.
To collect qualitative data, we conducted telephonic semi-structured interviews, a strategy used to go into de-tail about certain topics the researchers wish to analyze [18]. In this case, the main objective was to gain more information about the actual usage students were giving the MOOCs, beyond passing the DE. The semi-structured interviews included questions about two main topics: Adoption and Learning. The interviews were carried out because in our prior work we identified that
students had a positive adoption of the initiative, but we did not understand the reasons. Concerning adoption, the goal was to get to know the students that used the platform; the time they spent on the courses; and why they used the MOOCs (for exam-ple before a diagnostic exam, before a class, for homework, etc.). Regarding learning, we included questions to find out if the courses helped students remember or formalize some con-cepts; if the courses contributed to their academic performance; and if students perceived that their performance improved after interacting with the course.
E. Participants and Samples
The total population of this study were 771 students, the total amount of new freshmen UC-Engineer students in 2016. Of these students, 98 percent(N ¼ 752Þ took the diagnostic exams on Instances 1, 2 and/or 3, representing the sample for the quantitative data analysis of this study. Table V describes the number and percentage of students who passed (Students Passing, SP) and failed (Students Failing, SF) in each diagnos-tic exam instance.
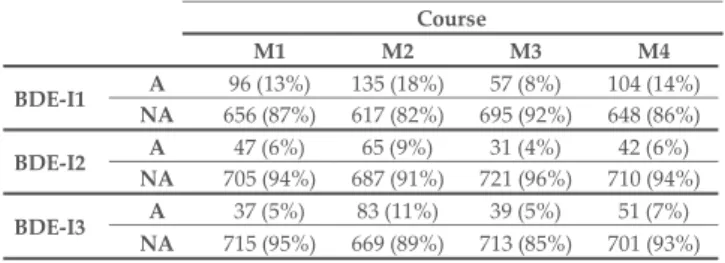
We classified the students into “active” and “non-active” depending on their interaction with the MOOC courses. Table VI shows the percentage of active and non-active stu-dents per module in each of the three periods explained in Sec-tion 3.3. [20] reports a different number of active and non-active students for BDE-I1 and BDE-I2 than the current Table VI, because in this extension we are working with a big-ger database which includes students that took the DE on Instance 3 and could not have taken the DE in the previous instances, in which case they were not considered in the data-base of the first article.
164 students were invited via e-mail to participate in the interviews. From this population, 34 students had used at least one of the MOOCs during the first year of study; 11 students attended the F2F remedial courses; and 119 students registered at least one entry in one of the MOOCs. From these 164, 8 stu-dents agreed to participate in the semi-structured interviews: 1 from the group that had used at least one of the MOOCs dur-ing the first year of study; and 7 students that had registered at least one entry in one of the MOOCs.
F. Data Analysis
Both quantitative and qualitative data was used to answer the two research questions. Quantitative data was analyzed TABLE V
NUMBER ANDPERCENTAGE OFSTUDENTSTHATPASSED(SP)ANDFAILED
(SF)THEDIFFERENTMODULES INEACHDIAGNOSTICEXAMINSTANCE
TABLE VI
NUMBER ANDPERCENTAGE OFSTUDENTSTHATWEREACTIVE(A)
through statistical methods: t-Student tests, Welch t-tests and Chi-square ðx2Þ tests. Qualitative data extracted from the semi-structured interviews was transcribed and analyzed using an open coding technique supported by NVivo 11 software. The predefined nodes for the analysis were Adoption and Learning. Also, an emerging category about students’ adop-tion was identified: Opinion about Resources. We cross-ana-lyzed this both types of data using triangulation methods to answer the research questions [26]. All data gathered from the study, as well as the analyzed data is available online (https:// gitlab.com/T4DLerning/
TransactionsOnLearningTechnologiesPaper1).
To address RQ1 about the students’ adoption of the MOOC initiative, we plotted the number of movements in the MOOCs in a bar graph from the beginning to the end of the study to understand the activity patterns in the different periods. Addi-tionally, we analyzed the students’ interactions with the videos, readings and the exercises (quizzes and other activities). We used this data to get an idea about whether the students used the MOOC for reviewing theoretical concepts through videos, readings or for exercising. The results of this analysis were cross-analyzed with qualitative data to extract conclusions about how students used the MOOCs and their main reasons.
To address RQ2 about the students’ learning outcomes, we conducted several statistical analyses in Stata/IC 14.0. First, we performed Welch t-tests to determine whether the average scores of active students were higher than the ones of non-active students in the different DE instances. Second, we con-ducted a Chi-squared test to determine whether there’s an association between students’ adoption and students’ approval rates. Third, we performed statistical matching by using pro-pensity scores based on students’ prior knowledge to estimate the effect of students’ MOOC adoption on their performance in the diagnostic exams. NEM (high school GPA score), MAT (mathematics score), CIE (science score), and RKG (ranking score) were considered the covariates. As the treatment, we used the categorical variables on students’ activity in a
MOOC module. Students’ scores in the different DE instances were defined as the outcome variables. We paired the nearest neighbors with a caliper of 0.1, besides evaluating the balance of covariates between active and non-active students before and after the matching. The results of the statistical analysis were also complemented with data from the semi-structured interviews to understand the students’ learning benefits from using these courses.
V. RESULTS
This section reports on the results obtained from the analy-sis to address the two research questions. Section 4.1 presents the results about the students’ adoption of the MOOC initia-tive, and Section 4.2 about the effects on students’ learning outcomes. For organizing the results and facilitate their read-ability, we use tags to refer to the results: AR-X to refer to the Adoption Results; and LOR-X to refer to the Learning Out-comes Results. The X indicates the number of the result.
A. Students’ Adoption of the MOOC Initiative
Table VII shows the summary of the mixed method results on students’ adoption, including the data source(s).
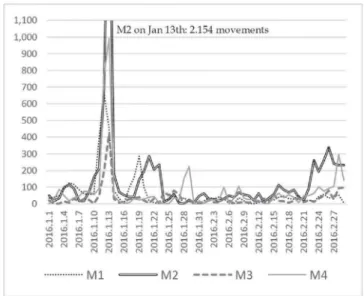
Regarding AR-1, Fig. 1 shows that the days before each diag-nostic Exam (January 13th, January 20th- 29th, and February 29th), the MOOCs have much more movement than the rest of the two months.
The average number of interactions per day per MOOC dur-ing the three days before DE-Instance 1 is 591, whereas it is only 154 the 3 days before DE-Instance 2 per day per MOOC, and 130 before DE-Instance 3. M2 has the major activity dur-ing the case study period, reachdur-ing 8.200 movements in total, followed by M4 with 4.611 movements, then M1 with 3.919 and finally M3 with 2.027. The results of the semi-structured interviews indicate that the students used M2 more frequently because these topics were not studied in high school: “Trigonometry was the hardest for me, because I had not seen TABLE VII
RESULTS ONSTUDENTS’ADOPTION OF THEMOOC INITIATIVE
Fig. 1. Total amount of movements in the four MOOCs during the case study period.
it in school (Interview 4)”; “I took the M1 and M2 MOOCs because there were many concepts I had not studied in school (Interview 5)”.
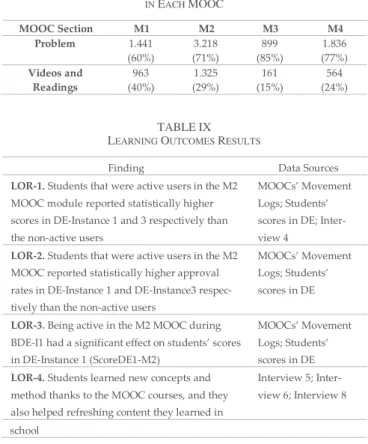
Regarding AR-2, Table VIII shows that the exercise sections registered more interactions than the video and readings’ sec-tions in the 4 MOOCs. Even more, in the interviews a student stated, “I saw the videos whenever I wanted” [Interview 7], indicating that the students used the videos as a support for practicing.
Regarding AR-3, UC-Engineering students admitted in the interviews using the calculus and chemistry MOOCs to study for other courses, for example: “Recently I took Chemistry II, and I had no previous knowledge about chemistry so I took the chemistry MOOC (that UC-Engineering provides) before the semester began” [Interview 3]; “I used the MOOCs before the semester began because I had taken Calculus II and I wanted to be prepared [Interview 8]”.
Finally, during the interviews, students stated that they would like to have more MOOCs to study from: “I found the MOOCs too short, they could have more contents” [Interview 3]; “These courses could be useful as an extra support for when we take more difficult courses” [Interview 4].
B. Effects of the MOOC Initiative on Students’ Learning Outcomes
Table IX shows the results about the effects on Learning Outcomes (LOR) based on the quantitative and qualitative data. With regards to LOR-1, Table X shows the results of the Welch t-tests to determine whether active users obtained
higher average scores than those who were non-active (one tail). First, as was expected, active users in the MOOCs obtained higher average scores than the non-active users in DE-Instance 1 for all four exam subjects, as was reported in [20]. With a confidence level of 95 percent, these results show that active students’ scores are particularly higher for the ones that interacted with the M2 MOOC. This MOOC module reg-istered the highest amount of learner movements (see Fig. 1). Also in the interviews, students mentioned how much they used and learned from the trigonometry MOOC (M2) course: “In school I was taught the basic calculus concepts, but I only knew a little trigonometry so I studied with the MOOC for the diagnostic exam”. Finally, active users during BDE-I3 in M4 also obtained significantly higher average scores than those who were non-active in the MOOC.
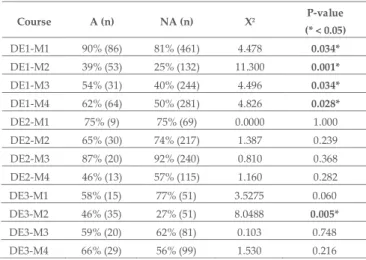
Regarding LOR-2, Table XI shows the results of the Chi-square test (x2) that determines whether there is an association between students’ activity in a MOOC module and the approval rates. Particularly, it shows the approval rates of stu-dents who were classified as active (A) and non-active (NA). With a confidence level of 95 percent, the group of students who were active in the M2 module during BDE-I3 had higher approval rates in DE-Instance 3 than those who were not active. The same result replicates for the group of students TABLE IX
LEARNINGOUTCOMESRESULTS
TABLE X
WELCHT-TESTRESULTS TOCOMPAREAVERAGESCORES INDE BETWEEN
ACTIVE ANDNON-ACTIVESTUDENTS
TABLE VIII
INTERACTIONSWITHEXERCISES, VIDEOS,ANDREADINGSCAPTURED INEACHMOOC
that were active in all four modules during BDE-I1, as was reported in [20].
LOR-3 was estimated by a successful peer matching using the scores in DE1-M2 as the outcome, students’ activity in M2 MOOC as the treatment, and the variables that describe students’ prior knowledge as the covariates. Table XII shows the effects of MOOC activity on the DEI scores according to propensity score matching(caliper ¼ 0:1Þ. By matching, the variance ratios between active and non-active students become closer to 0 for all the covariates, except NEM ð% 0:15Þ. Additionally, the standardized differences became all closer to 0. Then, comparable 667 pairs were generated from observable data. According to these comparable groups, with a 95 percent confidence level, it can be said that being active in a MOOC module had statistically positive effects on the DE1 test scores of the respective module, particularly in Modules 2. Active students in M2 MOOC had, on average, 15 percent higher DEI-M2 test scores than those who were non-active.
Finally, regarding LOR-4, in the interviews the students reinforced that they had learned from the MOOCs: “The MOOCs clarified many concepts that I did not know or had forgotten”; “The MOOC taught me, everything in there was new to me”; “I learned a few methods and definitions”; “I think it helped me remember many things. Thanks to the MOOC I was much more prepared for the calculus and algebra first semester courses”.
VI. DISCUSSION ANDCONCLUSIONS
The lessons reported in this section were obtained from reflecting on the results from both the student’s adoption and learning outcomes. To highlight those aspects of the study that could be applied to other contexts, we analyze the issues that emerge from this work as future work, and report the limita-tions that would deserve further study.
First, students are not yet enough prepared to adopt MOOCs for remedial studies if they are not mandatory.The
results of our study show that between 4 percent (the mini-mum) and 18 percent (the maximini-mum) of the students were active in the MOOCs under study during the case study period, reaching its peak for DE-Instance 1. Considering how the online initiative was promoted within the students, these per-centages are less than what was expected. This result means we must improve the promotion of the initiative for future interventions. For future work, we would like to better under-stand how students self-regulate in these type of courses and what type of support they need to encourage future freshmen students to use the MOOCs and obtain better results in the diagnostic exam and remedial courses.
Second, students that used the MOOCs before the diagnos-tic exam had significantly more chances of obtaining better scores and of passing this exam than students who did not study from the MOOCs. By comparing students with similar prior admission scores [14], we observed that students who used any of the four MOOCs during BDE1 had better chances of passing the DE and would obtain better results than non-active users. In this extension, we were also able to prove that, during BDE3, students who were active in M2 also obtained better scores and had a better probability of passing DE-Instance 3 than students who did not study from the MOOC. Although these results expand current knowledge on MOOCs’ effects, the lack of randomization limits the external validity of these findings. In order to test the effect of a remedial MOOC in other educational setting, variables that signal prior knowledge should be identified for each particular context in order to build comparable groups of students.
Third, students tend to be active in the MOOCs more inten-sively before the exams, especially in M2.Most of the move-ments in the courses were registered before the diagnostic exams. In addition, differences were observed on the activity patterns in each of the courses. Course M2 registered more movements than the other 3, followed by M4, then M1 and finally M3. Since all the courses where prepared by the same teachers and used the same resources, we sustain that this dif-ference can be due to the needs of the students on the different course topics. For example, the national admission test does not evaluate trigonometry (M2), a branch of mathematics that is required for succeeding in engineering calculus courses. Therefore, the availability of M2 might have raised student awareness of the importance of this topic for succeeding not only in the diagnostic test, but also in their first year of college. Further research on MOOCs used as a complement for reme-dial post-secondary education should be addressed. But on the TABLE XI
APPROVALRATES OFSTUDENTSWHOWERECLASSIFIED ASACTIVE(A)
ANDNON-ACTIVE(NA) MOOC USERS(x2 RESULTS)
TABLE XII
EFFECTS OFMOOC ACTIVITY ON THEDE1 SCORESACCORDING TO
other hand, this difference could simply be due to the quality of the MOOCs. Moreover, we need to consider the students’ diversity, since some students might be interested only in spe-cific sections of the course. Studies have reported that although most of the participants in a MOOC tend to follow a linear path through the course content, these paths can vary depending on characteristics such as the age or the country of origin [7], [12]. Also, there are students who lose interest as they advance in the courses, because they feel unable to achieve the MOOCs’ goals [27].
Fourth, service MOOCs should be designed for diversifying learning activities and exercises. A curriculum narrowing effect has emerged from the fact that the national admission test is not evaluating trigonometry, a branch of mathematics that is required for succeeding in engineering calculus courses. Therefore, the availability of M2 might have raised student awareness of the importance of this topic for succeeding not only in the diagnostic test, but also in their first year of college. Further research on MOOCs used as a complement for improving academic preparation for college should be addressed. Future work includes obtaining quantitative data about the student’s perception of their adoption through ques-tionnaires, to make certain generalizations that cannot be made with the interviews and focus groups.
In conclusion, this paper has shown that offering students different MOOCs as a complement study resource for an on-campus diagnostic exam is a complex process that involves many variables and dimensions that need to be considered for the students to use the MOOCs and learn from them. How-ever, the benefits of this effort give those students better chan-ces of succeeding in the corresponding exams, and getting them more involved in their own learning process.
REFERENCES
[1] C. Alario-Hoyos, M. P!erez-Sanagust!ın, C. Delgado-Kloos, G. H. A. Parada, M. Mu~noz-Organero, A. Rodr!ıguez-de-las-Heras, “Analysing the impact of built-in and external social tools in a MOOC on educational technologies,” in Scaling up Learning for Sustained Impact. D. Hern!andez-Leo, T. Ley, R. Klamma, A. Harrer, eds., vol. 8095, Berlin, Germany: Springer, 2013. [2] N. Aronson, K. Arfstrom, and K. Tam, “Flipped learning in higher
edu-cation,” Always Learning. London, U.K.: Pearson, 2013.
[3] T. A. Bekele, “Motivation and satisfaction in internet-supported learning environments: A review,” Educ. Technol. Society, vol. 13, no. 2, 116–127, 2010.
[4] J. C. Calcagno and B. Terry Long, “The impact of postsecondary reme-diation using a regression discontinuity approach: Addressing endoge-nous sorting and noncompliance,” New York, NY, USA: National Center for Postsecondary Research, Jul. 2008.
[5] R. Christensen and G. Knezek, “Instruments for assessing the impact of technology in education,” Comput. Schools, vol. 18, no. 2/3, pp. 5–25, 2001.
[6] A. Collier and M. Caulfield, “What happens in distributed flips? Investi-gating students’ interactions with MOOC videos and forums [Web log post],” May 2, 2013. [Online]. Available: http://redpincushion.me/2013/ 05/02/what-happens-in-distributed-flips/
[7] J. W. Creswell, V. L. Plano Clark, M. L. Guttmann, and E. E. Hanson, “Advanced mixed methods research design,” Handbook Mixed Methods
Social and Behavioral Research, A.Tashakkori and C. Teddlie, Eds., Thousand Oaks, CA, USA: Sage, 2011, pp. 209–240.
[8] M. Crouch, “Peer instruction: Ten years of experience and results,”
Amer. J. Phy.vol. 69, pp. 970–977, 2001.
[9] M. R. Estela-Carbonell, A. Codina, and J. Poblet-Puig, “Towards the STEM knowledge homogenization of pre-university students in 21st century,” in Proc. - Frontiers Edu. Conf. FIE. vol. 2016, 2016, doi: 10.1109/FIE.2016.7757358.
[10] K. P. Fulton, Time for Learning: Top 10 Reasons Why Flipping the
Classroom Can Change Education. Thousand Oaks, CA, USA. Corwin a Sage Company, 2014.
[11] F. J. Garc!ıa-Pe~nalvo, A. Fidalgo-Blanco, M. J. Sein-Echaluce, “An adaptive hybrid MOOC model: Disrupting the MOOC concept in higher education,” Telematics Inf., vol. 35, pp. 1018–1030, 2018.
[12] P. J. Guo and K. Reinecke, “Demographic differences in how students navigate through MOOCs,” in Proc. 1st ACM Conf. Learn. @ Scale
Conf., pp. 21–30, 2014, doi: 10.1145/2556325.2566247.
[13] C. Hoyles and J. B. Lagrange Mathematics Education and
Technology-Rethinking the Terrain. Boston, MA, USA: Springer-Verlag, 2010. [Online]. Available: https://doi-org.ezproxy.puc.cl/10.1007/978-1-4419-0146-0
[14] M. Israel, “Effectiveness of integrating MOOCs in traditional class-rooms for undergraduate students,” Int. Rev. Res. Open Distrib. Learn., vol. 6, no. 5, pp. 102–118, 2015.
[15] S. Jiang, A. E. Williams, M. Warschauer, W. He, and D. K. O’Dowd, “Influence of incentives on performance in a pre-college biology MOOC,” Int. Rev. Res. Open Distance Learn., vol. 15, no. 5, pp. 99–112, 2014.
[16] S. Kellogg and A. Edelmann, “Massively open online course for educa-tors (MOOC-Ed) network dataset,” Brit. J. Edu. Technol. Special Issue:
Open Data in Learn. Technol., vol. 46, no. 5, pp. 977–983, 2015. [17] K. F. Hew and W. S. Cheung, “Use of Web 2.0 technologies in K-12 and
higher education: The search for evidence-based practice,” Ed. Res.
Rev., vol. 9, pp. 47–64, 2013.
[18] J. M. Morse, “Critical analysis of strategies for determining rigor in qualitative inquiry,” Qualitative Health Res., vol. 25, no. 9, pp. 1212– 1222, 2015.
[19] P. Mu~noz, E. M!endez, and C Delgado, “SPOCs for Remedial Education: Experiences at the Universidad Carlos III de Madrid,” in Proc. 2nd Eur.
MOOCs Stakeholders Summit (EMOOCS), Lausanne, Feb. 2014. [20] M. P!erez-Sanagust!ın, J. Hern!andez, C. Gelmi, I. Hilliger, and
M. F. Rodr!ıguez, “Does taking a MOOC as a complement for remedial courses have an effect on my learning outcomes? A pilot study on calculus,” in Proc. Eur. Conf. Technol. Enhanced Learn., 2016, pp. 221–233.
[21] M. P!erez-Sanagustin, I. Hilliger, C. Alario-Hoyos, C. Delgado Kloos, and S. Rayyan, “Describing MOOC-based hybrid initiatives: The H-MOOC framework,” in Proc. Eur. H-MOOCs Stakeholders Summit, 2016. [22] M. P!erez-Sanagust!ın, J. Maldonado, and N. Morales, “Informe del
estado del arte de adopci!on de MOOCs en la Educaci!on Superior en Am!erica Latina y Europa. Entregable MOOC Maker Project,” 2016. [Online]. Available: http://www.mooc-maker.org/wpcontent/files/D1.1-InformeMOOCLatam-vFINALDEFINITIVO_Spanish.pdf
[23] P. Riley Bahr, “Does mathematics remediation work?: A comparative analysis of academic attainment among community college students,”
Res. Higher Edu., vol. 49, no. 5, pp 420–450, 2008.
[24] F. Rodr!ıguez, J. Hern!andez, M. P!erez-Sanagust!ın, J. Pertuz!e, and C. Alario-Hoyos, “A MOOC-based flipped class: Lessons learned from the orchestration perspective,” Digital Education: Out to the World and
Back to the Campus, EMOOCs, (Lecture Notes in Computer Science 10254), K. C. Delgado, P. Jermann, M. P!erez-Sanagust!ın, D. Seaton, S. White, Eds., Cham, Switzerland, Springer, pp. 102–112.
[25] I. Spanjers, K. K€onings, J. Leppink, D. Verstegen, N. Katarzyna, C. Jeroen, and J. van Merri€enboer, “The promised land of blended learn-ing: Quizzes as a moderator,” Edu. Res. Rev., vol. 15, pp. 59–74, 2015. [26] P. Twining, R. S. Heller, M. Nussbaum, and C. C. Tsai, “Some guidance
on conducting and reporting qualitative studies,” Comput. & Educ., vol. 106, pp. A1–A9, 2017.
[27] R. K. Yin, “Preparing to collect cases study evidence,” Case Study
Research: Design and Methods. London, U.K.: Sage Publications, pp. 96–98, 2013.
[28] Y. Zhang, “Benefiting from MOOC,” in Proc. World Conf. Edu.
Multi-media HyperMulti-media Telecommun., vol. 2013, no. 1, pp. 1372–137X, 2013.