HAL Id: hal-02926879
https://hal.archives-ouvertes.fr/hal-02926879
Submitted on 1 Sep 2020
HAL is a multi-disciplinary open access
archive for the deposit and dissemination of
sci-entific research documents, whether they are
pub-lished or not. The documents may come from
teaching and research institutions in France or
abroad, or from public or private research centers.
L’archive ouverte pluridisciplinaire HAL, est
destinée au dépôt et à la diffusion de documents
scientifiques de niveau recherche, publiés ou non,
émanant des établissements d’enseignement et de
recherche français ou étrangers, des laboratoires
publics ou privés.
Distributed under a Creative Commons Attribution| 4.0 International License
carbon balance
P. Ciais, S.-L. Piao, P. Cadule, P. Friedlingstein, A. Chedin
To cite this version:
P. Ciais, S.-L. Piao, P. Cadule, P. Friedlingstein, A. Chedin. Variability and recent trends in the
African terrestrial carbon balance. Biogeosciences, European Geosciences Union, 2009, 6 (9),
pp.1935-1948. �10.5194/bg-6-1935-2009�. �hal-02926879�
www.biogeosciences.net/6/1935/2009/
© Author(s) 2009. This work is distributed under the Creative Commons Attribution 3.0 License.
Biogeosciences
Variability and recent trends in the African terrestrial
carbon balance
P. Ciais1, S.-L. Piao2, P. Cadule1, P. Friedlingstein1, and A. Ch´edin3
1LSCE, UMR CEA-CNRS, Bat. 709, CE, L’Orme des Merisiers, 91191 Gif-sur-Yvette, France
2Department of Ecology, College of Urban and Environmental Sciences, Peking University, Beijing 100871, China
3Groupe Analyse du Rayonnement Atmospherique, Laboratoire de Meteorologie Dynamique, Institut Pierre Simon Laplace,
ARA/LMD/IPSL, Ecole Polytechnique RD 36, 91128 Palaiseau Cedex, France Received: 8 July 2008 – Published in Biogeosciences Discuss.: 2 September 2008 Revised: 28 August 2009 – Accepted: 28 August 2009 – Published: 29 September 2009
Abstract. We modeled the African terrestrial carbon
bal-ance over the past century using a spatially resolved pro-cess based vegetation model (ORCHIDEE). The model is forced by changing climate and by human-induced changes in land use. It includes a simple parameterization of natural fires, but the natural vegetation dynamics was ignored. The period analyzed is 1901–2002. Overall, we found that the African net terrestrial carbon balance (Net Biome Productiv-ity, NBP) increased from a net CO2source to the atmosphere
of 0.14 Pg C yr−1in the 1980s to a net sink of 0.15 Pg C yr−1
in the 1990s. The land use flux alone is estimated to be a source of 0.13 Pg C yr−1caused by deforestation. This im-plies that climatic trends (mainly increasing precipitation) and CO2increase (fertilization effect), are causing a sink of
0.28 Pg C yr−1which offsets the land-use source. We found that the interannual variability of NBP is large, and mostly driven by photosynthesis variability. Over savannas, photo-synthesis changes from one year to the next are strongly cor-related with rainfall changes (R2=0.77 in northern Africa, and R2=0.42 in southern African savannas). Over forests, such a control by rainfall is not found. The main spatial pattern of interannual variability in NBP and photosynthe-sis/ecosystem respiration fluxes is related with ENSO, with dryer conditions prevailing over savannas during El Ni˜no and wetter conditions over forests. Climate induced variations in fire emissions respond to this ENSO forcing, but do not determine strongly the NBP interannual variability. Finally, we model that ecosystem respiration variations (mostly au-totrophic respiration) are correlated with those of
photosyn-Correspondence to: P. Ciais
thesis, on interannual as well as on decadal time scales, but this result is uncertain given the potential for acclimation for autotrophic respiration processes.
1 Introduction
Little is known about the carbon balance of the African con-tinent. One particularity of Africa is the extensive presence of savannas, with 15.1×10⁶km2, roughly 50% of the conti-nent (Menaut et al., 1985) and 70% of the World’s savan-nas. Savannas is a productive vegetation (Lieth and Wi-etaker, 1975; Scholes and Hall, 1996) as compared to other biomes, with an average Net Primary Productivity (NPP) of 720±200 gC m−2yr−1(Grace et al., 2006). Scaling up this estimate to the entire African savanna biome gives an NPP of 8.9 Pg C yr−1, that is 13.6% of the global NPP. Apart from savanna, forest is also an important biome in Africa. African forests are among the most pristine on Earth and contain large carbon stocks in biomass, up to 400 tC ha−1in Equa-torial rainforests (Brown et al., 1996). These forest carbon stocks are vulnerable to human impact and to climate change. In Africa, the population is increasing faster than in other regions of the globe (source: http://maps.grida.no/ go/graphic/population and development in africa). Further, more than 40% of the population lives in arid, semi arid or dry sub-humid areas, increasing the pressure on ecosys-tem services, in particular for agricultural production (Sul-tan et al., 2005; Ingram et al., 2002; De Rouw, 2004). Cur-rently, the human appropriation of NPP in populated regions of Africa is as high as in Europe, although actual NPP is
≈15% than natural vegetation NPP (Haberl et al., 2007).
Therefore, it is important to quantify the mean productivity of natural ecosystems, as well as its variability and trends, as the NPP of cultivated ecosystems is most likely lower than natural NPP in this region (Haberl et al., 2007). West Africa, the most densely populated region of the continent, is sub-ject to strong interannual and decadal precipitation changes. There is a drought trend in this region since 1950, followed by a reversal to wetter conditions after 1980 but rainfall has not yet reached back the 1950 levels. The recent drought strucked the region at the end of the 1960’s till the begin-ning of the 1990’s. The recent years (1994–2006) are char-acterized by still dry conditions in the Western Sahel while the Eastern Sahel benefits from wetter conditions (Ali and Lebel, 2009). Further, changes in global and local economic drivers, in population density and wealth are likely to modify regionally the regime of fires, which in turn will change the productivity and the carbon balance of savannas and forests. A second important motivation for studying the carbon balance of Africa is that deforestation in Central Africa, has been historically less pronounced than in other tropical con-tinents (Houghton et al., 2003), but is now catching up. Al-though their exploitation is partly regulated, Central African forests are under the threat of accelerated logging, with 30% of these forests being under logging concessions (Laporte et al., 2007). The wood removal from African forest increased from 500×106m3(roughly 0.125 Pg C yr−1)to 660×106m3 in 2005 (FAO, 2007). Recently, the area of forest and other woodlands in Africa decreased between 2000 and 2005 at a high rate of 6×10⁶ha per year, explaining more than half of the global decline in forest area (FAO, 2007). The African forest carbon stocks thus appear to be particularly vulnera-ble, although they have been spared from massive deforesta-tion so far (Canadell et al., 2009). In the context of the Re-duced Emission in Deforestation from Developing countries (REDD) program, it is thus important to quantify both the carbon stocks and the carbon fluxes of African forests, since these stocks may be larger and less affected by clearing than in other regions of the Tropics.
Unfortunately, in situ data are scarce and incomplete to characterize the African carbon balance. Apart from forest inventories in few countries (FAO, 2007), some ecosystem scale measurements (e.g. Abbadie et al., 2006) or regional campaigns like the SAFARI-2000 programme, the IGBP African transects initiated 10-years ago (Koch et al., 1995) have not delivered comprehensive information on carbon stocks and fluxes. In that context, remote sensing data and ecosystem models form the base of our knowledge to tackle the problem of quantifying and understanding the African carbon balance and drivers (e.g. Hiernaux et al., 2008).
In this paper, we use the ORCHIDEE (ORganizing Car-bon and Hydrology in Dynamic EcosystEms; Krinner et al., 2005) process-based global vegetation model to simulate the carbon balance of the African continent, and its component fluxes of photosynthesis, respiration and fire emissions. The period of study is the past century, allowing to analyze
in-terannual variability, and to gain further insights on decadal variability. After a description of the modeling framework (Sect. 2), we analyze the impacts of climate variability on carbon fluxes (Sect. 3). The associated continental-scale and regional modes of variability are discussed. Since the ORCHIDEE model also participated to the CAMIC (Car-boAfrica Model Inter Comparison) experiment, which covers the past 25 years (Weber et al., 2009), we will give more fo-cus here in the disfo-cussion of interannual variability during the past century. Then, the effects of long-term climate trends, rising CO2, and changes in land use are studied (Sect. 4). In
that context, the results of ORCHIDEE are evaluated against long-term satellite observation of vegetation greenness and against river runoff observations.
The goal of this preliminary work is not to provide a realis-tic quantitative assessment of the African carbon balance and its drivers. Neither at this early stage of the CARBOAFRICA project, nor through past projects, we have enough data to falsify or confirm the model predictions. Rather, we seek to gain a deeper understanding of our model’s behavior over Africa, attempting wherever this is possible to check and un-derstand the arising model output against global datasets.
2 Methods
2.1 Model structure
The ORCHIDEE model (Krinner et al., 2005) is a dynamic global vegetation model representing key vegetation pro-cesses governing biogeochemistry, soil hydrology, and bio-geography. The ORCHIDEE model includes three coupled submodels: a surface-vegetation-atmosphere transfer model SECHIBA (Ducoudr´e et al., 1993), a carbon dynamics model called STOMATE, and a vegetation dynamics model inspired from LPJ (dealing with fire, sapling establishment, light competition, and tree mortality). This later sub-model is non-activated (except for fires) because we will prescribe vegeta-tion changes. SECHIBA calculates the transfer of radiavegeta-tion, water and heat in the vegetation-soil-atmosphere system at half hourly time step. ORCHIDEE distinguishes over Africa 11 plant functional types with different photosynthetic, phe-nological and morphological characteristics. Root water up-take (U ) in ORCHIDEE is function of the biome-dependent constant c and of the dry soil depth d, defined as the dry fraction of the first soil moisture layer (U =e−cd, where U
varies between 0 and 1, c=0.8 for forest and c=4 for grass-land). The STOMATE submodel simulates plant phenology and key processes of ecosystem carbon cycling such as gross primary productivity (GPP), growth and maintenance respi-ration, NPP allocation, and litter and soil organic matter de-composition. Plant CO2assimilation interacts with stomatal
conductance and is regulated by environmental factors such as air humidity, temperature, radiation, and atmospheric CO2
concentration. Photosynthesis in ORCHIDEE is based on the
leaf model equations of Farquhar et al. (1980) for C3 plants and of Collatz et al. (1992) for C4 plants (savannas). Main-tenance respiration is a function of each living biomass pool and temperature. Growth respiration is computed as a frac-tion of the difference between assimilafrac-tion inputs and main-tenance respiration outputs to plant biomass. Heterotrophic respiration parameterization is taken from the CENTURY model (Parton et al., 1988). ORCHIDEE has altogether eight litter pools and six soil carbon pools.
In ORCHIDEE, fire is one of the main disturbance affect-ing the terrestrial vegetation. A simple parameterization fol-lowing McNaughton et al. (1989) is included in ORCHIDEE. The formulation of fire occurrence follows an intermediate approach between the fire history concept (using statistical relationships between the length of the fire season and the area burnt) and a process-oriented methodology (estimation of fire conditions based on litter quantity and moisture) such as for instance in Thonicke et al. (2001). Land use change is another major disturbance that can greatly modify terrestrial carbon storage and flux. The fractions of each land use type (PFT) are updated annually. After a transition in land use, a fraction of the aboveground heartwood and sapwood car-bon pools is transferred to three product pools with different turnover times. The carbon contained in other biomass pools which remain in the ecosystem is added to the litter reservoir, and eventually released to the atmosphere by decomposition. For tropical forest, fractions of 59.7%, 40.3%, and 0% of the harvested heartwood and sapwood aboveground biomass are assigned to product decay pools with 1 yr, 10 yr and 100 yr turnover time (Mc Guire et al., 2001). For temperate for-est biome (only 12% of African forfor-est) these fractions are 59.7%, 29.9%, and 10.4%. Carbon in these pools decays outside from ecosystems and outside of Africa if wood is ex-ported.
ORCHIDEE was validated against observed seasonal cy-cles of heat, CO2and H2O exchanges at various Fluxnet sites
around the world (Krinner et al., 2005; Ciais et al., 2005; Chevallier et al., 2006) but not specifically at savanna sites. It was evaluated as well as with the satellite derived spatial dis-tribution of vegetation traits and leaf density at global or re-gional scales (Krinner et al., 2005; Demarty et al., 2007). The interannual variability in leaf area index (LAI), carbon fluxes, and runoff is also consistent with that of historical satellite-observed LAI, seasonal cycle of atmospheric CO2, and
ob-served runoff, respectively (Piao et al., 2006, 2007, 2008). In the recent Dynamic Global Vegetation Model (DGVM) comparison of Sitch et al. (2008), the ORCHIDEE simulated response of net carbon exchange to future climate and rising CO2concentration was found to be intermediate among the
five participating DGVM, the other models being S-DGVM, HYBRID, TRIFFID and LPJ.
2.2 Input datasets 2.2.1 Climate data
The meteorological data used to drive ORCHIDEE include air temperature, precipitation, wet day frequency, diurnal temperature range, cloud cover, relative humidity of the air and wind speed. Monthly data sets, with a spatial resolu-tion of 0.5◦×0.5◦for 1901–2002, were supplied by the Cli-matic Research Unit (CRU), School of Environmental Sci-ences, University of East Anglia, UK (Mitchell and Jones, 2005). Data on annual atmospheric CO2concentration were
obtained from Rayner et al. (2005). The current soil texture map is based on Zobler (1986).
2.2.2 Land use data
Cropland area is prescribed each year from the dataset of Ra-mankutty and Foley (1999). We have combined this dataset with that of Goldewijk (2001) to account for the extent of pasture. The distribution of natural vegetation at each grid cell is derived from Loveland et al. (2000). The extent of natural vegetation varies with time as a function of the pre-scribed extent of cropland and pasture. The evolution of area for each type of African vegetation is shown in Fig. 6c.
2.3 Simulations setup
Using transient climate data during the period 1901–1910 and the 1860 atmospheric CO2concentration of 286.05 ppm,
we first ran the model at resolution of 2◦×2◦ until the car-bon pools reach equilibrium (spin-up of 10 000 yrs). Within a 2◦ grid cell, different vegetation types co-exist and each
will have a different equilibrium pool value. From this initial equilibrium state, two simulations from 1860 to 2002 were carried out, in order to separate the relative contribution of atmospheric CO2, climate change, and of land use change.
In simulation S1, atmospheric CO2 and climate were
var-ied. In simulation S2, atmospheric CO2concentration,
cli-mate and land use were varied. The individual effects of land use change were estimated by subtracting S1 from S2. Due to lack of climate data before 1901, the average climate data during the period of 1901–1910 was used for the 1860–1900 initialization.
In addition, we performed three shorter simulations over the period 1980–2002, to isolate the effects of temperature and precipitation alone, and the role of CO2. We checked that
our climate forcing dataset during that period is quite simi-lar to the dataset based upon CRU climate combined with NCEP analysis and TRMM satellite rainfall prepared by We-ber et al. (2009) for the CAMIC model intercomparison. In this way, our attribution of flux variations to rising CO2vs.
climate drivers could be extrapolated to the ORCHIDEE re-sults part of the CAMIC intercomparison. To perform the attribution of fluxes to each driving variable, we carried a simulation S3 in which only CO2is varied, a simulation S4
Table 1. Description of simulations used in this study.
Simulation Period Factors
S1 1901–2002 Climate+atmospheric CO2
S2 1901–2002 Climate+atmospheric CO2
+land use change S3 1980–2002 atmospheric CO2
S4 1980–2002 precipitation S5 1980–2002 temperature
in which precipitation alone is varied, and a simulation S5 in which temperature alone is varied.
The definition and abbreviations used in this paper for the different carbon fluxes (gross primary production, GPP, net primary production, NPP, heterotrophic respiration, TER, total ecosystem respiration, RH, autotrophic respiration RA, LUC the net land use change flux) are the same as Krinner et al. (2005). The long-term terrestrial carbon balance or Net Biome Productivity (NBP) is defined by NBP=GPP−TER−fire – LUC. The time period considered for mean fluxes is the last decade of the simulation 1990– 1999 unless otherwise specified.
3 Interannual variability
In this section, we analyze C flux interannual variations. Since 1981, the wettest year over the African continent is 1994, and the driest years are 1970 and 1981, with a se-ries of severe droughts in the Sahel during 1983–1984. Over the past century, extreme wet years occurred in 1909, 1940, 1961–1963. The dryest years are 1913, 1919, 1950 and poor rainfalls are observed in Sahel during the 1970’s. Every dry year is correlated with an abnormal source of CO2to the
at-mosphere, correlated with a drop in GPP and a drop in TER. An opposite response is found to wet years. We do not dis-cuss in details C flux variations during the earlier part of the past century, because of uncertainties in climate drivers. The authors of the CRU climate data state that for temperature : “Annual values are approximately accurate to ±0.05◦C (two
standard errors) for the period since 1951. They are about four times as uncertain during the 1850s, with the accuracy improving gradually between 1860 and 1950 except for tem-porary deteriorations during data-sparse, wartime intervals”
and that “Fluctuations over time in the numbers and
loca-tions of adjacent staloca-tions may lead to abrupt and incorrect changes in the climate of an individual grid box, particularly changes in variability” (Mitchell et al., 2004). In the
follow-ing, we analyze the results of simulation S1.
Five main results emerge from our analysis. First, the
in-terannual variability in the Net Biome Productivity (NBP) is of smaller magnitude than the variability of each gross
32 1
fig1 2
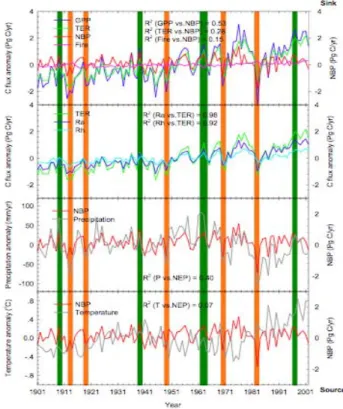
Fig. 1. Interannual changes in anomalies of total GPP, TER, Fire
emission, NBP, Ra, Rh, annual precipitation, and annual mean tem-perature from 1901 to 2002. Positive values of NBP indicate car-bon sink and negative values of NBP indicate carcar-bon source. Or-ange vertical bars indicate the dryest years, and dark green bars the wettest years.
flux separates, suggesting a strong coupling causing a
posi-tive correlation between Total Ecosystem Respiration (TER) and Gross Primary Productivity (GPP) in the model (Fig. 1). This result, valid over the entire African continent, is simi-lar to the one obtained by Ciais et al. (2005) in their analysis of the summer 2003 drought in Europe. Further, our sim-ulations suggest that TER variations are smaller than GPP variations, although in phase with them. In other words, the GPP anomalies are systematically correlated with TER anomalies of the same sign (Fig. 2). In the model, each strong drought such as 1913, 1984 (the last extreme drought in Western Africa), and 1987 causes a drop in GPP (Fig. 1) and in the subsequent allocation of assimilates to leaves and roots, which limits the production of litter for respi-ration. In addition, during these droughts, the decomposi-tion of soil organic matter is further reduced by soil dry-ness. However, the drought induced GPP reductions are al-ways larger in ORCHIDEE than the coincident TER reduc-tions (Fig. 2). In response to extreme drought years (Fig. 2) defined when continental scale precipitation drops by more than 5% below the 9-year average centered over that year, au-totrophic respiration (RA) is decreased by 16 gC m−2yr−1, more than twice the heterotrophic respiration (RH) decrease
33
1
fig2
2
Fig. 2. The average response of GPP, TER, Ra, Rh, carbon
emis-sion driven by fire, and NBP in Africa to the change precipitation. Highly wet year is the year when precipitation is higher than 5% of the 9-year means over the period surrounding each event by ±4 years; wet year is the year when precipitation is higher than 0–5% of the 9-year means over the period surrounding each event by ±4 years; dry year is the year when precipitation is les than 0–5% of the 9-year means over the period surrounding each event by ±4 years; and highly dry year is the year when precipitation is less than 5% of the 9-year means over the period surrounding each event by ±4 years.
of 7 gC m−2yr−1. The converse is true for extremely wet years. This shows that, in the ORCHIDEE model, the vari-ations in TER consecutive to those of GPP are two-third explained by changes in the modeled autotrophic respira-tion and one third explained by heterotrophic respirarespira-tion pro-cesses.
Second, the interannual variability in the Net Biome
Pro-ductivity (NBP) is driven by the interanuality of GPP rather than by the one of TER (Fig. 3). This feature of the
OR-CHIDEE model is rather widespread and has been diag-nosed in global simulations to extend from the southern half of Europe and North America (Ciais et al., 2006) to tropical regions. The mean coefficient of correlation be-tween NBP and GPP variations over the period 1901–2002 (R2=0.53; p<0.001) is greater than the one of NBP with TER (R2=0.28; p<0.001). The biome where NBP and GPP are best correlated is savanna south of the Equator (R2=0.63). The one where they are the least correlated is croplands in northern Africa (R2=0.41; see Table 2). For rainforests dis-tributed around the Equator, the correlation between NBP and GPP is lower than for savanna. This suggests a stronger decoupling in forests between TER and GPP, likely due to stem respiration and stem growth processes.
Third, the interannual variability of GPP and hence of the
carbon balance, is driven by rainfall fluctuations rather than by temperature at the continental scale (Fig. 4). The
correla-tion between GPP and rainfall (P ) during the interval 1901– 2002 is positive and significant over 70% of the grid points. The dominant driving climate variable also varies between each biome (Table 3). The correlation between GPP and P is the highest for savanna. About 77% and 42% of interannual
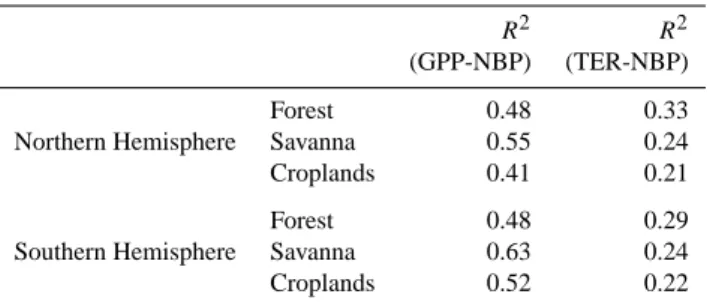
Table 2. ORCHIDEE model derived square of correlation
coef-fcient (R2)between GPP and NBP and TER and NBP for each biome.
R2 R2
(GPP-NBP) (TER-NBP)
Forest 0.48 0.33
Northern Hemisphere Savanna 0.55 0.24 Croplands 0.41 0.21
Forest 0.48 0.29
Southern Hemisphere Savanna 0.63 0.24 Croplands 0.52 0.22
variations of GPP in savanna is explained by precipitation, respectively in southern and northern savanna. In contrast, rainfall only weakly explains the interannual variability of GPP in forest (7% in northern, and 6% in southern forests), slightly less than temperature (9% in northern and 19% in southern forest). Moreover, the slope of the GPP vs. P re-gression is smaller for forest (0.5–0.6 gC m−2yr−1mm−1)
than for savanna (0.9–1 gC m−2yr−1mm−1). This result may be related to the fact that, in the hydrology module of ORCHIDEE, forests can access deeper water sources than grasses. In addition, the different growth environments may contribute to the different response of GPP to temperature and rainfall. Forests are always located in areas with rela-tively abundant rainfall, whereas savannas are distributed in more arid environments, where vegetation growth is more frequently limited by soil moisture (Knapp et al., 2001).
Fourth, the dominant spatial pattern of interannual
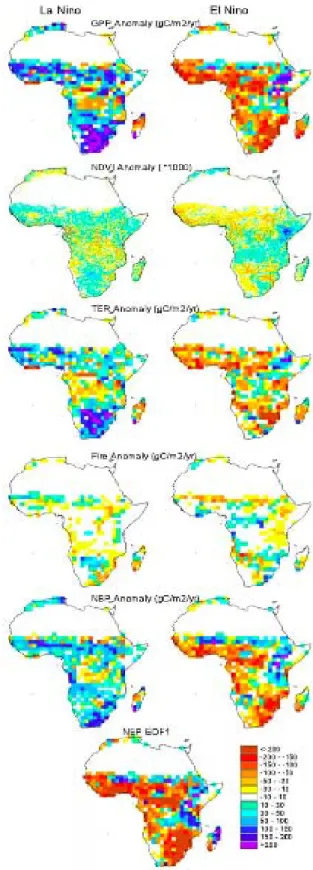
vari-ability in GPP, TER, fire emissions and NBP over Africa is related to the El Ni˜no mode of the global ENSO oscilla-tion, with less GPP, more fires, and a coincident net car-bon loss by ecosystems during El Ni˜no episodes (Fig. 5)
where a Principal Component Analysis has been applied to the ORCHIDEE output (ESRI, 1992). In this figure, the first Empirical Orthogonal Function mode (EOF), explain-ing 52% of the carbon balance variability, is nearly identi-cal to the average NBP anomaly during an El Ni˜no episode. At the continental scale, the impact of an El Ni˜no episode is however not associated with a uniform change in rain-fall/temperature patterns, but rather with regionally warmer and dryer conditions over Southern Africa from December to February and wetter conditions in the Great lakes region (see http://iri.columbia.edu/cgitest-bin/enso map-req1.pl). A La Ni˜na event manifests itself by a symmetrical pattern in anomalous rainfall (see also: http://iri.columbia.edu/climate/ ENSO/globalimpact/temp precip/region lanina.html). Over West Africa, the rainfall variability in Sudan and Sahel is also highly positively correlated with ENSO, but rainfall variabil-ity near the Guinean Coast is better predicted by the more local signal of SST anomalies in the Guinean gulf (Joly et
34
1
fig3
2
Fig. 3. Spatial distribution of the difference of explained interannual variance (R2) of GPP and TER on NBP. A blue color indicates that NBP variations are mostly driven by GPP variations. A red color indicates a dominant control of TER variations.
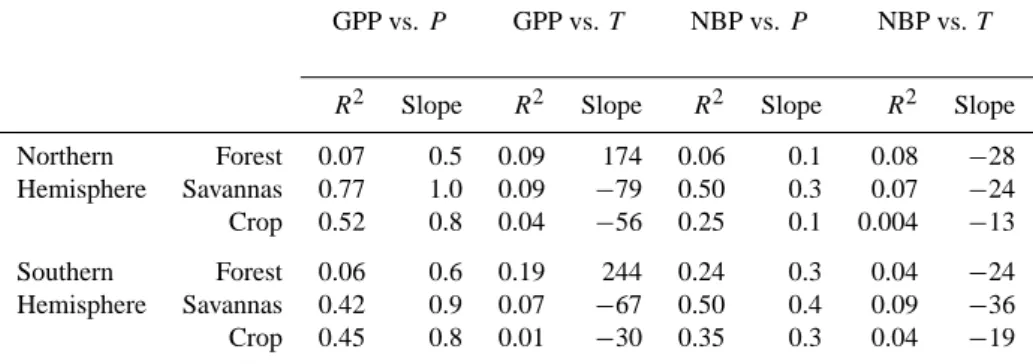
Table 3. Square of correlation coeffcient (R2)and slope (gC m−2yr−1mm−1or gC m−2yr−1◦C−1)between GPP and precipitation (P ), GPP and temperature (T ), NBP and precipitation (P ), and NBP and temperature (T ).
GPP vs. P GPP vs. T NBP vs. P NBP vs. T
R2 Slope R2 Slope R2 Slope R2 Slope Northern Forest 0.07 0.5 0.09 174 0.06 0.1 0.08 −28 Hemisphere Savannas 0.77 1.0 0.09 −79 0.50 0.3 0.07 −24 Crop 0.52 0.8 0.04 −56 0.25 0.1 0.004 −13 Southern Forest 0.06 0.6 0.19 244 0.24 0.3 0.04 −24 Hemisphere Savannas 0.42 0.9 0.07 −67 0.50 0.4 0.09 −36 Crop 0.45 0.8 0.01 −30 0.35 0.3 0.04 −19
al., 2007). There has been a rather abundant literature on possible carry-over effects of soil moisture on climate in Sa-hel, without yet a clear evidence for such a mechanism (Dou-ville et al., 2007). Similarly, vegetation feedbacks on climate in the driest part of Sahel have been suggested (Los et al., 2006; Zeng et al., 1999). From the response of NBP to El Ni˜no shown in Fig. 5, we expect forests in the inner-tropical band from the Congo basin to the Great Lakes region to store more carbon during El Ni˜no episodes, while savannas are ex-posed to dryer conditions and show a reduced photosynthetic activity (see NDVI anomalies in Fig. 5), and thus a reduced GPP and NBP (Fig. 2). The net carbon balance anomalies of savannas are however not only driven by GPP, but also by fire disturbance as well (e.g. Williams et al., 2007), with wet years being committed to larger fire emissions during the next dry season (Barbosa et al., 1999; Balfour and How-ison, 2001). In the fire module of ORCHIDEE, however, the role of fire emission (R2=0.15, P <0.001) in
explain-ing the interannual variability of NBP is much lower than that of GPP (R2=0.53, P <0.001) or even TER (R2=0.28,
P <0.001) (Fig. 1). For the magnitude in response to El Ni˜no (5 gC m−2yr−1), fire anomaly is much lower than that of GPP (50 gC m−2yr−1)and TER (20 gC m−2yr−1). Finally, although ENSO seems to dominate, other climate modes might explain regional variations in African C fluxes. In par-ticular heavy eastern Africa rainfalls were shown to correlate with the Indian Ocean Dipole mode (Saji et al., 2009).
A fifth result is that the African fire emissions in
OR-CHIDEE are only weakly sensitive to ENSO related climate variability, a feature also observed in satellite burned area records (Van der Werf et al., 2006). Fire emissions are linked
to climate variability both directly via a bigger fire risk dur-ing the dry season, and indirectly via the controlldur-ing effects of climate on the growth of biomass during the former wet season, as a source of fuel. African fire emission proxy data have been analyzed by Ch´edin et al. (2008) from the
35
1
fig4
2
Fig. 4. Spatial distribution of the difference of explained interannual variance (R2) of precipitation (P ) and temperature (T ) on the GPP and NBP.
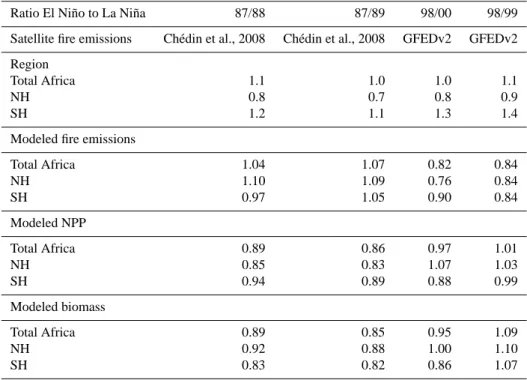
Table 4. Ratio of fire emissions (mainly in savannas) between El Ni˜no and La Ni˜na climate conditions. Comparison between satellite
emission datasets and ORCHIDEE modeled fire emissions, as well as NPP and biomass, the two latter variables being taken as a proxy of the fuel available for burning. GFEDv2=van der Werf et al., 2006.
Ratio El Ni˜no to La Ni˜na 87/88 87/89 98/00 98/99 Satellite fire emissions Ch´edin et al., 2008 Ch´edin et al., 2008 GFEDv2 GFEDv2 Region
Total Africa 1.1 1.0 1.0 1.1
NH 0.8 0.7 0.8 0.9
SH 1.2 1.1 1.3 1.4
Modeled fire emissions
Total Africa 1.04 1.07 0.82 0.84 NH 1.10 1.09 0.76 0.84 SH 0.97 1.05 0.90 0.84 Modeled NPP Total Africa 0.89 0.86 0.97 1.01 NH 0.85 0.83 1.07 1.03 SH 0.94 0.89 0.88 0.99 Modeled biomass Total Africa 0.89 0.85 0.95 1.09 NH 0.92 0.88 1.00 1.10 SH 0.83 0.82 0.86 1.07
Diurnal Tropospheric Excess (DTE), a variable derived from the TOVS satellite observations over the period 1987–1991 (Ch´edin et al., 2003, 2005). We also analyzed the GFEDv2 biomass burning C emission dataset estimated from EOS-Terra-MODIS burned area product (Giglio et al., 2006) pre-scribed to the CASA vegetation model over the period 1997– 2004 (Van der Werf et al., 2006). Both burned-area and DTE datasets indicate consistently over their respective period of
coverage that the El Ni˜no to a La Ni˜na ratio of fire emissions is only equal to 1.1 at the continental scale (Table 4), indi-cating no big change in fire emission between these two con-trasted ENSO modes. This feature is well captured by OR-CHIDEE (Table 4) over the whole period 1901–2002. Con-sidering only the period 1987–2000, the modeled El Ni˜no to a La Ni˜na ratio of emissions varies between 0.82 and 1.07, also in correct agreement with the satellite datasets.
36
1
Fig. 5. Anomalies of GPP, NDVI, TER, Fire emission, and NBP
during La Ni˜na years (average of 1976 and 1989) and an El Ni˜no year (average of 1983 and 1998). The bottom panel shows the pat-tern of the first (i.e. dominant) Empirical Orthogonal Function of the NBP variability, which resembles the El Ni˜no typical anomaly.
37
1
Fig. 6. ORCHIDEE modeled carbon emission due to land use
change from 1901–2002.
The satellite data further indicate (Ch´edin et al., 2008) that El Ni˜no to La Ni˜na emission ratio are lower than unity in northern tropical Africa, and higher than unity in southern tropical Africa. This asymmetric response of fire emissions in each hemisphere to ENSO is shown by the DTE fire proxy for the ratio of the 1987 El Ni˜no to the 1989 La Ni˜na. It is also shown by the GFEDv2 burned-area derived emissions for the ratio of the 1997/1998 El Ni˜no to the 1999 La Ni˜na (Table 4). For savannas, Van der Werf et al. (2006) further pointed out that interannual variability in fire emissions is decoupled from the variability in burned area, and thus could be driven instead by the amount of fuel available, by different vegetation structure and by human-controlled fire regimes.
To further test the hypothesis that a distinct El Ni˜no to La Ni˜na ratio of fire emissions in each hemisphere is driven by fuel load availability rather than by climate, we calcu-lated in ORCHIDEE the corresponding ratios of NPP, and of standing biomass before the fire season. But no evidence for an asymmetric response of NPP and biomass to El Ni˜no in each hemisphere was found (Table 4). This could reflect model shortcomings in capturing the interannual dynamics of biomass, more complex processes (lagged effects, nutrients), or regional decoupling between biomass available for fuel and actual fire emissions (human factors, landscape fragmen-tation, nature of combustions; see Archibald et al., 2009).
4 Decadal terrestrial balance and trends
Overall, we found that African NBP changed from a net carbon source of 0.14 C Pg yr−1 in the 1980s to a net car-bon sink of 0.15 Pg C yr−1 in 1990s. There are four main results arising from our set of simulations. The first re-sult is that land use change during the last two decades
implies a smaller source of CO2 to the atmosphere than
expected from a global bookkeeping model using national
land use area statistics (Houghton et al., 2003). The OR-CHIDEE modeled LUC flux is a source of 0.08 Pg C yr−1 in the 1980s and of 0.13 Pg C yr−1in the 1990s. This LUC source is close to the estimate of Jain et al. (2005), based on the same land use area data but using a simpler car-bon cycle model (0.09 Pg C yr−1 in 1980s). Our estimate is only half of the Houghton et al. bookkeeping model (0.19 Pg C yr−1in 1980s and 0.24 Pg C yr−1in 1990s). Over
2000–2005, the Houghton et al. model results give a LUC source of 0.24 Pg C yr−1, stable compared to the 1990’s esti-mate (Canadell et al., 2009).
A primary cause at the continental scale for a smaller LUC flux to the atmosphere in our simulation than in the bookkeeping model may be the very different rate of change in cropland area (Jain et al., 2005). The Ramankutty et al. (1999) dataset which we used, gives an African crop-land area of 1.4×10⁴km2 in the 1990’s with a strong de-creasing trend, compared to an area of 5.2×10⁴km2 used by Houghton et al. (2003) with an increasing trend. Jain et al. (2005) found that 0.036 Pg yr−1more carbon is emitted by land use change in the 1980s when applying the crop-land area of Houghton et al. (2003) instead of Ramankutty et al. (1999). The relatively small source contributed by land use changes in Africa as compared to other tropical forest re-gions reflects smaller deforestation rates before 2000. After 2000 however, forest clearing rates in Africa seem to have in-creased. In “hot-spot” regions of deforestation like Malaysia, Indonesia or in the Brazilian Amazon, most of forest sup-pression is driven by large clearings >500 ha (G. R. van der Werf, personal communication, 2008). Over these clearings are established palm oil plantations in Malaysia, Indonesia, Thailand (ECD, 2000; Stone 2007), and soybean fields
fol-lowed by ranching in the Amazon (Morton et al., 2006). In Africa, most of the forests remain state-owned and despite widespread low-intensity logging in Cameroon, in the north-ern part of the Republic of Congo and in the westnorth-ern part of Gabon (Lepers et al., 2005; Laporte et al., 2007), there is no policy or strong population/economic pressure in Africa which favors large scale clearing for agriculture or plantation (Lambin et al., 2003), unlike in Asia and South-America. In particular, agro-industrial scale clearing is absent, unlike in South-East Asia and Latin America.
The difference of 0.14 Pg C yr−1between our LUC source and the estimate of Canadell et al. (2009) illustrates the large uncertainties in estimating changes in forest area, forest biomass, and release of C from cleared areas. Grainger (2008) reported that constructing reliable trends in tropical forest area is difficult, with evidence for decline still being unclear. For Africa, based upon different succes-sive Forest Resources Areas census from FAO (1982, 1993, 2001), he reported a mean forest area ranging from 5.28 to 6.29×10⁶km2 in the 1990’s, and a forest area decline be-tween the 1980’s and the 1990’s ranging from 0.41×10⁶km2 to 0.55×10⁶km2 over 25 years Using a sampling of high-resolution satellite observations, Hansen et al. (2008) found a decline in Africa’s humid forest biome of 5.4% of the global decline (with a standard error of ±26%) during 2000–2005, representing a loss of 0.014×10⁶km2over 6 years. One can appreciate the large difference in area loss rate between this satellite based estimate and the census-based numbers above, some being due to different definitions of forest. Such dis-crepancies in cleared forest area, as well as in forest biomass estimates (see Houghton, 2005), translate into large differ-ences in calculated LUC emissions.
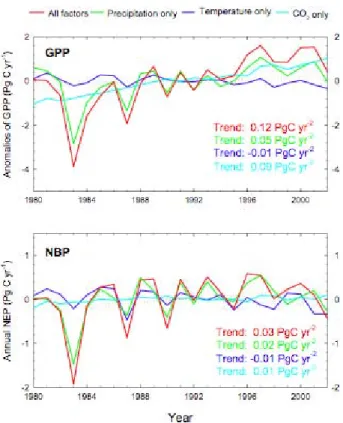
Second, there is an upward trend of GPP and NBP
be-tween 1980 and 2002, which is widespread over the conti-nent except for forested regions in Central Africa and around the Great Lakes. At the continental-scale, the trend of GPP
is closely matching the trend in satellite observed NDVI (see Fig. 7 and Fig. 8). At the regional scale, our simulated trend in GPP is also consistent with an increased vegetation ac-tivity over Sahel reported by Eklhundh and Olsson (2003) and Olsson et al. (2005). This upward trend of GPP over savannas is parallel with a rise in precipitation (Trenberth et al., 2008, their Fig. 3.13), itself maybe associated with a polewards expansion of the Tropical belt (Seidel et al., 2008). At the continental-scale, the trend of GPP can be ex-plained using our factorial simulations (Sect. 2) by the CO2
fertilization effect (70%) ameliorated by the increase in P (44%). Other factors like temperature and solar radiation contributed only marginally to the continental trend of GPP (Fig. 7). In response only to temperature change, the total GPP even shows a statistically significant decreasing trend (R2=0.25, P <0.05) likely due to an increase in the transpi-ration to precipitation ratio. Excluding land use change, car-bon sink for savanna is 0.05 Pg C yr−1while that of forest is about 0.3 Pg C yr−1 in 1990s. In contrast to the drivers of
39 1
Fig. 7. Interannual changes and trends of GPP and NBP driven by
different factors.
the GPP trend, the contribution of CO2 fertilization (25%)
to the trend of NBP is much less than that of precipitation (74%). NBP is the difference between gross fluxes, whose driving forces partly compensate each other. The small extra quantity of carbon fixed from the atmosphere by the fertil-ization effect is systematically returned to the atmosphere by fires and by microbial decomposition, so that the NBP trend is less sensitive to the effect of rising CO2than the GPP trend
(Fig. 8).
Third, slow decadal-scale variations of GPP are followed
by TER variations. This coupling between gross fluxes on
decadal time scales (see Botta et al., 2002) also implies that the spatial patterns of GPP trends are parallel with similar patterns of TER trends, as shown by Fig. 8. This coupling of GPP and TER slow variations can also be seen in Fig. 1, superimposed on the interannual variability signal. In OR-CHIDEE, the CO2 fertilization over forests between 10◦S
and 10◦N, and the effect of rising P elsewhere over the
sa-vannas, explain the GPP and TER trends during the past 20 years. On the other hand, the NBP trend during that inter-val (as well as the NBP slow decadal variations during the past century) is driven by more subtle, second-order control-ling variables, like the negative effect of regionally declining precipitation in Central Africa and the Great Lakes (Fig. 8).
Fourth, there is a increase in African river runoff since
1980 which is attributed to increasing rainfall, with a small
additional contribution of decreasing forest area rather than to increasing CO2 in our simulations. At the continental
scale, the modeled annual runoff due to the combined effects of climate, land use, and atmospheric CO2reveals a
signifi-cant positive trend of 1.24 mm yr−2(R2=0.19, P <0.05) from 1980 to 2002 (Fig. 9). Such a dramatic increase in runoff is mainly due to increasing precipitation (1.39 mm yr−2) and land use change (0.09 mm yr−2). In contrast, rising atmo-spheric CO2and temperature change caused a slight decrease
in runoff by −0.04 mm yr−2and 0.06 mm yr−2, respectively. Such a decrease in runoff in response to rising atmospheric CO2suggests that transpiration is not suppressed by higher
CO2levels, because the increased water use efficiency is
off-set by faster plant growth and more leaf area (Piao et al., 2007).
5 Concluding remarks
Another paper in this issue by Canadell et al. (2009) quan-tifies the African fossil fuel emission at 0.26 Pg C yr−1 for 2000–2005. The present study finds a net terrestrial C sink of 0.15 Pg C yr−1 for the 1990s, including LUC emissions of 0.13 PgC/y, and a terrestrial C sink excluding LUC of 0.28 Pg C yr−1. Thus Africa is unique among the world’s large continents in having a terrestrial sink of similar mag-nitude (but opposite sign) to total emissions. Our estimate of the terrestrial carbon balance, however, does not include the impact of logging. The amount of harvested wood from African forests is of 0.125 Pg C yr−1, with a high uncertainty (FAO, 2007). This flux will eventually return to the atmo-sphere in the future. Moreover, we found that that African ecosystems were a source of 0.14 Pg C yr−1 in the 1980s,
demonstrating that climate change can tip the African ter-restrial carbon balance balance from sink to source.
If Africa is a net sink of atmospheric CO2 in our
simu-lation, it is because photosynthesis has increased in excess of respiration and fire emissions during the last decades, in-creasing carbon sequestration. In savannas, we found that carbon accumulates in the soil (95%). These ecosystems ac-counts for 11% of the natural sink over the African conti-nent, excluding land use changes. Note however that this model result is not confirmed by field observations (E. Mou-gin, personal communication, 2008) over Sahelian savannas, where the observed soil C sink is very low. The Sudan savan-nas may have a very different carbon balance than the Sahel savannas, though.
In forest, carbon is mainly sequestered into biomass and accounts for another 89% of the natural sink at the conti-nental scale. The forest sink is thus 7 times larger than the savanna sink. Note however that Africa was a carbon source during the 1980’s, and that even during the 1990s, NBP is not always a carbon sink each year (Fig. 1). We expect the African forest carbon stocks to remain vulnerable in the com-ing decades. Africa has currently the smallest deforested area
41 1
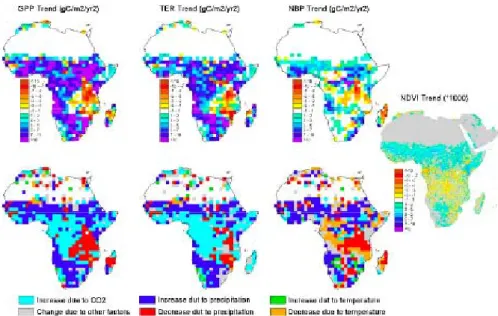
Fig. 8. Spatial distributions of modeled trends in annual GPP, TER and NBP s from 1980 to 2002 and of their main driving factor. In the
bottom panels, the main driving factor among changing rainfall, CO2and temperature for each grid point is calculated as the factor whose
trend explains most of the trend in the simulation where all the factors are combined. The right hand panel compares the patterns of modelled trends with those of satellite NDVI trends.
of tropical regions (Achard et al., 2004), but shows higher forest clearing rate than e.g. South America (Achard et al., 2002; Canadell et al., 2009). This is partly linked to the establishment of plantations (50% of deforested areas being converted to savanna and woodland, not agriculture). Fur-ther, there is a trend to intensified logging in Central Africa. The pristine African forests least affected by logging, are lo-cated in eastern Central Africa (Laporte et al., 2007), where we found that the recent regional drying trend has decreased GPP. This regional GPP decline is corroborated by satellite observation.
The next logical step will be to evaluate in details the model predictions. This can be done using forth-coming eddy covariance measurements (http://www.fluxnet. ornl.gov/fluxnet/networkname.cfm?networkid=36). Satellite measurements of soil moisture changes (Wagner et al., 2007) could also be used, with the benefits of existing long time series. But a better “observation operator” would be needed in ORCHIDEE to match with surface soil moisture observa-tions from space, the current simple 2-buckets model hydrol-ogy being rather ill-adapted to arid and semi-arid regions. Productivity and phenology changes can be further evaluated by using remote sensing visible and infrared reflectance in-dexes (as briefly attempted here), as well as by compiling ex-isting long time in situ series of NPP. The main structural de-velopment that is needed in ORCHIDEE is a better descrip-tion of the savanna biome funcdescrip-tioning, in particular a more realistic hydrology, fire module and phenology. One should account in this context for the co-existence and competition between trees and grasses (Botta et al., 2002) in modelling
43 1
Fig. 9. Trend in African runoff driven by different environmental
factors.
savannas carbon stocks and fluxes. Our simulations show that ecosystem respiration variations are systematically tail-ing out with those of photosynthesis, and that 2/3 of the res-piration anomalies are caused by autotrophic resres-piration. In that context, the possible acclimation of autotrophic respira-tion to high-temperature and drought (Maseyk et al., 2008) should be accounted in new model parameterizations.
The main model input dataset that are needed are a more reliable crop present and historical land-cover dataset for Africa, and more generally, information on the human land use pressure, including grazing and logging trends. Regard-ing climate forcRegard-ing data, a monthly time step for precipitation
as in the CRU dataset (that we further interpolated to hourly data with a weather generator), is clearly a big source of er-ror. In dry regions, herbaceous vegetation is composed of annual plants that can grow immediately after rain. The phe-nology of this vegetation type will only be captured in mod-els with a more realistic daily rainfall forcing data.
Acknowledgements. We are very grateful to F. Chevallier and to
E. Mougin for their very useful comments on the manuscript. This study was supported by the EC funded projects CARBOEUROPE IP (GOCE-CT-2003-505572). S. L. Piao was supported by the Foundation for the Author of National Excellent Doctoral Dissertation of PR China (FANEDD-200737).
Edited by: J. Leifeld
The publication of this article is financed by CNRS-INSU.
References
Abbadie, L., Gignoux, J., Le Roux, X., and Lepage, M.: Lamto: structure, functioning and dynamics of a savanna ecosystem, Springer-Verlag, New York, Ecological studies 179, 415 pp., 2006.
Ali, A. and Lebel, T.: The sahelian standardized rainfall index re-visited, Int. J. Climatol, 19, 1705–1714, 2009.
Achard, F., Eva, H. D., Stibig, H. J., Mayaux, P., Gallego, J., Richards, T., and Malingreau, J. P.: Determination of Deforesta-tion Rates of the World’s Humid Tropical Forests, Science, 297, 999–1002, 2002.
Achard, F., Eva, H. D., Mayaux, P., Stibig, H. J., and Belward, A.: Improved estimates of net carbon emissions from land cover change in the tropics for the 1990s, Global Biogeochem. Cy., 18, GB2008, doi:10.1029/2003GB002142, 2004.
Archibald, S., Roy, D. P., Van Wilgen B., and Scholes R. J.: What limits fire? An examination of drivers of burnt area in Southern Africa, Glob. Change Biol., 15(3), 613–630, 2009.
Balfour D. A. and Howison, O. E.: Saptial and temporal variation in a mesic savanna fire regime: responses to variation in annual rainfall, Afr. J. Range Forage Sci., 19, 43–52, 2001.
Barbosa, P. M., Stroppiana, D., Gregoire, J. M., and Pereira, J. M. C.: An assessment of vegetation fire in Africa (1981– 1991): Burned areas, burned biomass, and atmospheric emis-sions, Global Biogeo. Cycles, 13(4), 933–950, 1999.
Botta, A., Ramankutty, N., and Foley, J. A.: Long-term variations of climate and carbon fluxes over the Amazon Basin, Geophys. Res. Lett., 29, 331–334, doi:10.1029/2001GL013607, 2002. Brown, S. and Gaston, G.: Tropical Africa: Land Use, Biomass,
and Carbon Estimates for 1980. (NDP-055) Carbon Dioxide In-formation and Analysis Center, Oak Ridge National Laboratory, Oak Ridge, TN, 1996.
Canadell, J. G., Raupach, M. R., and Houghton, R. A.: Anthro-pogenic CO2emissions in Africa, Biogeosciences, 6, 463–468,
2009,
http://www.biogeosciences.net/6/463/2009/.
Ch´edin, A., Serrar, S., Hollingsworth, A., Armante, R., and Scott, N. A.: Detecting annual and seasonal variations of CO2, CO,
N2O from a multi-year collocated satellite-radiosonde dataset
us-ing the new rapid radiance reconstruction network (3R-N) model, J. Quant. Spectrosc. Ra. Transfer, 77, 285–299, 2003.
Ch´edin, A., Serrar, S., Scott, N. A., Pierangelo, C., and Ciais, P.: Impact of tropical biomass burning emissions on the di-urnal cycle of upper tropospheric CO2 retrieved from NOAA 10 satellite observations, J. Geophys. Res., 110D11, D11309, doi:10.1029/2004JD005540, 2005.
Ch´edin, A., Scott, N. A., Armante, R., Pierangelo, C., Crevoisier, C., Foss´e, O., and Ciais, Ph.: A quantitative link between CO2 emissions from tropical vegetation fires and the daily tropo-spheric excess (DTE) of CO2seen by NOAA-10 (1987–1991), J.
Geophys. Res., 113(D5), D05302, doi:10.1029/2007JD008576, 2008.
Chevallier, F., Viovy, N., Reichstein M., and Ciais P.: On the as-signment of prior errors in Bayesian inversions of CO2fluxes,
Geophys. Res. Lett., 33, L13802, doi:10.1029/2006GL026496, 2006.
Ciais, P., Reichstein, M., Viovy, N., Granier, A., Ogee, J., Allard, V., Aubinet, M., Buchmann, N., Bernhofer, C., Carrara, A., Cheval-lier, F., De Noblet, N., Friend, A. D., Friedlingstein, P., Grun-wald, T., Heinesch, B., Keronen, P., Knohl, A., Krinner, G., Loustau, D., Manca, G., Matteucci, G., Miglietta, F., Ourcival, J. M., Papale, D., Pilegaard, K., Rambal, S., Seufert, G. J., Sous-sana, F., Sanz, M. J., Schulze, E. D., Vesala, T., and Valentini, R.: Europe-wide reduction in primary productivity caused by the heat and drought in 2003, Nature, 437, 529–533, 2005.
Ciais, P., Piao, S. L., Viovy, N., Roedenbeck, C., Peylin, P., and Baker, D.:Top-down and bottom-up carbon budgets of North America, Europe and Asia, Eos Trans. AGU, 87(52), Fall Meet. Suppl., Abstract B42B-01, 2006.
Collatz, G. J., Ribas-Carbo, M., and Berry, J. A.: Coupled photosynthesis-stomatal conductance model for leaves of C4
plants, Aust. J. Plant Physiol., 19, 519–538, 1992.
Demarty, J., Chevallier, F., Friend, A. D., Viovy, N., Piao, S. L., and Ciais, P.: Assimilation of global MODIS leaf area index re-trievals within a terrestrial biosphere model, Geophys. Res. Lett., 34, L15402, doi:10.1029/2007GL030014, 2007.
De Rouw, A.: Improving yields and reducing risks in pearl millet farming in the African Sahel, Agric. Syst., 81, 73–93, 2004. Douville, H., Conil, S., Tyteca, S., and Voldoire, A.: Soil moisture
memory and West African monsoon predictability: artefact or reality? Clim. Dynam., 28, 723–742, 2007.
Ducoudr´e, N. I., Laval, K., and Perrier, A.: SECHIBA, a new set of parameterizations of the hydrologic exchanges at the land-atmosphere interface within the LMD atmospheric general cir-culation model, J. Climate, 6, 248–273, 1993.
ECD (State Environmental Conservation Department): Environ-mental Impact Assessment, Guidelines for Oil Palm Plantations development, Tech. Report 2, 2000.
Eklundh, L. and Olsson, L.: Vegetation index trends for the African Sahel 1982–1999, Geophys. Res. Lett., 30, 1430, doi:10.1029/2002GL016772, 2003.
ESRI: Arc/Info User’s Manual. Environmental Systems Research Institute, Redlands, California, USA, 1992.
Farquhar, G. D., Caemmerer, S., and Berry, J. A.: A biochemical model of photosynhetic CO2assimilation in leaves of C3species,
Planta, 149, 78–90, 1980.
Food and Agriculture Organization of the United Nations: Tropical Forest Resources, Forestry Paper No 30 (United Nations Food and Agriculture Organization, Rome), 1982.
Food and Agriculture Organization of the United Nations: Forest Resources Assessment: Tropical Countries, Forestry Paper No 112 (United Nations Food and Agriculture Organization, Rome), 1993.
Food and Agriculture Organization of the United Nations: Global Forest Resources Assessment 2000, Forestry Paper No 140 (United Nations Food and Agriculture Organization, Rome), 2001.
Food and Agriculture Organization of the United Nations (FAO): State of the World’s Forests 2007, 144 pp., 2007.
Giglio, L., van der Werf, G. R., Randerson, J. T., Collatz, G. J., and Kasibhatla, P.: Global estimation of burned area using MODIS active fire observations, Atmos. Chem. Phys., 6, 957–974, 2006, http://www.atmos-chem-phys.net/6/957/2006/.
Goldewijk, K. K.: Estimating global land use change over the past 300 years: The HYDE Database, Global Biogeochem. Cy., 15, 417–433, 2001.
Grace, J., San-Jos´e, J., Meir, P., Miranda, H. S., and Montes, R. A.: Productivity and carbon fluxes of tropical savannas, J. Biogeogr., 33, 387–400, 2006.
Grainger, A.: Difficulties in tracking the long-term global trend in tropical forest area, Proceedings of the National Academy of Sci-ences of the United States of America, 105(2), 818–823, 2008. Haberl, H., Erb, K. H., Krausmann, F., Gaube, V., Bondeau, A.,
Plutzar, C., Gingrich, S., Lucht, W., and Fischer-Kowalski, M.: Quantifying and mapping the human appropriation of net pri-mary production in earth’s terrestrial ecosystems, P. Natl. Acad. Sci. USA, 104, 12942–12945, 2007.
Hansen, M. C., Stehman, S. V., Potapov, P. V., Loveland, T. R., Townshend, J. R. G., DeFries, R. S., Pittman, K. W., Arunarwati, B., Stolle, F., Steininger, M. K., Carroll, M., and DiMiceli, C.: Humid tropical forest clearing from 2000 to 2005 quantified by using multitemporal and multiresolution remotely sensed data, P. Natl. Acad. Sci. USA, 105, 9439–9444, 2008.
Hiernaux, P. H. Y., Mougin, E., Diarra, L., Soumaguel, N., Lavenu, F., and Tracol, Y.: Sahelian rangeland response to changes in rainfall over two decades in the Gourma region, Mali, J. Hydrol., 375, 114–127, 2009.
Houghton, R. A.: Revised estimates of the annual net flux of carbon to the atmosphere from changes in land use and land manage-ment 1850–2000, Tellus B, 55, 378–390, 2003.
Houghton R. A.: Aboveground forest biomass and the global carbon balance, Glob. Change Biol., 11, 945–958, 2005.
Ingram, K. T., Roncoli, M. C., and Kirshen, P. H.: Opportunities and constraints for farmers of West Africa to use seasonal precipita-tion forecasts with Burkina Faso as a case study, Agric. Syst., 74, 331–349, 2002.
Jain, A. K. and Yang, X.: Modeling the Effects of Two Different Land Cover Change Data Sets on the Carbon Stocks of Plants and Soils in Concert With CO2and Climate Change, Global Bio-geochem. Cy., 19, GB2015, doi:10.1029/2004GB002349, 2005.
Joly, M., Voldoire, A., Douville, H., Terray, P., and Royer, J. F.: African monsoon teleconnection with tropical SSTs: validation and evolution in a set of IPCC4 simulations, Clim. Dynam., 29, 1–20, 2007.
Knapp, A. K. and Smith, M. D.: Variation among biomes in tempo-ral dynamics of aboveground primary production, Science 291: 481- 484, 2001.
Koch, G. W., Vitousek, P. M., Steffen, W. L., and Walker, B. H.: Terrestrial transects for global change research, Vegetatio, 121, 53–65, 1995.
Krinner, G., Viovy, N., de Noblet-Ducoudre, N., Ogee, J., Polcher, J., Friedlingstein, P., Ciais, P., Sitch, S., and Prentice. I. C.: A dynamic global vegetation model for studies of the cou-pled atmosphere-biosphere system, Global Biogeochem. Cy., 19, GB1015, doi:10.1029/2003GB002199, 2005.
Lambin, E. F., Geist, H. J., and Lepers, E.: Dynamics of land-use and land-cover change in Tropical Regions, Annu. Rev. Environ. Res., 28, 205–241, 2003.
Laporte, N. T., Stabach, J. A., Grosch, R., Lin, T. S., and Goetz, S. J.: Expansion of Industrial Logging in Central Africa, Science, 316, p. 1451, 2007.
Lepers, E., Lambin, E. F., Janetos, A. C., DeFries, R., Achard, F., Ramankutty, N., and Scholes R. J.: A synthesis of information on rapid land-cover change for the period 1981–2000, BioScience, 55, 115–124, 2005.
Lieth, H. and Wietaker R. H.: Primary Productivity of the Bio-sphere, Springer Verlag, Berlin, 1975.
Los, S. O., Weedon, G. P., North, P. R. J., Kaduk, J. D., Taylor, C. M., and Cox, P. M.: An observation-based estimate of the strength of rainfall-vegetation interactions in the Sahel, Geophys. Res. Lett., 33 L16402, doi:10.1029/2006GL027065, 2006. Loveland, T. R., Reed, B. C., Brown, J. F., Ohlen, D. O., Zhu, Z.,
Yang, L., and Merchant, J. W.: Development of a global land cover characteristics database and IGBP DISCover from 1 km AVHRR data, Int. J. Remote Sens., 21, 1303–1330, 2000. Maseyk, K., Grunzweig, J. M., Rotenberg, E., and Yakir, D.:
Res-piration acclimation contributes to high carbon use efficiency in a seasonally dry pine forest, Glob. Change Biol., 7, 1553–1557, 2008.
McNaughton, S., Oesterheld, M., Franck, D., and Williams, K.: Ecosystem level patterns of primary productivity and herbivory in terrestrial habitats, Nature, 341, 142–144, 1989.
Menaut, J. C., Barbault, R., Lavelle, P., and Lepage, M.: African sa-vannas: Biological systems of humification and mineralization, in: Ecology and management of the Worlds’ savannas, edited by: Tothill, J. C. and Mott, J. J., Australian Academy of Science, Canberra, 1985.
Mitchell, T. D. and Jones, P. D.: An improved method of construct-ing a database of monthly climate observations and associated high-resolution grids, Int. J. Climatol., 25, 693–712, 2005. Mitchell, T. D., Carter, T. R., Jones, P. D., Hulme, M., and New,
M.: A comprehensive set of high-resolution grids of monthly climate for Europe and the globe: the observed record (1901– 2000) and 16 scenarios (2001–2100), Tyndall Centre Working Paper 55, 2004.
Morton, D. C., DeFries, R. S., Shimabukuro, Y. E., Ander-son, L. O., Arai, E., Espirito-Santo, F. D., Freitas, R., and Morisette, J.: Cropland expansion changes deforestation dy-namics in the southern Brazilian Amazon, P. Natl. Acad. Sci.
USA,103, 14637–14641, 2006.
Olsson, L., Eklundh, L., and Ard¨o, J.: A recent greening of the Sahel, trends, patterns and potential causes, J. Arid Environ., 63, 556–566, 2005.
Parton, W., Stewart, J., and Cole, C.: Dynamics of C, N, P, and S in grassland soil: A model, Biogeochemistry, 5, 109–131, 1988. Piao, S. L., Ciais, P., Friedlingstein, P., Peylin, P., Reichstein, M.,
Luyssaert, S., Margolis, H., Fang, J. Y., Barr, A., Chen, A. P., Grelle, A., Hollinger, D. Y., Laurila, T., Lindroth, A., Richard-son, A. D., and Vesala, T.: Net carbon dioxide losses of northern ecosystems in response to autumn warming, Nature, 451, 49–52, 2008.
Piao, S. L., Friedlingstein, P., Ciais, P., de Noblet-Ducoudre, N., Labat, D., and Zaehle, S.: Changes in climate and land use have a larger direct impact than rising CO2on global river runoff trends,
P. Natl. Acad. Sci. USA, 104, 15242–15247, 2007.
Piao, S. L., Friedlingstein, P., Ciais, P., Zhou, L. M., and Chen, A. P.: Effect of climate and CO2changes on the greening of the
Northern Hemisphere over the past two decades, Geophys. Res. Lett., 33, L23402, doi:10.1029/2006GL028205, 2006.
Rayner, P. J., Scholze, M., and Knorr, W.: Two decades of terrestrial carbon fluxes from a carbon cycle data assimila-tion system(CCDAS), Global Biogeochem. Cy., 19, GB2026, doi:10.1029/2004GB002254, 2005.
Ramankutty, N. and Foley, J. A.: Estimating historical changes in global land cover: Croplands from 1700 to 1992, Global Bio-geochem. Cy., 13, 997–1027, 1999.
Saji, N. H., Goswami, B. N., Vinayachandran, P. N., and Yama-gata T.: A dipole mode in the tropical Indian Ocean, Nature, 401(6751), 360–363, 1999.
Scholes, R. J. and Hall, D.: The carbon budget of tropical savannas, woodlands and grasslands, in: Global Change: effects on conif-erous forest and grasslands SCOPE, edited by: Breymeyer, A. I., Hall, D., Mellilo, J. M., and Agrn, G. I., John Wiley, New York, 69–100, 1996.
Seidel, D. J., Fu, Q., Randell, W. J., and Reichler, T. J.: Widening of the tropical belt in a changing climate, Nature-Geosci., 1, 21–24, 2008.
Sitch, S., Huntingford, C., Gedney, N., Levy, P., Lomas, M., Piao, S. L., Betts, R., Ciais, P., Cox, P., Friedlingstein, P., Jones, C. D., Prentice, I. C., and Woodward, F. I.: Evaluation of the ter-restrial carbon cycle, future plant geography and climate-carbon cycle feedbacks using 5 Dynamic Global Vegetation Models (DGVMs), Global Change Biol., 14, 1–25, 2008.
Stone, R.: Can oilpalm plantations come clean?, Science, 317, p. 1491, 2007.
Sultan B., Baron, C., Dingkuhn, M., Saar, B., and Janicot, S.: Agri-cultural impacts of large-scale variability of the West African monsoon, Agr. Forest Meteorol., 128, 93–110, 2005.
Thonicke, K., Venevsky, S., Sitch, S., and Cramer, W.: The role of fire disturbance for global vegetation dynamics: Coupling fire into a Dynamic Global Vegetation Model, Global Ecol. Bio-geogr., 10, 661–677, 2001.
Trenberth, K. E., Jones, P. D., Ambenje, P., Bojariu, R., Easterling, D., Klein Tank, A., Parker, D., Rahimzadeh, F., Renwick, J. A., Rusticucci, M., Soden, B., and Zhai, P.: Observations: Surface and Atmospheric Climate Change, in: Climate Change 2007: The Physical Science Basis. Contribution of Working Group I to the Fourth Assessment Report of the Intergovernmental Panel on Climate Change, edited by: Solomon, S., Qin, D., Manning, M., Chen, Z., Marquis, M., Averyt, K. B., Tignor, M., and Miller, H. L., Cambridge University Press, Cambridge, United Kingdom and New York, NY, USA, 2008.
van der Werf, G. R., Randerson, J. T., Giglio, L., Collatz, G. J., Kasibhatla, P. S., and Arellano Jr., A. F.: Interannual variability in global biomass burning emissions from 1997 to 2004, Atmos. Chem. Phys., 6, 3423–3441, 2006,
http://www.atmos-chem-phys.net/6/3423/2006/.
Wagner, W., Naeimi, V., Scipal, K., de Jeu, R., and Mart´ınez-Fern´andez, J.: Soil moisture from operational meteorological satellites, J. Hydrogeo., 15, 121–131, doi:10.1007/s10040-006-0104-6, 2007.
Weber, U., Jung, M., Reichstein, M., Beer, C., Braakhekke, M. C., Lehsten, V., Ghent, D., Kaduk, J., Viovy, N., Ciais, P., Gobron, N., and R¨odenbeck, C.: The interannual variability of Africa’s ecosystem productivity: a multi-model analysis, Biogeosciences, 6, 285–295, 2009,
http://www.biogeosciences.net/6/285/2009/.
Williams, C. A., Hanan, N. P., Neff, J. C., Scholes, R. J., Berry, J. A., Denning, A. S., and Baker, D. F.: Africa and global carbon cycle, Carbon Balance and Manag., 2(3), 1–13, doi:10.1186/1750-0680-2-3, 2007.
Zeng, N., Neelin, J.D., Lau, K.M. and Tucker, C.J.: Enhancement of interdecadal climate variability in the Sahel by vegetation in-teraction, Science, 286, 1537-1540, 1999.
Zobler, L.: A world soil file for global climate modeling. NASA TM-87802. National Aeronautics and Space Administration, Washington DC, 1986.