Predicting abundances of invasive ragweed across Europe using a
“top-down” approach
Carsten Ambelas Skjøth
a,⁎
, Yan Sun
b, Gerhard Karrer
c, Branko Sikoparija
d, Matt Smith
a,
Urs Schaffner
e, Heinz Müller-Schärer
ba
School of Science and the Environment, University of Worcester, Henwick Grove, WR2 6AJ Worcester, United Kingdom
b
Department of Biology/Ecology & Evolution, University of Fribourg, 1700 Fribourg, Switzerland
c
Department of Integrative Biology and Biodiversity Research, University of Natural Resources and Life Sciences, Vienna, Austria
dBioSense Institute - Research Institute for Information Technologies in Biosystems, University of Novi Sad, Novi Sad, Serbia eCentre for Agriculture and Biosciences International, Rue des Grillons 1, CH-2800 Delémont, Switzerland
H I G H L I G H T S
• An approach for distribution modelling of anemophilous species using pollen data
• Validated against plant observations of ragweed and cross validation
• European-wide coverage revealing many new invaded regions.
• 1 km & 10 km inventories covering all of Europe.
G R A P H I C A L A B S T R A C T
a b s t r a c t
Common ragweed (Ambrosia artemisiifolia L.) is a widely distributed and harmful invasive plant that is an impor-tant source of highly allergenic pollen grains and a prominent crop weed. As a result, ragweed causes huge costs to both human health and agriculture in affected areas. Efficient mitigation requires accurate mapping of ragweed densities that, until now, has not been achieved accurately for the whole of Europe. Here we provide two invento-ries of common ragweed abundances with grid resolutions of 1 km and 10 km. These“top-down” inventories in-tegrate pollen data from 349 stations in Europe with habitat and landscape management information, derived from land cover data and expert knowledge. This allows us to cover areas where surface observations are missing. Model results were validated using“bottom–up” data of common ragweed in Austria and Serbia. Results show high agreement between the two analytical methods. The inventory shows that areas with the lowest ragweed abundances are found in Northern and Southern European countries and the highest abundances are in parts of Russia, parts of Ukraine and the Pannonian Plain. Smaller hotspots are found in Northern Italy, the Rhône Valley in France and in Turkey. The top-down approach is based on a new approach that allows for cross-continental studies and is applicable to other anemophilous species. Due to its simplicity, it can be used to investigate such spe-cies that are difficult and costly to identify at larger scales using traditional vegetation surveys or remote sensing. Thefinal inventory is open source and available as a georeferenced tif file, allowing for multiple usages, reducing costs for health services and agriculture through well-targeted management interventions.
Keywords: Pollen Ambrosia artemisiifolia Inventory Biogeography Open-access ⁎ Corresponding author.
E-mail address:[email protected](C.A. Skjøth).
http://doc.rero.ch
Published in "Science of The Total Environment 686(): 212–222, 2019"
which should be cited to refer to this work.
1. Introduction
Common ragweed (Ambrosia artemisiifolia L.) is an invasive species
that occupies many different ecosystems (Essl et al., 2015;Smith et al.,
2013). The plant is a major weed in cropfields, but has achieved
notori-ety for its worldwide impact on human health. Ambrosia is
anemophi-lous and its pollen is an important aeroallergen and significant cause
of seasonal asthma and rhinitis where the plant is recorded (Smith
et al., 2013;White and Bernstein, 2003). Common ragweed is particu-larly abundant in the Northern Hemisphere and its presence results in
high atmospheric concentrations of pollen in North America (Zhang
et al., 2015), where it is native, and regions outside of its native range
such as China (Li et al., 2012;Sun et al., 2017c) and Europe (Essl et al.,
2015;Sikoparija et al., 2017), where the plant has invaded vast geo-graphical areas covering thousands of kilometres. In Europe,
sensitisa-tion rates to Ambrosia pollen allergens range fromb2.5% in Finland to
N50% in known centres of ragweed infestation such as Budapest,
Hungary (Burbach et al., 2009;Heinzerling et al., 2009;Sikoparija
et al., 2017;Smith et al., 2013).
A mature common ragweed plant can produce more than a billion
pollen grains (Fumanal et al., 2007) that, due to their small size,
fre-quently undergo continental scale atmospheric transport (Šikoparija
et al., 2013;Smith et al., 2013). Common ragweed has been observed
to increase its pollen production under higher CO2concentrations
(Rogers et al., 2006) and within urban environments (Ziska et al.,
2003). Under climate change, the plant is projected to expand its
range in Europe to the north and east (Sun et al., 2017a, b). Airborne
concentrations of Ambrosia pollen are expected to increase due to the plant's accelerated invasion into new ecosystems, its increased pollen
production, and enhanced atmospheric transport (Hamaoui-Laguel
et al., 2015). Similarly, recentfindings suggest possible expansion of its range in North America at the northern margins of its current
distri-bution and contraction to the south (Case and Stinson, 2018), as well as
towards north and east in East Asia (Sun et al., 2017c). Suitable habitats
and distribution of common ragweed have been modelled for present
and future conditions in Europe (Essl et al., 2015;Sun et al., 2017b),
but inventories documenting abundances across whole continents in-cluding Europe are largely absent.
Knowledge of abundances of common ragweed at the continental
scale is important for pollen forecasting (Prank et al., 2013;Zink et al.,
2012, 2017) and for mitigation strategies that aim at a sustainable re-duction in plant density and pollen exposure. Unfortunately, the avail-ability of the required plant occurrence records of invasive species like
common ragweed is often limited (Müller-Schärer et al., 2018).
Conse-quently, the spatial and temporal resolution of abundance data for com-mon ragweed in Europe is very heterogeneous, which hampers mapping of the distribution and abundance of the plant. There have been several attempts to model the distribution of common ragweed
using either occurrence data (Bullock et al., 2010) or ecosystem models
(Chapman et al., 2014;Rasmussen et al., 2017;Storkey et al., 2014), but all these studies have limitations describing actual abundances (Matyasovszky et al., 2018;Thibaudon et al., 2014). A main constraint is that the invasion of common ragweed is still ongoing in many
coun-tries (Karrer et al., 2015;Onen et al., 2014) and management of the
landscape often increases invasion (Richter et al., 2013). However,
most continental scale ecosystem models do not contain information
on nation-specific management of the landscape, as this is difficult to
obtain for all Europe when it comes to agriculture (Werner et al.,
2015). Remote sensing based methods used to detect common ragweed
over large areas are also challenging, especially since pollen-producing plants can be surprisingly small and usually occur in mixed herbaceous
vegetation (Essl et al., 2015). Other approaches for creating inventories
are therefore needed.
The ragweed beetle Ophraella communa LeSage has recently invaded
Northern Italy and has been shown to clear largefields of common
rag-weed (Müller-Schärer et al., 2014, 2018) thereby affecting the overall
pollen emission in the area (Bonini et al., 2017) and significantly
reduc-ing airborne Ambrosia pollen concentrations (Bonini et al., 2015, 2016).
If this beetle becomes abundant locally or actively spreads into new areas with large infestations of common ragweed, then this may have
a large positive impact on human health (Mouttet et al., 2018). It is
therefore important to have complete and up-to-date source maps for common ragweed showing levels of O. communa infestation so they can be used for mitigation and pollen forecasting purposes. In addition, the well-documented populations of ragweed in France, Italy and on the Pannonian Plain need to extend to the less well known, but very impor-tant, source regions in Ukraine and Russia. This is because atmospheric transport from these areas regularly contributes to airborne Ambrosia pollen concentrations recorded in Europe and western Asia; e.g.
Poland (Bilińska et al., 2017; Kasprzyk et al., 2011), Denmark
(Sommer et al., 2015) and Turkey (Celenk and Malyer, 2017;Zemmer et al., 2012). Furthermore, such data should clearly identify the invasion fronts of common ragweed as the level of infestation in a given area
af-fects the mitigation strategies that are likely to be successful (Milakovic
et al., 2014;Lommen et al., 2018). Finally, the quality of the inventories should be validated, ideally using independent data.
The main aim of this study is to produce a validated inventory of rag-weed abundance for Europe. This was achieved by developing a new ap-proach that allowed the plant's abundances to be mapped over the entire European Continent and then validating this inventory using both cross validations and independent plant-based occurrence data of common ragweed in Serbia and Austria. The proposed approach is designed to be globally applicable for anemophilous species that are
otherwise difficult to map, not just ragweed. Finally, the inventory we
present here for ragweed abundances is available as open access in an easy to use format.
2. Materials and methods
2.1. Generalised method for generation of the European ragweed inventory using pollen data
Making inventories offlowering plants can be carried out using two
approaches: 1) Bottom-up approaches that typically are produced using statistical analysis of plant abundance or 2) top-down approaches
where a measured quantity of pollen as a starting point (Skjøth et al.,
2013). For an anemophilous species like common ragweed, spatial
data of airborne pollen concentrations can help to construct abundance
maps (Müller-Schärer et al., 2018). It has been shown that using pollen
data to generate“top-down” inventories for France produced better
pollen forecasts than“bottom–up” inventories based on available
occur-rence data of common ragweed plants (Zink et al., 2017). Top-down
in-ventories based on pollen data have been made available for the
Pannonian Plain (Skjøth et al., 2010), Austria (Karrer et al., 2015) and
Italy (Bonini et al., 2017). These inventories provided data with different
geographical resolutions and as a result had compatibility problems
near the boundaries where maps overlapped (Karrer et al., 2015).
Fur-thermore, gaps in available data have prevented the mapping of
impor-tant ragweed areas such as western Ukraine (Skjøth et al., 2010).
Therefore, no European-wide inventory has previously been produced. Fig. 1illustrates the most important steps and the datasets needed for producing continental wide inventories. Step 1 is to create a
harmonised and geographically consistent dataset (Fig. 1, left column)
that includes both the habitats that are populated by the plant (in the
case of ragweed this varies geographically, as seen inTable 1). This is
then combined with information known to restrict the presence of the
plant. The approach for ragweed is described in detail inSection 2.1.1.
The second step is to include the presence and absence of pollen data
of the plant in question (Fig. 1, middle column). Favourable habitats
may or may not be populated by a plant and so the presence/absence
of airborne pollen recorded at specific geographical locations is
impor-tant for determining the plant's coverage. Conceptually, the pollen
data is a point based dataset which can be used to calculate local
abun-dance. The approach for ragweed is described in detail inSection 2.1.2.
The last dataset is the station footprint area (Fig. 1, right column). This
is used to calculate abundance within a region (e.g.Skjøth et al., 2010;
Thibaudon et al., 2014), which is termed the infestation level of the plant (e.g. invasive ragweed). The footprint area can be based on simple
circles (Skjøth et al., 2010), the concentric ring method (Oteros et al.,
2015) or footprint modelling - backwards modelling using tools such
as the atmospheric particle dispersion model HYSPLIT (Stein et al.,
2015) or SILAM (e.g.Hernandez-Ceballos et al., 2014). The abundance
or infestation level found at the combined set of stations is then interpo-lated to the entire model domain. This implicitly assumes that the infes-tation level of the plant in nearby habitats is similar and that a suitable
approach to estimate the abundance in regions without observations is to combine the presence of habitats with the abundance of pollen from the nearest observational points.
2.1.1. Inventories of infested habitats
We generated inventories showing the distribution of ragweed abundances in Europe using a combination of airborne pollen data and
land cover types identified as having the potential for ragweed invasion
– a so called infested habitat approach (Karrer et al., 2015;Skjøth et al.,
2010). Experts were consulted about which land cover types (habitats)
have the potential to be infested by common ragweed in different areas. This allowed the abundance of habitats that could be infested in a
Fig. 1. Conceptualfigure illustrating data flow and needed data sets for producing continental-wide inventories using the top-down approach.
Table 1
CORINE land cover types with major ragweed infestation in the six regions in Europe described in this study. Suitable habitats are marked with YES and less suitable are marked with No. CLC
code
CORINE land cover classifications (label 3) currently considered to be major ragweed habitats within Europe (n = 19)
Major ragweed habitats Austria (East & West combined) (n = 17) Major ragweed habitats France (n = 13) Major ragweed habitats Italy (n = 11) Major ragweed habitats Pannonian Plain (n = 7) Major ragweed habitats Czech Republic (n = 6) Major ragweed habitats rest of Europe (n = 4)
1.1.2 Discontinuous urban fabric Yes Yes Yes No Yes Yes
1.2.1 Industrial commercial units Yes Yes Yes Yes Yes Yes
1.2.2 Road and rail networks and associated land Yes Yes Yes Yes Yes Yes
1.2.3 Port areas Yes No No No Yes Yes
1.2.4 Airports Yes Yes No Yes No No
1.3.1 Mineral extraction sites Yes No No No No No
1.3.2 Dump sites Yes No No No No No
1.3.3 Construction sites Yes Yes Yes Yes Yes No
1.4.1 Green urban areas Yes Yes Yes No No No
2.1.1 Non-irrigated arable land Yes Yes Yes Yes Yes No
2.1.2 Permanently irrigated land Yes Yes Yes No No No
2.2.1 Vineyards Yes Yes No No No No
2.2.2 Fruit trees and berry plantations Yes Yes No No No No
2.3.1 Pastures Yes No No No No No
2.4.1 Annual crops associated with permanent crops No Yes Yes No No No
2.4.2 Complex cultivation patterns Yes Yes Yes Yes No No
2.4.3 Land principally occupied by agriculture, with significant areas of natural vegetation
Yes Yes Yes Yes No No
2.4.4 Agro-forestry areas No No Yes No No No
3.2.1 Natural grassland Yes No No No No No
specific region to be calculated. The degree of infestation was then de-termined by the use of pollen data.
The combined region under investigation included Europe and parts
of western Asia (Fig. 2A), which is termed‘Europe’ for the purposes of
this study. Two land cover datasets were used with high spatial resolu-tion: (1) The Corine Land Cover (CLC) 2012 version, which encompasses
the European Union and selected associated countries (Commission,
2005), and includes countries such as Norway, Switzerland, Serbia and
Turkey with a grid resolution of 100 m; (2) Globcover (Bicheron et al.,
2008), a global land cover dataset that has a coarser resolution
(300 m), fewer land cover classes and less detail with respect to man-agement than the CLC dataset, but that allowed us to analyse important ragweed areas like Ukraine and Russia.
The infestation of suitable habitats by common ragweed is favoured by soil disturbance and can either be enhanced or suppressed by na-tional agricultural schemes and local management of the agricultural
landscape and transport networks (Skjøth et al., 2010). The invasion
of common ragweed is ongoing and the plant has yet to colonise all
favourable habitats in the studied region, e.g. Austria (Karrer et al.,
2015) and Turkey (Onen et al., 2014). The CLC dataset was therefore
separated into regions (at NUTS1 and NUTS2 levels) and each region
was given its own set of land cover classes followingKarrer et al.
(2015). These regions that, according to current scientific knowledge,
might be infested by common ragweed (Table 1) include: the
Pannonian Plain (Skjøth et al., 2010), which we have extended to
cover the Balkan region and parts of Turkey (Onen et al., 2014);
Austria/Switzerland (Karrer et al., 2015); parts of Italy (Bonini et al.,
2017; Celesti-Grapow et al., 2009; Gentili et al., 2017); France (Thibaudon et al., 2014); Czech Republic (Skálová et al., 2017); North-ern and SouthNorth-ern Europe. Note that we assume that the main infesta-tion of common ragweed in Northern and Southern Europe is in the
urban zone (McInnes et al., 2017;Sommer et al., 2015), an assumption
supported by the fact that most observations of common ragweed in
these areas have been associated with built environments (Sommer
et al., 2015).
The Globcover dataset was used outside the CLC region and
sepa-rated into two regions in the studied area: South and North (Fig. 2A).
According to the Interactive Agricultural Ecological Atlas of Russia and neighbouring countries, common ragweed is found abundantly in
southern Russia, Georgia and parts of Ukraine (Afonin et al., 2008). To
the East, this information is limited as Kazakhstan was not covered by the Russian Atlas. The northern region covers Belarus, the northern parts of Ukraine and central and northern Russia. In this northern Globcover region, the urban zone (ID = 190) was considered the only habitat for common ragweed. In the southern region, the main agricul-tural land cover classes (ID = 11,14,20,30) and the urban zone were considered to be the only habitats for common ragweed following Afonin et al. (2008). The completed Globcover dataset was reprojected and re-gridded to 100 m × 100 m and combined with the CLC dataset.
As with previous studies (Bonini et al., 2017;Karrer et al., 2015;
Thibaudon et al., 2014), an elevationfilter was used because common ragweed is known to mainly occupy lowlands and permanent popula-tions are only found below the climatological limit favouring the plant's
growth (Essl et al., 2009;Karrer et al., 2015). Studies have shown that
this climatological limit, where ~99% of stable populations are found
below, ranges from 439 m a.s.l. in France (Thibaudon et al., 2014) to
745 m a.s.l. in the Alpine region of Austria (Karrer et al., 2015). Casual
populations of common ragweed have been identified up to 1100 m a.
s.l. in Europe (Essl et al., 2009), but practically no Ambrosia pollen is
ob-served above 1000 m (Matyasovszky et al., 2018). Although it should be
noted thatGentili et al. (2017)observed the plant growing up to
1834 m a.s.l. in Italy. In this study, the altitudinal limit of 745 m was
)
b
(
)
a
Fig. 2. A: Geographical regions with different invasion levels of common ragweed in described land cover classes within the Corine Land Cover (CLC) classification separated into the following six zones as described in Table A1: (1) The Pannonian Plain extended to cover part of the Balkans and parts of Turkey, (2) France, (3) Austria extended to cover Switzerland, (4) Czech Republic, (5) Parts of Italy and (6) areas with limited invasion and mainly in the urban zone (Sommer et al., 2015;McInnes et al., 2017). The coarser Globcover classification is separated into two regions with ragweed invasion found in the rural landscape covering mainly Ukraine and southern Russia and northern parts where ragweed is only expected to be found in the urban landscape. B: Pollen-monitoring sites included in this study with a defined pollen integral and additional sites with no records of ragweed pollen.
chosen as a generalfilter for Europe, except for France where the more
restrictive 439 mfilter was used due to the lower infestation in elevated
terrain (Thibaudon et al., 2014).
The elevationfilter is based on two datasets in order to cover all of
Europe with sufficient accuracy. The first is the global void filled dataset
from the NASA Shuttle Radar Topographic Mission (Reuter et al., 2007)
that was made available at 90 m resolution up to 60 degrees North (Jarvis et al., 2008). The second, which we used beyond 60 degrees North, is the 225 m dataset from USGS named the Global
Multi-resolution Terrain Elevation Data 2010 (Danielson and Gesch, 2011).
Both datasets were reprojected and re-gridded to 100 m grid resolution
defined by the CLC dataset. The elevation filter was applied on the
com-bined land cover data set with ragweed habitats and thisfinal dataset
was re-gridded to 1 km for further manipulation including the applica-tion of pollen data.
2.1.2. Pollen data and calculation of infestation level
Pollen data (2004–2012) obtained from published work were
in-cluded in the study (Fig. 2B). An additional ±2 years was allowed to
en-sure that sufficient data points in the vicinity of the main invasion fronts
of common ragweed were included, covering regions like Spain, the UK, parts of France, North Western Europe and Northern Russia. The pub-lished work contained pollen data collected using optical methods for
identification and enumeration and displayed with well-defined pollen
integrals according toGalán et al. (2017). Ambrosia pollen data obtained
using this approach may include pollen from several species of ragweed that are present on the European continent, while common ragweed is
the most widespread of all species (Smith et al., 2013).
The pollen data encompass all the main centres in Europe infested
by common ragweed, i.e. Italy (Bonini et al., 2017), Austria (Karrer
et al., 2015), the Pannonian Plain (Skjøth et al., 2010), France (Thibaudon et al., 2014) and parts of Ukraine. Additional published data from 18 countries were included from a European-wide trend
study concerning Ambrosia pollen (Sikoparija et al., 2017). Further
data were included from studies conducted in Germany (Buters et al.,
2015;Höflich et al., 2016;Melgar et al., 2012), Croatia (Bokan et al., 2007;Liu et al., 2016;Menut et al., 2014;Peternel et al., 2006;Puljak et al., 2016), Turkey (Acar et al., 2017;Altintaş et al., 2004;Bicakci and Tosunoglu, 2015;Tosunoglu and Bicakci, 2015), Romania (Leru et al.,
2018), Russia (Severova et al., 2015;Shamgunova and Zaklyakova,
2011), Serbia (Josipović and Ljubičić, 2012), Ukraine (Maleeva and
Prikhodko, 2017;Rodinkova, 2013;Turos et al., 2009), Bosnia (Turos et al., 2009) and Slovakia (Hrabovský et al., 2016). All these sites are lo-cated within urban zones and data are collected from the top of a
build-ing, typically 10 m–20 m above ground level.
Additional calibration points outside the main centres for common ragweed were obtained by conducting a literature review of published studies (e.g. pollen calendars) during the selected time period taking into account both rural and urban locations. This was used to document the minimal presence or absence of airborne Ambrosia pollen as an indi-cation of the current invasion front. Studies were included when they either reported full pollen calendars without ragweed, thereby
documenting low or no occurrence of Ambrosia pollen or specific
num-bers with respect to low amounts of ragweed pollen. This literature re-view, as well as the main data collection of pollen integrals, took into account both English and non-English literature found within the study region such as Norwegian, Serbian and Russian. This provided data of limited or no presence of airborne Ambrosia pollen from the
fol-lowing regions: Porto, Portugal (Ribeiro and Abreu, 2014), Funchal,
Portugal (Camacho, 2015), Toledo, Spain (Garcia-Mozo et al., 2006;
Perez-Badia et al., 2010) Badajoz, Spain (Gonzalo-Garijo et al., 2006),
Salamanca, Spain (Rodríguez-de la Cruz et al., 2010), Nerja, Spain
(Docampo et al., 2007), Moscow, Russia (Volkova et al., 2016), Mornag,
Tunisia (Hadj Hamda et al., 2017), Nicosia, Cyprus (Gucel et al., 2013),
Bodrum, Turkey (Tosunoglu and Bicakci, 2015), Konya, Turkey
(Kizilpinar et al., 2012), Kastamonu, Turkey (Çeter et al., 2012), Denizli,
Turkey (Güvensen et al., 2013), Van, Turkey (Bicakci et al., 2017), Hatay,
Turkey (Tosunoglu et al., 2018), Perm, Russia (Novoselova and Minaeva,
2015), 12 sites from Norway (e.g.Bicakci et al., 2017;Tosunoglu et al.,
2018) Finland (Manninen et al., 2014) and 5 sites from central/northern
Russia that documented no Ambrosia pollen deposition from the air (Nosova et al., 2015).
Note that the data from the Norwegian, Spanish, Turkish and Cyprus networks needed special treatment. Common ragweed is sparse in
these regions and in most cases Ambrosia pollen– if present – is grouped
together with pollen from other members of the Asteraceae family. If the annual pollen integral from the Asteraceae group was near zero then data from these sites were included as being without presence of Ambrosia pollen. Pollen stations with a low Asteraceae pollen integral
during the ragweedflowering period were also included, while stations
with a large Asteraceae pollen integral were excluded from the study. The number of ragweed habitats for each grid cell within a 30 km ra-dius of the pollen monitoring site was calculated using the function focal statistics provided with Spatial Analyst Tools, which is an extension to ArcGIS. These values (henceforth amount of habitats) were then ex-tracted for the pollen monitoring sites. This is done simultaneously for all sites using the function Extract values to point also found within Spa-tial Analyst Tools. This approach by combining tools within SpaSpa-tial
Ana-lyst Tools has shown to be much more computationally efficient for
continental scale calculations as compared to previous approaches
that have mainly been applied at the country level (Bonini et al., 2017;
Karrer et al., 2015). This previous approach handled the sites
individu-ally and operated with the data in shape-file format (Skjøth et al.,
2010;Thibaudon et al., 2014). The ragweed infestation level is then
cal-culated at each site according toThibaudon et al. (2014)and
interpo-lated to the entire area of investigation, where the infestation level
varies from 0% to 100%. Thefinal gridded ragweed inventory was
calcu-lated at 1 km grid resolution by multiplying the gridded habitat map with the calculated infestation level. The 1 km grid was aggregated to
10 km (Fig. 3A) for comparison with plant density data. The sensitivity
of the gridded data was tested by cross validation and displayed as a
scatter plot (Fig. 3B) and geographically on a map (Fig. 3C) according
to the recommendations by US-EPA (US-EPA, 2004). The 10 km
inven-tory is discussed at the European level, while the higher detailed 1 km inventory is explored for selected areas and compared with the 10 km
inventory (Fig. 4A to D). Both European inventories given with the
10 km and the 1 km grid are provided as supplementary information
in form of tiffiles, which enables easy application of the data by
author-ities, forecasters and other users.
2.2. Inventories of plant density for Austria and Serbia and their comparison with the pollen-based inventory
Two plant density maps were produced for Austria (Karrer et al.,
2015) and Serbia (Vrbničanin et al., 2008) based on unified
nation-wide observation campaigns on the presence, absence and abundance classes of common ragweed for the same period as the pollen data (pre-vious section). These data included areas with both widespread infesta-tions of permanent populainfesta-tions of common ragweed and areas where
the plant was absent. The data fromVrbničanin et al. (2008)were
deliv-ered as a 3-level categorical dataset of infestation of common ragweed with 10 km × 10 km resolution covering all of Serbia. The data from Austria were raw observational values of the presence/absence of
com-mon ragweed (Karrer et al., 2015). The datasets were converted into
point-based shapefiles by calculating presence/absence on a 10 km
× 10 km grid covering both countries. The density of presence (grid points) within a 30 km zone is then calculated for both Austria and Serbia at a 10 km resolution, i.e. the same distance and resolution used for the pollen based inventory. This enabled the data to be gridded in the same way as the pollen based inventory. The plant density maps
were combined for both countries (Fig. 5A) and individual numbers in
the grid cells were directly compared using linear correlation analysis (Fig. 5B).
3. Results
3.1. The pollen based ragweed inventory and its accuracy assessment A total of 349 pollen monitoring sites were included in the study (Fig. 2B). A high density of stations was found in Italy, France and Hungary while a low density of stations was found in Romania, Molda-via parts of Russia and Turkey. The geographical locations and the over-all pollen integral used in the calculation were stored within a
point-based shapefile that also includes metadata with a citation for each
dataset. This shapefile is available as supplementary information. The
Rhône Valley, Northern Italy, the Pannonian Plain, parts of Turkey, most of Ukraine, and parts of Russia were found to be the main areas with high pollen integrals. The highest ragweed infestation was found in Ukraine followed by Russia and the Pannonian Plain, which corresponded well with the highest pollen integrals that were found
in Russia, Ukraine and Croatia. These areas (Fig. 3A) also contained the
main invasion fronts towards the North (e.g. Poland, parts of Russia and Ukraine), while the southern invasion fronts were found in Turkey near the Black Sea coast, parts of Italy and parts of France.
Cross validation provided an overall R2value of 0.49 (Fig. 3B) and a
correlation of 0.74 and RMSE of 10.2%. The mapping of the absolute
error (Fig. 3C) revealed that nearly all sites had an absolute error of
b20%, while a few had much larger errors. These uncertainties were mainly related to areas with low densities of stations such as part of Ukraine, or near invasion fronts like the transition from the western Bal-kans to the Adriatic coastline. The 10 km gridded dataset highlights well
known areas of infestation such as the Rhône Valley in France (Fig. 4A)
and parts of Ukraine and Turkey (Fig. 4C) along the Black Sea coast.
More detail can be seen with the 1 km grid resolution, which displays
narrow areas with a high infestation in Italy and France (Fig. 4B) and
is associated with narrow valleys found near Roussillon, France, and part of the Alpine region in either southern Switzerland and northern Italy. The 1 km inventory is also highly detailed around the Black Sea (Fig. 4D). The most highly infested areas in Russia and Ukraine are
ar-ranged in an arc around the northern coast of the Black Sea (Fig. 4D),
corresponding to the location of Odessa. This is a combined effect of ho-mogeneous terrain with a very high density of agricultural land, i.e. a large number of potential ragweed habitats and a lower density of pol-len stations compared to areas such as the Rhône Valley in France. This is also the area with the highest uncertainty according to the cross cor-relation analysis.
3.2. The plant based inventory of common ragweed and its comparison with the pollen inventory
The re-calculated plant-based inventory for Serbia (Fig. 5A)
iden-tifies the northern part as being heavily infested, while the southern
part contains notably less common ragweed. Similarly, the Austrian plant-based inventory shows high infestations around Vienna (Fig. 5A) and in the lowlands of the southern and eastern parts. Local-ised infestations, apparently in relation to major road networks
expanding from the East to the West, are consistent with previous
find-ings byEssl et al. (2009)andVitalos and Karrer (2009). A substantial
fraction of the country has low infestations coinciding with the Alpine region. The numerical comparison of the bottom-up plant-based inven-tory with the top-down pollen-based inveninven-tory provided a highly
sig-nificant relationship (r2= 0.64 Pb 0.001) (Fig. 5B).
4. Discussion
This study provides, to our knowledge, thefirst complete inventory
offlowering ragweed all over Europe and western Asia showing both
distribution and relative abundance. The inventory has been validated using both cross validation and two plant-based inventories for Austria and Serbia. The inventory substantially expands current methods used for developing top-down based inventories and provides an approach that is generally applicable both for ragweed as well as other anemophilous species. The new approach is demonstrably suit-able across continents and due to its design it can at the same time in-corporate several types of geographical data with varying detail along with other types of information. The new approach is, therefore, both flexible and made for either local or global implementation. The results show large variations in infestation levels throughout the European
landscape– variations that, as far as we know, have not previously
been identified. These variations are in part related to the regional
dis-tribution of ecosystems likely to be affected and partly associated with
factors, such as steep terrain or specific agricultural management
schemes, that suppress the level of ragweed invasion.
The inventory is a major synthesis from COST Action
FA1203-SMARTER for the“Sustainable management of Ambrosia artemisiifolia
in Europe” (Müller-Schärer et al., 2018); a large EU-funded network
that operated from 2012 to 2016 withN250 active scientists from over
30 countries (Müller-Schärer et al., 2018). The data collected within
SMARTER is, to the best of our knowledge, the largest amount of Ambro-sia pollen data ever collected. The dataset includes information from En-glish and non-EnEn-glish sources, thereby documenting ragweed infestations from regions not previously considered. The map of
Fig. 3. A: Infestation [%] of Ambrosia in Europe combining airborne Ambrosia pollen data with land cover and elevationfilter, aggregated to 10 km × 10 km. B: Cross validation at each point using the geographical distribution. C: Scatter plot showing cross validation results incorporating all sites in the study.
ragweed abundance is also based on expert opinion, observations of plant abundances on the ground, and a mathematical approach for connecting and analysing the data. As such, this synthesis is arguably the most comprehensive and rigorous analysis of ragweed distribution and abundance ever considered for Europe.
The approach for generating these maps is applicable for other ane-mophilous plant species that release pollen to the air, to other periods of sampling, and other regions with different land cover types. The ap-proach is not restricted to the use of pollen data analysed with optical microscopes, but can easily be applied to pollen data analysed with mo-lecular techniques, thereby expanding the usefulness. Momo-lecular ap-proaches as well as apap-proaches using optical microscopes, can provide volumetric measures of pollen that are in fact directly comparable (Müller-Germann et al., 2015). For instance, pollen and fungal pores
col-lected with traps of the Hirst design (Hirst, 1952), which are used by
many national networks, have been analysed using molecular
approaches to produce time series of volumetric measures (
Grinn-Gofroń et al., 2016;Núñez et al., 2017). In fact, nationwide monitoring for airborne grass pollen using molecular approaches has recently
been demonstrated (Brennan et al., 2019). As such it is possible to
calcu-late the pollen or spore integrals (Galán et al., 2017) using molecular
techniques if the study involves standard or calibration curves (e.g. Müller-Germann et al., 2015). Furthermore, the dataset can cover full seasons, which is the main requirement when using molecular data for this mapping approach. The traditional analysis of aerobiological samples by an optical microscope is often limited in its ability to identify airborne pollen because pollen or fungal spores are aggregated into groups such as genus (e.g. Betula), family (e.g. Asteraceae) or even ‘type’ (e.g. Taxus-Cupressaceae type). On the other hand, molecular ap-proaches can identify pollen or spores that are morphological identical to other species when analysed with a microscope such as the pollen
from different members of the Poaceae family (Brennan et al., 2019;
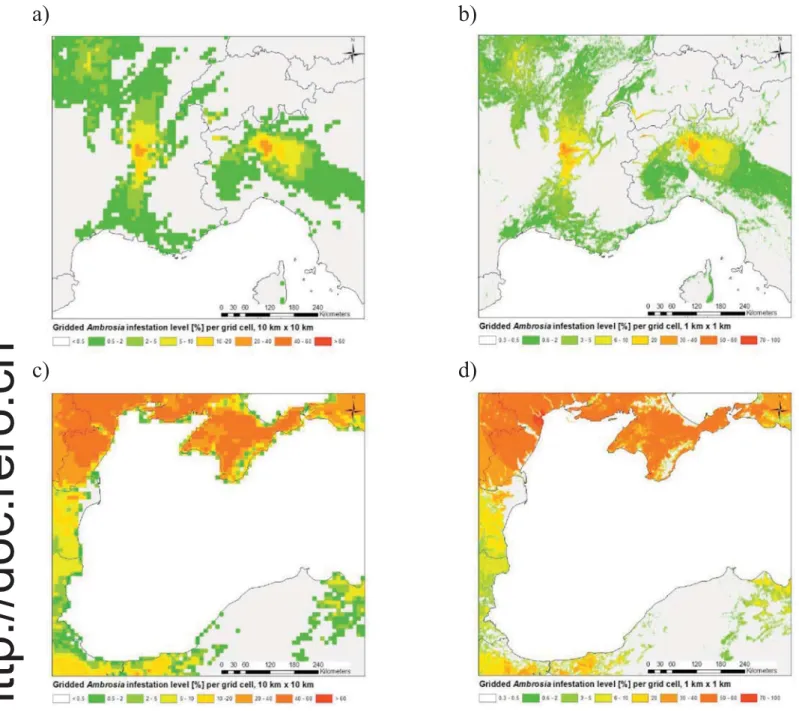
a) b)
c) d)
Fig. 4. A: Infestation level of Ambrosia pollen covering the Rhone valley and the Milan region at 10 km × 10 km. B: Infestation level of Ambrosia pollen covering the Rhone valley and the Milan region at 1 km × 1 km. C: Infestation level of Ambrosia pollen covering part of the Black Sea region and the coastal areas of Turkey, Bulgaria, Ukraine and Russia at 10 km × 10 km. D: 1 km × 1 km. Note the slightly different legends between 1 km and 10 km grid resolution.
Kraaijeveld et al., 2015), spores from the genus Cladosporium (Pashley et al., 2012) or pollen from Ambrosia artemisiifolia (Müller-Germann et al., 2017). The use of primers that either separate individual ragweed species or target individual species such as Ambrosia artemisiifolia (Müller-Germann et al., 2017) will provide substantial new insight into species diversity in the air and allow for studies into ecosystem be-haviour or provide background data for management. These diagnostic methods would be particularly powerful when analysed spatially using the approach presented here. Pollen data are relatively simple to collect and so this approach is especially useful when the species under
inves-tigation are difficult and costly to map at larger spatial scales using other
methods such as vegetation surveys or remote sensing (e.g. the global invader Parthenium hysterophorus or the highly allergenic species of
Parietaria judaica). The background data and thefinal output data
from this study are available in a well-established digitized form at
sev-eral geographical resolutions (e.g.Fig. 4B and D). The inventory can,
therefore, be easily updated and the data are available for planning mit-igation strategies, scenario studies, and forecasting; including use by the
atmospheric models used in the EUflagship Copernicus Programme.
This enables substantial impact within and outside academia– a
pri-mary objective of the SMARTER network (Müller-Schärer et al., 2018).
The inventory presented here, thanks to the development of new methods, provides a substantial new understanding of the level of
rag-weed invasion across Europe that has not previously been identified.
The inclusion of new regions, e.g. Turkey, provides a larger geographical coverage of ragweed infestation than previous studies conducted by Bullock et al. (2010),Prank et al. (2013)andLiu et al. (2016). Our inven-tory also shows much lower infestation levels in much of Northern Europe than these other studies, e.g. for northern Germany, Denmark, Belarus, the Baltic countries, Poland and Sweden. This is because the
in-ventory reflects the fact that common ragweed is mainly found near
set-tlements and that many regions in these countries are still free from
common ragweed (Afonin et al., 2008;Grewling et al., 2016;McInnes
et al., 2017;Sommer et al., 2015). The results suggest substantial spatial variations in infestation levels in key areas such as the Pannonian Plain and in countries like Italy. Our inventory shows almost no infestation in large parts of Italy and, as such, is in agreement with national
assess-ments conducted byCelesti-Grapow et al. (2009)andGentili et al.
(2017). Attempts of ecosystem modelling conducted by Chapman et al. (2014)andStorkey et al. (2014)have some similarities with this
study (e.g. in Russia and Ukraine), but also contain major differences in Northern countries (e.g. the UK, Germany and Denmark) as well as countries near to or on the Pannonian Plain (e.g. Romania, Bulgaria and the European part of Turkey). In our inventory, ragweed is hardly
present in the Northern countries (McInnes et al., 2017), has either
widespread but regional presence or patchy distribution in countries
such as France and Germany (Buters et al., 2015;Zink et al., 2012),
and is found abundantly in the European part of Turkey (Ozaslan
et al., 2016) and along parts of the Black Sea coast (Onen et al., 2014). The approach implicitly assumes that each region with considerable
and consistent amounts of ragweed pollen is predominantly influenced
by local plants and that atmospheric processes keeping pollen airborne have similar effects throughout the model area. This is not necessarily the case, where a good example that can affect pollen dispersion is the
height of the planetary boundary layer (Smith et al., 2008;de Weger
et al., 2016). It has been shown that one of the important ragweed re-gions during the main ragweed season systematically contain higher planetary boundary layers compared to other European regions (Seidel et al., 2012). Nevertheless, the harmonised inventory presented in this study appears to agree considerably better with existing litera-ture than large scale maps created in previous studies. This, combined with the cross validation and comparison with plant-based inventories, suggests that the approach presented in this study provides high quality inventories from a statistical point of view and is currently the most comprehensive method for estimating ragweed abundance throughout Europe.
5. Conclusion
In summary, the map of ragweed abundance presented here is, to
our knowledge, thefirst complete assessment of ragweed invasion in
Europe. Common ragweed is one of the most economically important
invasive species in Europe and so is considered aflagship species.
Miti-gation is therefore highly needed. Our inventory can support successful mitigation strategies, both at national and international levels, such as the use of biological control or the implementation of new management schemes. As such, the inventory would need to be updated when major changes are seen in the distribution, thereby underlining the impor-tance of long time series from pollen monitoring stations. Furthermore, the method produces superior results to other mapping approaches
)
b
)
a
y = 30.447x - 2.465
R² = 0.6356
0.0 10.0 20.0 30.0 40.0 50.0 60.0 0 0.2 0.4 0.6 0.8 1 1.2Pol
le
n ba
se
d
ra
g
w
e
e
d
i
n
v
e
nt
or
y
[
%
]
Density of ragweed*10
2(presence/absence) grid cells
Serbia and Austria comparison
Individual grid cell points
Fig. 5. A: Density of ragweed plants in Austria and Serbia based on unified nation-wide observation campaigns on the presence, absence and abundance classes of common ragweed for the same period as the pollen data, calculated using 10 km × 10 km grid cells. B: Scatter plot showing a comparison of the ragweed plant density map with corresponding grid cells from the pollen-based inventory.
when used for pollen forecasting, where the objective is to enable hay fever sufferers to either reduce pollen exposure during high magnitude events or take medication. Finally, the mapping of ragweed in this way can be used to document the effect of climate change on vegetation as the northward expansion of common ragweed in Europe is currently limited by cooler climates. A main challenge with the approach has
been in securing sufficient amounts of data on a continental scale and
finding a method for handling regions with poorer data coverage. Over-all, the approach shows the high value of pollen data, particularly when the data are applied to large spatial scales and combined with detailed land use maps and expert knowledge of plant distribution and ecology. Consequently, the production of inventories can help convince policy makers setting political and administrative actions against invasive spe-cies such as common ragweed.
Acknowledgements
We acknowledge data from the Global Multi-resolution Terrain Elevation Data 2010, made available from the U.S. Geological Survey, distributed by the Land Processes Distributed Active Archive Center
(LP DAAC), located at USGS/EROS, Sioux Falls, SD.http://lpdaac.usgs.
gov. We also acknowledge the 90 m elevation data provided by CGIAR:
http://srtm.csi.cgiar.org/. We acknowledgefinancial support from EU
COST Action FA1203 “Sustainable management of Ambrosia
artemisiifolia in Europe (SMARTER)”: http://www.cost.eu/COST_
Actions/fa/FA1203, by the European Commission through a Marie Curie Career Integration Grant (Project ID CIG631745 and Acronym SUPREME to CAS), by the Swiss State Secretariat for Education, Research and
Inno-vation (C13.0146; to HMS), the Swiss Federal Office for the
Environ-ment (13.0098.KP/M323-0760; to HMS), by Novartis Foundation (grant number 17B083 to HMS and YS), to BS by the Ministry of Educa-tion, Science and Technological Development of Republic of Serbia (pro-ject numbers OI173002 and III44006), IPA Cross-border Cooperation
Programme Croatia – Serbia 2014-2020 (RealForAll project no.
2017HR-RS151), Provincial Secretariat for Finances, Autonomous Prov-ince Vojvodina (contract no. 102-401-337/2017-02-4-35-8). We ac-knowledge also the support by the Austrian Ministry of Agriculture, Forestry, Environment and Water, and by eight federal state govern-ments of Austria (Project no 100198, RAGWEED; to GK).
Appendix A. Supplementary data
Supplementary data to this article can be found online athttps://doi.
org/10.1016/j.scitotenv.2019.05.215.
References
Acar, A., Alan, S., Kaplan, A., Baysal, E.O., Dogan, C., Pinar, N.M., 2017.General trends in at-mospheric pollen concentration in the high populated city of Ankara, Turkey. Karaelmas Sci. Eng. J. 7, 40–46.
Afonin, A., Greene, S.L., Dzyubenko, N.I., Frolow, A.N., 2008. Interactive agricultural ecolog-ical atlas of Russia and neighboring countries. [WWW Document]. URL.http://www. agroatlas.ru/en/autors/81/81/index.html.
Altintaş, D.U., Karakoç, G.B., Yilmaz, M., Pinar, M., Kendirli, S.G., Cakan, H., 2004. Relation-ship between pollen counts and weather variables in east-Mediterranean coast of Turkey. Does it affect allergic symptoms in pollen allergic children? Clin. Dev. Immunol. 11, 87–96.https://doi.org/10.1080/10446670410001670544.
Bicakci, A., Tosunoglu, A., 2015. Allergenic Ambrosia (ragweed) pollen concentrations in Turkey. Asthma Allergy Immunol. 13, 33–46.https://doi.org/10.5578/aai.8529. Bicakci, A., Tosunoglu, A., Altunoglu, M.K., Saatcioglu, G., Keser, A.M., Ozgokce, F., 2017. An
aeropalynological survey in the city of Van, a high altitudinal region, East Anatolia-Turkey. Aerobiologia 33, 93–108.https://doi.org/10.1007/s10453-016-9453-3. Bicheron, P., Defourny, P., Brockmann, C., Schouten, L., Vancutsem, C., Huc, M., Bontemps,
S., Leroy, M., Achard, F., Herold, M., Ranera, F., Arino, O., 2008. Globcover products de-scription manual. MEDIAS-France. (Available:). https://www.theia-land.fr/sites/de-fault/files/globcover_products_description_validation_report_i2.1.pdf.
Bilińska, D., Skjøth, C.A., Werner, M., Kryza, M., Malkiewicz, M., Krynicka, J., Drzeniecka-Osiadacz, A., 2017. Source regions of ragweed pollen arriving in south-western Poland and the influence of meteorological data on the HYSPLIT model results. Aerobiologia 33, 315–326.https://doi.org/10.1007/s10453-017-9471-9.
Bokan, I., Furlan, N., Matkovic, N., 2007.Airborne pollen in the city of Rijeka, 2005. Croat. Public Heal. J. 3, 1–3.
Bonini, M.,Šikoparija, B., Prentović, M., Cislaghi, G., Colombo, P., Testoni, C., Grewling, L., Lommen, S.T.E., Müller-Schärer, H., Smith, M., 2015. Is the recent decrease in airborne Ambrosia pollen in the Milan area due to the accidental introduction of the ragweed leaf beetle Ophraella communa? Aerobiologia 31, 499–513.https://doi.org/10.1007/ s10453-015-9380-8.
Bonini, M.,Šikoparija, B., Prentović, M., Cislaghi, G., Colombo, P., Testoni, C., Grewling, Ł., Lommen, S.T.E., Müller-Schärer, H., Smith, M., 2016. A follow-up study examining air-borne Ambrosia pollen in the Milan area in 2014 in relation to the accidental intro-duction of the ragweed leaf beetle Ophraella communa. Aerobiologia. 32, 371–374. https://doi.org/10.1007/s10453-015-9406-2.
Bonini, M.,Šikoparija, B., Skjøth, C.A., Cislaghi, G., Colombo, P., Testoni, C., Smith, M., POLLnet, Smith, M., 2017. Ambrosia pollen source inventory for Italy: a multi-purpose tool to assess the impact of the ragweed leaf beetle (Ophraella communa Le-Sage) on populations of its host plant. Int. J. Biometeorol., 1–12https://doi.org/ 10.1007/s00484-017-1469-z.
Brennan, G.L., Potter, C., Vere, N. de, Griffith, G.W., Skjoth, C.A., Osborne, N.J., Wheeler, B.W., McInnes, R.N., Clewlow, Y., Barber, A., Hanlon, H.M., Hegarty, M., Jones, L., Kurganskiy, A., Rowney, F.M., Armitage, C., Adams-Groom, B., Ford, C.R., Petch, G.M., Elliot, A., Frisk, C.A., Neilson, R., Potter, S., Rafiq, A.M., Roy, D.B., Selby, K., Steinberg, N., Creer, S., 2019. Temperate airborne grass pollen defined by spatio-temporal shifts in community composition. Nat. Ecol. Evol. 3 (5), 750–754.https://doi.org/10.1038/ s41559-019-0849-7.
Bullock, J.M., Chapman, D., Schafer, S., Roy, D., Girardello, M., Haynes, T., Beal, S., Wheeler, B., Dickie, I., Phang, Z., Tinch, R.,Čivić, K., Delbaere, B., Jones-Walters, L., Hilbert, A., Schrauwen, A., Prank, M., Sofiev, M., Niemelä, S., Räisänen, P., Lees, B., Skinner, M., Finch, S., Brough, C., 2010. Assessing and controlling the spread and the effects of common ragweed in Europe. Available:.http://ec.europa.eu/environment/nature/ invasivealien/docs/Final_Final_Report.pdf.
Burbach, G.J., Heinzerling, L.M., Rohnelt, C., Bergmann, K.C., Behrendt, H., Zuberbier, T., 2009. Ragweed sensitization in Europe - GA(2)LEN study suggests increasing preva-lence. Allergy 64, 664–665.https://doi.org/10.1111/j.1398-9995.2009.01975.x. Buters, J., Alberternst, B., Nawrath, S., Wimmer, M., Traidl-Hoffmann, C., Starfinger, U.,
Behrendt, H., Schmidt-Weber, C., Bergmann, K.-C., 2015. Ambrosia artemisiifolia (rag-weed) in Germany– current presence, allergological relevance and containment pro-cedures. Allergo J. Int. 24, 108–120.https://doi.org/10.1007/s40629-015-0060-6. Camacho, I.C., 2015. Airborne pollen in Funchal city, (Madeira Island, Portugal)– first
pollinic calendar and allergic risk assessment. Ann. Agric. Environ. Med. 22, 608–613.https://doi.org/10.5604/12321966.1185762.
Case, M.J., Stinson, K.A., 2018. Climate change impacts on the distribution of the allergenic plant, common ragweed (Ambrosia artemisiifolia) in the eastern United States. PLoS One 13, e0205677.https://doi.org/10.1371/journal.pone.0205677.
Celenk, S., Malyer, H., 2017. The occurrence of Ambrosia pollen in the atmosphere of Northwest Turkey: investigation of possible source regions. Int. J. Biometeorol. 61, 1499–1510.https://doi.org/10.1007/s00484-017-1328-y.
Celesti-Grapow, L., Pretto, F., Brundu, G., Carli, E., Blaso, C., 2009.Plant Invasion in Italy. Çeter, T., Pinar, N.M., Güney, K., Yildiz, A., Aşcı, B., Smith, M., 2012. A 2-year
aeropalynological survey of allergenic pollen in the atmosphere of Kastamonu, Turkey. Aerobiologia 28, 355–366.https://doi.org/10.1007/s10453-011-9240-0. Chapman, D.S., Haynes, T., Beal, S., Essl, F., Bullock, J.M., 2014. Phenology predicts the
na-tive and invasive range limits of common ragweed. Glob. Chang. Biol. 20, 192–202. https://doi.org/10.1111/gcb.12380.
Commission, E, 2005.Image2000 and CLC2000 Products and Methods. European Com-mission, Joint Research Center (DG JRC), Institute for Environment and Sustainability, Land Management Unit, I-21020 Ispra (VA), Italy.
Danielson, J.J., Gesch, D.B., 2011. Global multi-resolution terrain elevation data 2010 (GMTED2010). Available:.https://pubs.usgs.gov/of/2011/1073/pdf/of2011-1073.pdf. Docampo, S., Recio, M., Trigo, M.M., Melgar, M., Cabezudo, B., 2007. Risk of pollen allergy in Nerja (southern Spain): a pollen calendar. Aerobiologia 23, 189–199.https://doi. org/10.1007/s10453-007-9063-1.
Essl, F., Dullinger, S., Kleinbauer, I., 2009.Changes in the spatio-temporal patterns and habitat preferences of Ambrosia artemisiifolia during its invasion of Austria. Preslia 81, 119–133.
Essl, F., Biró, K., Brandes, D., Broennimann, O., Bullock, J.M., Chapman, D.S., Chauvel, B., Dullinger, S., Fumanal, B., Guisan, A., Karrer, G., Kazinczi, G., Kueffer, C., Laitung, B., Lavoie, C., Leitner, M., Mang, T., Moser, D., Müller-Schärer, H., Petitpierre, B., Richter, R., Schaffner, U., Smith, M., Starfinger, U., Vautard, R., Vogl, G., von der Lippe, M., Follak, S., 2015. Biological Flora of the British Isles: Ambrosia artemisiifolia. J. Ecol. 103, 1069–1098.https://doi.org/10.1111/1365-2745.12424.
Fumanal, B., Chauvel, B., Bretagnolle, F., 2007.Estimation of pollen and seed production of common ragweed in France. Ann. Agric. Environ. Med. 14, 233–236.
Galán, C., Ariatti, A., Bonini, M., Clot, B., Crouzy, B., Dahl, A., Fernandez-González, D., Frenguelli, G., Gehrig, R., Isard, S., Levetin, E., Li, D.W., Mandrioli, P., Rogers, C.A., Thibaudon, M., Sauliene, I., Skjoth, C., Smith, M., Sofiev, M., 2017. Recommended ter-minology for aerobiological studies. Aerobiologia 33, 293–295.https://doi.org/ 10.1007/s10453-017-9496-0.
Garcia-Mozo, H., Perez-Badia, R., Fernandez-Gonzalez, D., Galan, C., 2006. Airborne pollen sampling in Toledo, Central Spain. Aerobiologia 22, 55–66.https://doi.org/10.1007/ s10453-005-9015-6.
Gentili, R., Gilardelli, F., Bona, E., Prosser, F., Selvaggi, A., Alessandrini, A., Martini, F., Nimis, P.L., Wilhalm, T., Adorni, M., Ardenghi, N.M.G., Barni, E., Bonafede, F., Bonini, M., Bouvet, D., Buffa, G., Ciappetta, S., Giordana, F., Faggi, G., Ghiani, A., Ghillani, L., Marcucci, R., Masin, R., Morelli, V., Montagnani, C., Montanari, S., Peccenini, S., Pellizzari, M., Romani, E., Saiani, D., Scortegagna, S., Sirotti, M., Truzzi, A., Vignodelli, M., Bagli, L., Fiandri, F., Siniscalco, C., Citterio, S., 2017. Distribution map ofAmbrosia
artemisiifolia L. (Asteraceae) in Italy. Plant Biosyst. - An Int. J. Deal. with all Asp. Plant Biol. 151, 381–386.https://doi.org/10.1080/11263504.2016.1176966.
Gonzalo-Garijo, M.A., Tormo-Molina, R., Munoz-Rodriguez, A.F., Silva-Palacios, I., 2006. Differences in the spatial distribution of airborne pollen concentrations at different urban locations within a city. J Investig Allergol Clin Immunol 16, 37–43. Grewling,Ł., Bogawski, P., Jenerowicz, D., Czarnecka-Operacz, M., Šikoparija, B., Skjøth,
C.A., Smith, M., 2016. Mesoscale atmospheric transport of ragweed pollen allergens from infected to uninfected areas. Int. J. Biometeorol. 60, 1493–1500.https://doi. org/10.1007/s00484-016-1139-6.
Grinn-Gofroń, A., Sadyś, M., Kaczmarek, J., Bednarz, A., Pawłowska, S., Jedryczka, M., 2016. Back-trajectory modelling and DNA-based species-specific detection methods allow tracking of fungal spore transport in air masses. Sci. Total Environ. 571, 658–669. https://doi.org/10.1016/J.SCITOTENV.2016.07.034.
Gucel, S., Guvensen, A., Ozturk, M., Celik, A., 2013. Analysis of airborne pollen fall in Nic-osia (Cyprus). Environ. Monit. Assess. 185, 157–169. https://doi.org/10.1007/s10661-012-2540-1.
Güvensen, A., Çelik, A., Topuz, B., Öztürk, M., 2013. Analysis of airborne pollen grains in Denizli. Turk. J. Botany 37, 74–84.https://doi.org/10.3906/bot-1201-4.
Hadj Hamda, S., Ben Dhiab, A., Galán, C., Msallem, M., 2017. Pollen spectrum in northern Tunis, Tunisia. Aerobiologia 33, 243–251. https://doi.org/10.1007/s10453-016-9464-0.
Hamaoui-Laguel, L., Vautard, R., Liu, L., Solmon, F., Viovy, N., Khvorostyanov, D., Essl, F., Chuine, I., Colette, A., Semenov, M.A., Schaffhauser, A., Storkey, J., Thibaudon, M., Epstein, M.M., 2015. Effects of climate change and seed dispersal on airborne rag-weed pollen loads in Europe. Nat. Clim. Chang. 5, 766–771.https://doi.org/10.1038/ nclimate2652.
Heinzerling, L.M., Burbach, G.J., Edenharter, G., Bachert, C., Bindslev-Jensen, C., Bonini, S., Bousquet, J., Bousquet-Rouanet, L., Bousquet, P.J., Bresciani, M., Bruno, A., Burney, P., Canonica, G.W., Darsow, U., Demoly, P., Durham, S., Fokkens, W.J., Giavi, S., Gjomarkaj, M., Gramiccioni, C., Haahtela, T., Kowalski, M.L., Magyar, P., Muraközi, G., Orosz, M., Papadopoulos, N.G., Röhnelt, C., Stingl, G., Todo-Bom, A., von Mutius, E., Wiesner, A., Wöhrl, S., Zuberbier, T., 2009. GA2
LEN skin test study I: GA2
LEN harmo-nization of skin prick testing: novel sensitization patterns for inhalant allergens in Europe. Allergy 64, 1498–1506.https://doi.org/10.1111/j.1398-9995.2009.02093.x. Hernandez-Ceballos, M.A., Soares, J., García-Mozo, H., Sofiev, M., Bolivar, J.P., Galán, C.,
2014. Analysis of atmospheric dispersion of olive pollen in southern Spain using SILAM and HYSPLIT models. Aerobiologia 30 (3), 239–255.https://doi.org/10.1007/ s10453-013-9324-0.
Hirst, J.M., 1952.An automatic volumetric spore trap. Ann. Appl. Biol. 39, 257–265. Höflich, C., Balakirski, G., Hajdu, Z., Baron, J.M., Kaiser, L., Czaja, K., Merk, H.F., Gerdsen, S.,
Strassen, U., Bas, M., Bier, H., Dott, W., Mücke, H.-G., Straff, W., Chaker, A., Röseler, S., 2016. Potential health risk of allergenic pollen with climate change associated spreading capacity: ragweed and olive sensitization in two German federal states. Int. J. Hyg. Environ. Health 219, 252–260. https://doi.org/10.1016/J. IJHEH.2016.01.007.
Hrabovský, M.,Ščevková, J., Mičieta, K., Lafférsová, J., Dušička, J., 2016. Expansion and aerobiology of Ambrosia artemisiifolia L. in Slovakia. Ann. Agric. Environ. Med. 23, 64–70.https://doi.org/10.5604/12321966.1196854.
Jarvis, A., Reuter, H.I., Nelson, A., Guevara, E., 2008. Hole-Filled SRTM for the Globe Version 4, Available from the CGIAR-CSI SRTM 90m Database. [WWW Document]. URL. http://www.cgiar-csi.org/data/srtm-90m-digital-elevation-database-v4-1. Josipović, M.M., Ljubičić, A., 2012. Monitoring and Forecasting of Pollen Within the
Terri-tory of Zlatibor, 2012 (In Serbian:ПРАЋЕЊЕ СТАЊА И ПРОГНОЗА ПОЛЕНА НА ТЕРИТОРИЈИ ОПШТИНЕ ЧАЈЕТИНА (ЗЛАТИБОР) ЗА 2012. ГОДИНУ). . Available. http://www.cajetina.org.rs/sites/default/files/pollen.pdf.
Karrer, G., Skjøth, C.A.,Šikoparija, B., Smith, M., Berger, U., Essl, F., 2015. Ragweed (Ambro-sia) pollen source inventory for Austria. Sci. Total Environ. 523, 120–128.https://doi. org/10.1016/j.scitotenv.2015.03.108.
Kasprzyk, I., Myszkowska, D., Grewling, L., Stach, A., Sikoparija, B., Skjøth, C.A., Smith, M., 2011. The occurrence of Ambrosia pollen in Rzeszow, Krakow and Poznan, Poland: investigation of trends and possible transport of Ambrosia pollen from Ukraine. Int. J. Biometeorol. 55, 633–644.https://doi.org/10.1007/s00484-010-0376-3. Kizilpinar,İ., Doğan, C., Artaç, H., Reisli, İ., Pekcan, S., 2012. Pollen grains in the atmosphere
of Konya (Turkey) and their relationship with meteorological factors, in 2008. Turk. J. Bot. 36, 344–357.https://doi.org/10.3906/bot-1011-26.
Kraaijeveld, K., de Weger, L.A., Ventayol García, M., Buermans, H., Frank, J., Hiemstra, P.S., den Dunnen, J.T., 2015. Efficient and sensitive identification and quantification of air-borne pollen using next-generation DNA sequencing. Mol. Ecol. Resour. 15, 8–16. https://doi.org/10.1111/1755-0998.12288.
Leru, P.M., Eftimie, A.-M., Thibaudon, M., 2018. First allergenic pollen monitoring in Bucharest and results of three years collaboration with European aerobiology special-ists. Rom. J. Intern. Med. 56, 27–33.https://doi.org/10.1515/rjim-2017-0033. Li, X.-M., Liao, W.-J., Wolfe, L.M., Zhang, D.-Y., 2012. No evolutionary shift in the mating
system of North American Ambrosia artemisiifolia (Asteraceae) following its intro-duction to China. PLoS One 7, e31935.https://doi.org/10.1371/journal.pone.0031935. Liu, L., Solmon, F., Vautard, R., Hamaoui-Laguel, L., Zsolt Torma, C., Giorgi, F., 2016. Rag-weed pollen production and dispersion modelling within a regional climate system, calibration and application over Europe. Biogeosciences 13, 2769–2786.https://doi. org/10.5194/bg-13-2769-2016.
Lommen, S.T.E., Jongejans, E., Leitsch-Vitalos, M., Tokarska-Guzik, B., Zalai, M., Müller-Schärer, H., Karrer, G., 2018. Time to cut: population models reveal how to mow in-vasive common ragweed cost-effectively. NeoBiota 39, 53–78.https://doi.org/ 10.3897/neobiota.39.23398.
Maleeva, A., Prikhodko, A., 2017. Analysis of features and assymetri of ambrosia pollen daily distribution in air of Zaporozhye. Sci. Sci., 4, 4–8https://doi.org/10.15587/ 2519-8025.2017.108987.
Manninen, H.E., Bäck, J., Sihto-Nissilä, S.-L., Huffman, J., Pessi, A., A.-M., Hiltunen, V., Aalto, P.P., Hidalgo, P.J., Hari, P., Saarto, A., Kulmala, M., Petäjä, T., 2014.Patterns in airborne pollen and other primary biological aerosol particles (PBAP), and their con-tribution to aerosol mass and number in a boreal forest. Boreal Environ. Res. 19, 383–405.
Matyasovszky, I., Makra, L., Tusnády, G., Csépe, Z., Nyúl, L.G., Chapman, D.S., Sümeghy, Z., Szűcs, G., Páldy, A., Magyar, D., Mányoki, G., Erostyák, J., Bodnár, K., Bergmann, K.-C., Deák, Á.J., Thibaudon, M., Albertini, R., Bonini, M.,Šikoparija, B., Radišić, P., Gehrig, R., Rybníček, O., Severova, E., Rodinkova, V., Prikhodko, A., Maleeva, A., Stjepanović, B., Ianovici, N., Berger, U., Seliger, A.K., Weryszko-Chmielewska, E.,Šaulienė, I., Shalaboda, V., Yankova, R., Peternel, R.,Ščevková, J., Bullock, J.M., 2018. Biogeograph-ical drivers of ragweed pollen concentrations in Europe. Theor. Appl. Climatol. 133, 277–295.https://doi.org/10.1007/s00704-017-2184-8.
McInnes, R.N., Hemming, D., Burgess, P., Lyndsay, D., Osborne, N.J., Skjøth, C.A., Thomas, S., Vardoulakis, S., 2017. Mapping allergenic pollen vegetation in UK to study environ-mental exposure and human health. Sci. Total Environ. 599–600, 483–499.https:// doi.org/10.1016/j.scitotenv.2017.04.136.
Melgar, M., Trigo, M.M., Recio, M., Docampo, S., García-Sánchez, J., Cabezudo, B., 2012. At-mospheric pollen dynamics in Münster, north-western Germany: a three-year study (2004–2006). Aerobiologia 28, 423–434. https://doi.org/10.1007/s10453-012-9246-2.
Menut, L., Vautard, R., Colette, A., Khvorostyanov, D., Potier, A., Hamaoui-Laguel, L., Viovy, N., Thibaudon, M., 2014. A new model of ragweed pollen release based on the analy-sis of meteorological conditions. Atmos. Chem. Phys. Discuss. 14, 10891–10927. https://doi.org/10.5194/acpd-14-10891-2014.
Milakovic, I., Fiedler, K., Karrer, G., 2014. Management of Roadside Populations of Invasive Ambrosia artemisiifolia by Mowing. Weed Res. 54, 256–264.https://doi.org/10.1111/ wre.12074.
Mouttet, R., Augustinus, B., Bonini, M., Chauvel, B., Desneux, N., Gachet, E., Le Bourgeois, T., Müller-Schärer, H., Thibaudon, M., Schaffner, U., 2018. Estimating economic benefits of biological control of Ambrosia artemisiifolia by Ophraella communa in southeast-ern France. Basic Appl. Ecol. 33, 14–24.https://doi.org/10.1016/J.BAAE.2018.08.002. Müller-Germann, I., Vogel, B., Vogel, H., Pauling, A., Fröhlich-Nowoisky, J., Pöschl, U.,
Després, V.R., 2015. Quantitative DNA Analyses for Airborne Birch Pollen. https:// doi.org/10.1371/journal.pone.0140949.
Müller-Germann, I., Pickersgill, D.A., Paulsen, H., Alberternst, B., Pöschl, U., Fröhlich-Nowoisky, J., Després, V.R., 2017. Allergenic Asteraceae in air particulate matter: quantitative DNA analysis of mugwort and ragweed. Aerobiologia 33, 493–506. https://doi.org/10.1007/s10453-017-9485-3.
Müller-Schärer, H., Lommen, S.T.E., Rossinelli, M., Bonini, M., Boriani, M., Bosio, G., Schaffner, U., 2014. Ophraella communa, the ragweed leaf beetle, has successfully landed in Europe: fortunate coincidence or threat? Weed Res. 54, 109–119.https:// doi.org/10.1111/wre.12072.
Müller-Schärer, H., Sun, Y., Chauvel, B., Karrer, G., Kazinczi, G., Kudsk, P., Oude, A.G.J.M.L., Schaffner, U., Skjoth, C.A., Smith, M., Vurro, M., de Weger, L.A., Lommen, S.T.E., 2018. Cross-fertilizing weed science and plant invasion science to improve efficient man-agement: a European challenge. Basic Appl. Ecol. https://doi.org/10.1016/J. BAAE.2018.08.003.
Nosova, M.B., Severova, E.E., Volkova, O., 2015.Long-term studies of modern pollen spec-tra in temperate zone of European Russia (in Russian). Bull. Moscow Soc. Nat. 6, 50. Novoselova, L.V., Minaeva, N., 2015. Pollen monitoring in Perm Krai (Russia)– experience
of 6 years. Acta Agrobot. 68, 343–348.https://doi.org/10.5586/aa.2015.042. Núñez, A., Amo de Paz, G., Ferencova, Z., Rastrojo, A., Guantes, R., García, A. M., Alcamí, A.,
Gutiérrez-Bustillo, A. M. and Moreno, D. A., 2017. Validation of the Hirst-type spore trap for simultaneous monitoring of prokaryotic and eukaryotic biodiversities in urban air samples by next-generation sequencing, edited by A. J. McBain, Appl. Envi-ron. Microbiol., 83 (13), doi:https://doi.org/10.1128/AEM.00472-17.
Onen, H., Gunal, H., Ozcan, S., 2014.The Black Sea highway: the route of common rag-weed (Ambrosia artemisiifolia L.) invasion in Turkey. 8th International Conference on Biological Invasions - from Understanding to Action, p. 76.
Oteros, J., García-Mozo, H., Alcázar, P., Belmonte, J., Bermejo, D., Boi, M., Cariñanos, P., Díaz de la Guardia, C., Fernández-González, D., González-Minero, F., Gutiérrez-Bustillo, A.M., Moreno-Grau, S., Pérez-Badía, R., Rodríguez-Rajo, F.J., Ruíz-Valenzuela, L., Suárez-Pérez, J., Trigo, M.M., Domínguez-Vilches, E., Galán, C., 2015. A new method for determining the sources of airborne particles. J. Environ. Manag. 155, 212–218. https://doi.org/10.1016/J.JENVMAN.2015.03.037.
Ozaslan, C., Onen, H., Farooq, S., Gunal, H., Akyol, N., 2016. Common ragweed: an emerg-ing threat for sunflower production and human health in Turkey. Weed Biol. Manag. 16, 42–55.https://doi.org/10.1111/wbm.12093.
Pashley, C.H., Fairs, A., Free, R.C., Wardlaw, A.J., 2012. DNA analysis of outdoor air reveals a high degree of fungal diversity, temporal variability, and genera not seen by spore morphology. Fungal Biol 116 (2), 214–224. https://doi.org/10.1016/J. FUNBIO.2011.11.004.
Perez-Badia, R., Rapp, A., Morales, C., Sardinero, S., Galan, C., Garcia-Mozo, H., 2010.Pollen spectrum and risk of pollen allergy in central Spain. Ann. Agric. Environ. Med. 17, 139–151.
Peternel, R., Culig, J., Hrga, I., Hercog, P., 2006. Airborne ragweed (Ambrosia artemisiifolia L.) pollen concentrations in Croatia, 2002–2004. Aerobiologia 22, 161–168.https:// doi.org/10.1007/s10453-006-9028-9.
Prank, M., Chapman, D.S., Bullock, J.M., Belmonte, J., Berger, U., Dahl, A., Jäger, S., Kovtunenko, I., Magyar, D., Niemelä, S., Rantio-Lehtimäki, A., Rodinkova, V., Sauliene, I., Severova, E., Sikoparija, B., Sofiev, M., 2013. An operational model for fore-casting ragweed pollen release and dispersion in Europe. Agric. For. Meteorol. 182–183, 43–53.https://doi.org/10.1016/j.agrformet.2013.08.003.
Puljak, T., Mamić, M., Mitić, B., Hrga, I., Hruševar, D., 2016. First aerobiological study in Mediterranean part of Croatia (Dalmatia): pollen spectrum and seasonal dynamics