HAL Id: hal-02346807
https://hal.archives-ouvertes.fr/hal-02346807
Submitted on 23 Dec 2020
HAL is a multi-disciplinary open access
archive for the deposit and dissemination of
sci-entific research documents, whether they are
pub-lished or not. The documents may come from
teaching and research institutions in France or
abroad, or from public or private research centers.
L’archive ouverte pluridisciplinaire HAL, est
destinée au dépôt et à la diffusion de documents
scientifiques de niveau recherche, publiés ou non,
émanant des établissements d’enseignement et de
recherche français ou étrangers, des laboratoires
publics ou privés.
Distributed under a Creative Commons Attribution - NoDerivatives| 4.0 International
License
oligotrophic mediterranean coastal systems
Natalia González, Ls García-Corral, Xag Moran, Jack J. Middelburg,
Marie-Dominique Pizay, Jean-Pierre Gattuso
To cite this version:
Natalia González, Ls García-Corral, Xag Moran, Jack J. Middelburg, Marie-Dominique Pizay, et
al.. Drivers of microbial carbon fluxes variability in two oligotrophic mediterranean coastal systems.
Scientific Reports, Nature Publishing Group, 2019, 9 (1), �10.1038/s41598-019-53650-z�. �hal-02346807�
Drivers of Microbial carbon fluxes
Variability in two oligotrophic
Mediterranean coastal Systems
natalia González-Benítez
1,2,3*, Lara S. García-corral
3, Xosé Anxelu G. Morán
4,
Jack J. Middelburg
5,6, Marie Dominique pizay
1,2& Jean-pierre Gattuso
1,2The carbon fluxes between phytoplankton and heterotrophic bacterioplankton were studied in two coastal oligotrophic sites in the NW Mediterranean. Phytoplankton and bacterial production rates were measured under natural conditions using different methods. In the Bay of Villefranche, the temporal variability revealed net heterotrophy in July-October and net autotrophy in December-March. The spatial variability was studied in the Bay of Palma, showing net autotrophic areas in the west and heterotrophic areas in the east. On average bacterial respiration, represented 62% of the total community respiration. Bacterial growth efficiency (BGE) values were significantly higher in autotrophic conditions than in heterotrophic ones. During autotrophic periods, dissolved primary production (DPP) was enough to sustained bacterial metabolism, although it showed a positive correlation with organic carbon stock (DOC). Under heterotrophic conditions, DPP did not sustain bacterial metabolism but bacterial respiration correlated with DPP and bacterial production with DOC. Temperature affected positively, DOC, BGE, bacterial respiration and production when the trophic status was autotrophic. To summarize, the response of bacterial metabolism to temperature and carbon sources depends on the trophic status within these oligotrophic coastal systems.
Marine biogeochemical carbon fluxes are largely variable and their temporal and geographical distribution are essential to understand the oceanic carbon cycle. The database of gross primary production, community respi-ration and net community production (NCP = gross primary production- community respirespi-ration) rates have increased considerably over the last years, but large gaps remain, especially for coastal oligotrophic areas1–3. In
spite of their little area covering, approximately 7% of the surface of the global ocean, coastal waters account for 14% to 30% of total oceanic primary production4, which are highly variable in space and time and have a great
ecological and social interest5. The metabolic balance or NCP informs us whether a marine ecosystem is net
autotrophic (i.e. gross primary production > community respiration) or net heterotrophic (i.e. gross primary production < community respiration)6,7. Available data of oceanic primary production is mostly obtained from
productive areas. However, there are orders of magnitude fewer measurements addressing in coastal oligotrophic regions, the carbon fluxes links between bacterial metabolism and the partitioning among dissolved (DPP) and particulate (PPP) primary production. Understanding how bacteria influence the cycling of organic carbon it is key to assess their role in the ecosystem metabolic balance8.
In oligotrophic Mediterranean coastal waters, it has been shown that large supply of dissolved organic carbon (DOC) from land can sustain elevated community respiration, resulting in net heterotrophy9–11. Autochthonous
DOC, either released from normal algal growth or resulting from trophic interactions12,13, represent a large
fraction (from 20 to 80%) of total primary production (DPP + PPP) in oligotrophic systems14–16. Indeed, the
relative contribution of DPP to total primary production is considered an important autochthonous organic carbon source also for heterotrophic bacteria17, being considered by some authors as inverse18 or constant19 to
1Sorbonne Université, CNRS, Laboratoire d’Océanographie de Villefranche, 181 chemin du Lazaret, F-06230, Villefranche-sur-mer, France. 2Institute for Sustainable Development and International Relations, Sciences Po, 27 rue Saint Guillaume, F-75007, Paris, France. 3Department of Biology, Geology, Physics and Inorganic Chemistry, King Juan Carlos University, C/Tulipán s/n, 28933, Móstoles, Madrid, Spain. 4King Abdullah University of Science and Technology (KAUST), Red Sea Research Center, Biological and Environmental Sciences and Engineering Division, 23955-6900, Thuwal, Saudi Arabia. 5Department of Estuarine and Delta Systems, NIOZ Royal Netherlands Institute for Sea Research and Utrecht University, Yerseke, The Netherlands. 6Department of Earth Sciences, Utrecht University, Princetonlaan 8A, 3584 CB, Utrecht, The Netherlands. *email: [email protected]
the productivity of the system. Bacterial carbon demand includes all the organic carbon assimilated by hetero-trophic bacteria, which can be allocated into anabolic (bacterial production) and catabolic processes (bacterial respiration).
Currently, there is some debate about the dependence of bacterial carbon demand on phytoplankton pro-duction, mainly within oligotrophic systems20,21. In offshore areas not influenced by carbon inputs from land,
phytoplankton primary production was reported to sustain bacterial carbon demand18, but the generality of this
observation for inshore regions has not yet been confirmed22. Other authors21 suggested that bacterial carbon
demand always exceeds contemporaneous primary production in all aquatic systems. Bacterial carbon demand is governed by bacterial growth efficiency (BGE = bacterial production/bacterial carbon demand), however there is a large range of variation in BGE (5–60%23;). In many instances, BGE is not directly measured but inferred from
literature models24,25, which are generally biased with data from productive areas. Therefore, there is a lack of data
about the BGE regulation in oligotrophic coastal waters14,24,26–28.
Ideally, direct measurements of net microbial carbon production and consumption should be used29 but
bac-terial production is usually measured in unfiltered samples and with short incubation times whereas bacbac-terial respiration is measured in filtered samples with longer incubation times. In many studies bacterial respiration is derived from biomass and production data30–32. Moreover, disentangling the factors that control the carbon fluxes
dynamics of marine microbial communities is challenging. The temperature dependence of biological processes has been traditionally expressed using the Van’t Hoff–Arrhenius equation also known as Boltzmann’s factor33–35.
According to this expression, the slope of the natural logarithm of a metabolic rate against the temperature func-tion 1/kT, where k is Boltzmann’s constant and T is the absolute temperature (Kelvin degrees), represents the activation energy (Ea) of that particular metabolic process33–35. Temperature has been described to play a major
role regulating the metabolism of Mediterranean plankton communities36,37. Here we test how the metabolic
status or balance of the plankton community can affect the temperature–dependence of microbial metabolism in these ecosystems.
To improve our knowledge of the trophic status in oligotrophic bays, it is necessary to focus the studies on temporal and spatial variability, despite the given idea that these environments as steady state systems. To reach this goal, we performed simultaneous measurements of net community production, particulate and dissolved primary production, bacterial production and respiration, thus allowing direct BGE, bacterial carbon demand and conversion factor values. The study was carried out in two oligotrophic coastal ecosystems in the NW Mediterranean (Fig. 1). The temporal variability was studied within the Bay of Villefranche (France) and the spa-tial variability was focused in July within the Bay of Palma (Spain), during the period most limited by nutrients. The comparison and join, of both bays is based on the environmental similarities of these regions2,10. The results
will improve further understanding of the link between carbon fluxes and the metabolic trophic status, of these marine coastal ecosystems.
Results
Effect of filtration and incubation time on bacterial metabolism estimations.
To estimate the effect of filtration on bacterial metabolism, bacterial production, bacterial abundance and DOC concentration were compared between filtered and unfiltered samples. DOC concentration in unfiltered (83 ± 3 µmol l−1) andfiltered (97 ± 5 µmol l−1) samples were significantly different (paired t-test; t
21 = 3, p < 0.01, n = 22). Bacterial
abundance was not significantly different before (6.92 ± 0.48 × 10⁵ cell ml−1) and after filtration (6.24 ± 1.02 × 10⁵
cell ml−1). Bacterial production was significantly lower in filtered (17.59 ± 4.03) than in unfiltered (66.45 ± 11.41)
samples (paired t-test; t83 = 4.5, p < 0.001, n = 84). Bacterial production was estimated after different periods of
in situ incubation times (no incubation, 6 and 12 h). After 12 h incubation bacterial production showed values
Figure 1. Study sites in (a) the Bay of Palma and (b) the Bay of Villefranche sur Mer. Stars show the location of the sampled stations.
2.6-times higher compared with those incubated during shorter incubations (0 and 6 h) (F2,45 = 4.3, n = 48,
p = 0.02; Fig. 2). Also, a significant effect of incubation time was observed in bacterial respiration rates (Fig. 2; F2,21 = 4.1, n = 24, p = 0.03), with higher values after 48 h than after 12 and 24 h (Fig. 2). However, the duration
of incubation had no significant effect on unfiltered samples. BGE and bacterial carbon demand are usually estimated using bacterial production and respiration rates which are commonly incubated during different time lengths. In order to minimize possible bias, BGE12 and BCD12 in our experiments were estimated using bacterial
respiration and production measurements from pre-filtered samples both incubated during 12 hours (see material and methods). The average percentage of oxygen consumption in filtered seawater samples (12 and 24 h) com-pared to whole seawater samples, were enabled to estimate bacterial respiration.
Temporal variability in the Bay of Villefranche.
As expected, irradiance showed a seasonal pattern with the highest values found during July followed by October, December and March (Table 1). The lowest tempera-tures were recorded in March (13.2 °C throughout the water column) and the highest in July, coincident with the strongest stratification (Table 1). Changes in the percentage of O2 saturation were similar to those oftempera-ture, with oxygen-saturated waters during July and below 100% during the rest of the year (Table 1, Fig. 3). The concentrations of NO−
3 and Si (OH)4 were lower than 1 µmol l−1 except in March (Table 1). The highest DOC
concentrations were during July (70.7 ± 2.2 µmol l−1) and the lowest during March (63.8 ± 0.6 µmol l−1; Table 1).
Chlorophyll-a concentrations varied considerably (from 0.1 to 1.1 mg m−3) across depths and months, with
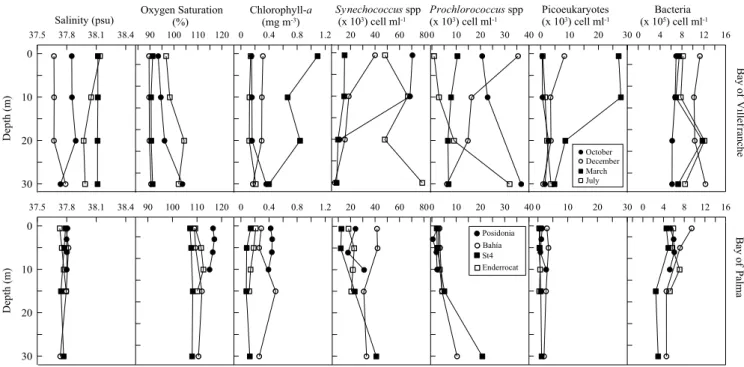
mean values increasing from summer to spring (Fig. 3). The picophytoplankton community composition was dominated by Synechococcus cyanobacteria. The highest abundances of Synechococcus were found in October and July, while Prochlorococcus peaked in December and October and photosynthetic picoeukaryotes in March. Heterotrophic prokaryotes abundances ranged from 6.1 to 12.3 × 10⁵ cells ml−1, with the highest abundances
measured in December and the lowest in October (Fig. 3). Picoautotrophs biomass average contributed with 9.4 (±1.1) % of the total autotrophic biomass (Chl-a).
Primary production was generally low, with DPP and PPP ranging from 0.02 to 1.36 mg C m−3 h−1 and 0.03
to 2.10 mg C m−3 h−1; respectively, with the highest values observed in the spring bloom period during March
(Fig. 4). Percentage of extracellular release was highly variable, from 5.0 to 86.6%, with the lowest values recorded in December and the highest ones in October (Table 1, Fig. 4). Heterotrophic bacterial production showed a min-imum of 1.6 ± 0.4 pmol Leu l−1 h−1 in March (equivalent to 0.002 mg C m−3 h−1) and a maximum of 14.9 ± 6.6
pmol Leu l−1 h−1 in July (0.02 mg C m−3 h−1). Indeed, bacterial respiration (BR) was lowest in December
(0.01 ± 0.004 µmol O2 l−1 h−1) and highest in October (0.04 ± 0.01 µmol O2 l−1 h−1) (Fig. 4). BGE12 ranged from
0.3 to 22.4%, with the highest value in summer and lowest in spring (Table 1).
Spatial variability in the Bay of Palma.
Irradiance and temperature values were very similar between stations, with approximately 500 µmol photons m−2 s−1 and 22.2 °C (Table 1). Salinity averaged 37.8 psu and meanO2 saturation were above 100% saturation across sites (Table 1, Fig. 3). Low dissolved inorganic nutrient
concen-trations characterized these oligotrophic waters, with NO−
3 and Si (OH)4 always below or equal to 1 µmol l−1
(Table 1). DOC concentration was higher at the western stations Posidonia and Bahia, (89.1 ± 4.4 and 85.5 ± 1.7; µmol l−1, respectively (Fig. 1, Table 1). Chorophyll-a values were below 0.5 mg m−3 and followed the same pattern
as DOC with the highest values measured at Posidonia and Bahia stations (Fig. 3). Picophytoplankton commu-nity composition was dominated by Synechococcus spp across stations, with highest abundances measured at Bahia station (Fig. 3). Prochlorococcus spp peaked at Station 4 and photosynthetic picoeukaryotes at Bahia station. Heterotrophic prokaryotes abundance ranged from 2.4 to 9.4 × 10⁵ cells ml−1, with the highest abundances at
Bahia and lowest at Station 4 station (Fig. 3). The average picoautotrophs biomass accounted 5.7% ( ± 0.7) of the total autotrophic biomass. Total primary production ranged from 0.16 to 2.99 mg C m−3 h−1, with DPP ranging
from 0.11 to 1.36 mg C m−3 h−1 and PPP from 0.03 to 1.63 mg C m−3 h−1. Highest values of both fractions, DPP
and PPP, were measured at Posidonia station and the lowest at Enderrocat (Fig. 4). Percentage of extracellu-lar release averaged 53.4 ± 3.7%, with highest values observed at Enderrocat station and simiextracellu-larly low values at Posidonia and Bahia stations showing an opposite tendency of chlorophyll-a and DOC (Table 1, Fig. 4). Figure 2. Effect of the incubation time under in situ simulated conditions on the respiration rates in filtered (bacterial respiration, BR) and unfiltered samples (community respiration, CR) and bacterial production rates (BP). Error bars represent standard error (n = 16). Lower case letters denote significantly different mean values (ANOVA, p < 0.05; Student-Newman-Keul post-hoc). Numbers within the bars indicate the time of incubation in hours.
In the Bay of Palma, the lowest bacterial production was 11.8 pmol Leu l−1 h−1 (0.01 mg C m−3 h−1) observed
at Enderrocat station and the highest in Posidonia station of 252.9 pmol Leu l−1 h−1 (0.29 mg C m−3 h−1) (Fig. 4).
Bacterial respiration showed the lowest value at Bahia station, with 0.06 µmol O2 l−1 h−1 and the highest at Station
4 station with 0.24 µmol O2 l−1 h−1 (Fig. 4). BGE12 ranged from 0.3 to 40.6%, with the highest mean values at
Posidonia station and the lowest observed at the Enderrocat station (Table 1).
Effects of environmental and biological variables on bacterial metabolism on both bays.
The temporal variability in the Bay of Villefranche included net heterotrophy during summer and autumn (−0.2 ± 0.2 and −0.4 ± 0.1 µmol O2 l−1 d−1, respectively) and net autotrophy during winter and spring (0.6 ± 0.4 and 2.7 ± 0.9µmol O2 l−1 d−1, respectively). The spatial variability in the Bay of Palma communities showed autotrophy at the
western stations Posidonia and Bahia (1.5 ± 1.0 and 0.5 ± 0.3 µmol O2 l−1 d−1, respectively) and heterotrophy, in
the eastern stations Enderrocat and Station 4 (−1.8 ± 1.5 and −2.5 ± 1.5 µmol O2 l−1 d−1, respectively).
All data were grouped into two categories regardless of the location and from an ecophysiological point of view: net autotrophic (NCP > 0) and net heterotrophic (NCP < 0). Coherently, results confirmed that DPP and
Sampling
depths Salinity O2 Saturation Irradiance Temperature Si (OH)4 NO−3 DOC BGE12 PER
m psu % µmol photons m−2 s−1 °C µmol l−1 µmol l−1 µmol l−1 % %
Bay of Villefranche October 0.5, 10, 20, 30 37.8 96.8 ± 2.3 462.5 ± 277.8 20.7 ± 0.9 0.1 ± 0.0 0.9 ± 0.4 66.3 ± 1.0 0.6 ± 0.1 55.8 ± 7.2 December 0.5, 10, 20, 30 37.7 89.8 ± 0.2 261.7 ± 164.6 17.2 ± 0.0 0.8 ± 0.0 0.7 ± 0.2 64.4 ± 1.6 1.9 ± 0.7 20.4 ± 6.7 March 0.5, 10, 20, 30 38.1 90.7 ± 0.2 184.2 ± 72.2 13.2 ± 0.0 1.7 ± 0.4 3.0 ± 0.3 63.8 ± 0.6 0.5 ± 0.1 54.8 ± 12.8 July 0.5, 10, 20, 30 38.0 100.9 ± 1.7 675.0 ± 318.1 21.3 ± 2.2 0.7 ± 0.1 0.7 ± 0.2 70.7 ± 2.2 7.3 ± 5.1 31.6 ± 7.2 Bay of Palma Posidonia 0.5, 3, 6, 10 37.8 116.1 ± 0.4 581.7 ± 166.5 22.6 ± 0.1 0.4 ± 0.1 0.3 ± 0.0 89.1 ± 4.4 17.5 ± 8.1 36.5 ± 7.1 Bahia 0.5, 5, 15, 30 37.8 110.1 ± 0.7 495.9 ± 200.1 22.4 ± 0.7 0.9 ± 0.1 0.3 ± 0.0 85.5 ± 1.7 10.9 ± 3.3 36.6 ± 1.9 Station 4 0.5, 5, 15, 30 37.8 107.6 ± 0.2 478.4 ± 187.0 20.8 ± 0.7 1.0 ± 0.1 0.4 ± 0.0 71.6 ± 2.5 3.4 ± 1.1 61.2 ± 2.5 Enderrocat 0.5,5, 10, 15 37.8 110.8 ± 0.7 619.2 ± 170.5 23.0 ± 0.5 1.0 ± 0.0 0.3 ± 0.0 68.8 ± 4.2 1.1 ± 0.5 78.3 ± 3.2
Table 1. Average ± SE values within the photic zone for selected variables at the different periods and stations sampled. Salinity, percentage of oxygen saturation, irradiance, temperature, silicate (Si (OH)4), nitrate (NO−3),
dissolved organic carbon (DOC), bacterial growth efficiency (BGE12) and percent extracellular release (PER).
20 40 60 80 Synechococcus spp (x 103) cell ml-1 0 10 20 30 Picoeukaryotes (x 103) cell ml-1 0 4 8 12 16 Bacteria (x 105) cell ml-1 Ba yo f Vi llef ranche October December March July 37.5 37.8 38.1 38.4 Salinity (psu) 30 20 10 0 Dept h( m) 0 0.4 0.8 1.2 Chlorophyll-a (mg m-3) 0 10 20 30 40 Prochlorococcus spp (x 103) cell ml-1 90 100 110 120 Oxygen Saturation (%) 20 40 60 80 0 10 20 30 0 4 8 12 16 B ay of Pa lma 37.5 37.8 38.1 38.4 30 20 10 0 De pth (m ) 0 0.4 0.8 1.2 0 10 20 30 40 90 100 110 120 Posidonia Bahía St4 Enderrocat
Figure 3. Vertical profiles of salinity (psu; practical salinity units), percentage of oxygen saturation, Chlorophyll-a (mg m−3), Synechococcus spp (x 103cell ml−1), Prochlorococcus spp (x 103cell ml−1),
Picoeukaryotes (x 103cell ml−1) and heterotrophic prokaryotes (x 105cell ml−1) abundances in the Bay of
PPP were significantly higher in autotrophic relative to heterotrophic conditions (F1,30 = 7.1, n = 32, p = 0.01
and F1,30 = 10.8, n = 32, p = 0.002, respectively). DPP sustained bacterial carbon demand under autotrophic
conditions (DPP/BCD = 1.5 ± 0.4), whereas it did not under heterotrophic (DPP/BCD = 0.4 ± 0.1; Fig. 5). BGE was also significantly higher (F1,30 = 5.1, n = 32, p = 0.03) in autotrophic than in heterotrophic communities
(8.5 ± 2.6% vs 1.9 ± 0.5%) (Fig. 5). However, percentage of extracellular release and bacterial carbon demand showed no significant differences between trophic status; respectively (F1,30 = 1.7, n = 32, p > 0.05 and F1,30 = 0.5,
n = 32, p > 0.05) (Fig. 5).
When differentiated according to NCP values, DPP and Chl-a were positive and significant linearly correlated only within autotrophic communities (R2 = 0.28, n = 17, p = 0.03), but not within heterotrophic ones (p > 0.05;
Fig. 6a). Similarly, the linear regression between PPP and chlorophyll-a was significant and positive for auto-trophic communities (R2 = 0.45, n = 17, p = 0.003), whereas no correlation was found in the heterotrophic ones
(p > 0.05; Fig. 6b).
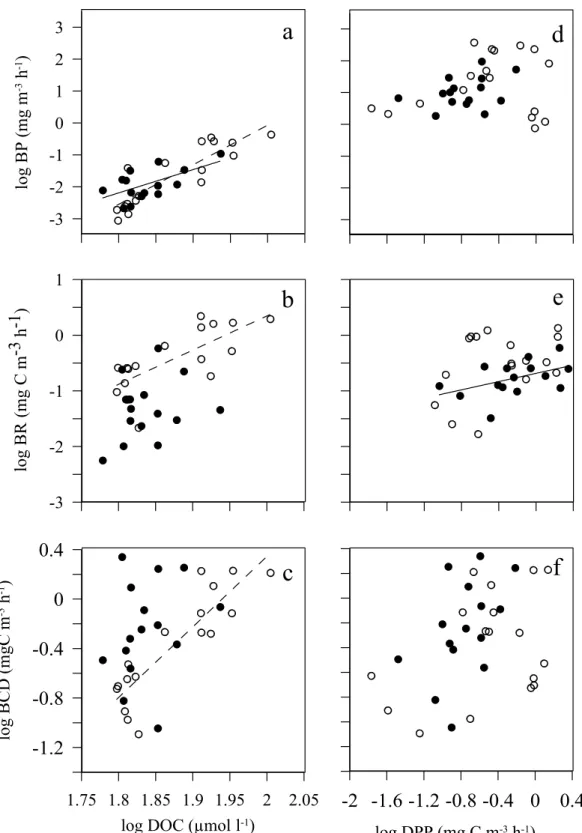
Bacterial production showed a significant relationship with DOC concentration independently of the trophic status of the community (Fig. 7a) while bacterial respiration and carbon demand were correlated with DOC con-centration only with autotrophic communities (Fig. 7b,c). In contrast, bacterial respiration was only significantly related to DPP in heterotrophic communities (Fig. 7e), whereas no relationships of bacterial production and carbon demand were observed with DPP (Fig. 7d,f).
0 0.2 0.4 BR (µmol O2l-1h-1) 0 40 80 PER (%) 0 5 10 15 20 25 BGE12(%) Ba y ofV ill efr an ch e October December March July 0 0.3 0.6 0.9 1.2 1.5 DPP (mgC m-3h-1) 30 20 10 0 De pt h( m) -8 -4 0 4 8 NCP (µmol O2l-1d-1) 0 10 20 30 40 BP (pmol Leu l-1h-1) 0 0.5 1 1.5 2 PPP (mgC m-3h-1) 0 0.2 0.4 0 40 80 0 5 10 15 20 25 B ay of Pa lm a 0 0.3 0.6 0.9 1.2 1.5 30 20 10 0 Dept h( m) -8 -4 0 4 8 0 100 200 300 400 0 0.5 1 1.5 2 Posidonia Bahía St4 Enderrocat
Figure 4. Vertical profiles of the rates of dissolved (DPP) and particulate (PPP) primary production (mg C m−3 h−1), net community production (NCP, µmol O
2 l−1 d−1), bacterial respiration (BR, µmol O2 l−1 h−1)
and bacterial production (BP, pmol Leu l−1 h−1). Also show the percent extracellular release (PER = DPP /
[DPP + PPP]) and bacterial growth efficiency (BGE12, %) in the Bay of Villefranche (upper panels) and the Bay
of Palma (lower panels). Error bars represent standard error.
0 0.4 0.8 1.2 1.6 2 DP P/ B C D 0 20 40 60 PE R (% ) 0 2 4 6 8 10 B GE 12 (% ) 0 0.4 0.8 1.2 1.6 2 BC D 12 (m g C m -3 h -1 ) DPP/BCD PER BGE12 BCD12
*
*
Figure 5. Effect of the trophic state (empty bars are autotrophic and dashed bars are heterotrophic) on Dissolved Primary Production /Bacterial Carbon Demand ratio (DPP/BCD), Percentage of Extracellular Release (PER), Bacterial Growth Efficiency (BGE12) and Bacterial Carbon Demand (BCD12). Error bars
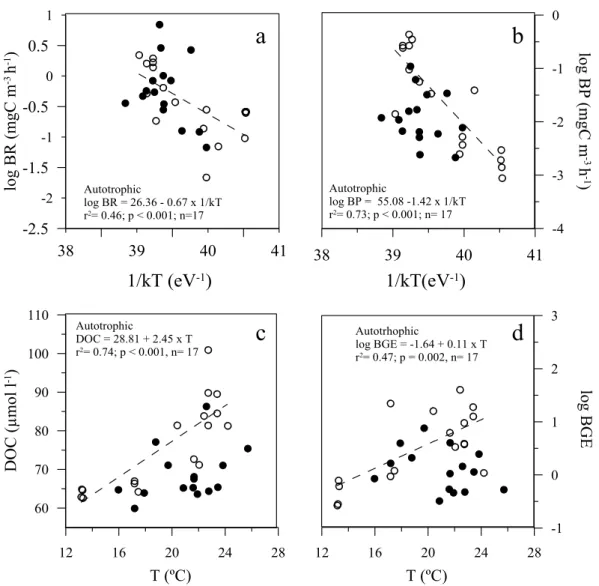
Bacterial production and respiration, BGE and DOC concentrations were positively correlated with temper-ature only under autotrophic conditions, but not under heterotrophic (Fig. 8a–d). The slope or activation energy of the Arrhenius relationship for bacterial production was 1.42 eV, 0.67 eV for bacterial respiration and 0.83 eV for BGE.
Discussion
Relying on actual system-specific measurements rather than on literature or models results, does not completely solve the coupling degree between phytoplankton and heterotrophic bacterioplankton because measuring the flow of carbon through bacteria is methodologically challenging. For instance, bacterial respiration and produc-tion estimates may still bring uncertainties due to factors such as the incubaproduc-tion time, bottle effects, bottle opaque to UVB radiation, filtration artefacts or the choice substrate-to-carbon conversion factors29,37–39.
Our first concern was to make sure that bacterial abundance was not significantly different after filtration, so that metabolic processes measured in the filtered samples represented realistically the rates of bacterial respiration in the no processed samples.
Filtering process by the 0.8 µm filters increases DOC concentration because some planktonic cells could have been broken, leaking part of their cytoplasmic content into the filtrate40. However, this process even if did not
affect small bacteria it certainly had influence on attached bacteria29,41 which are not detected by the flow
cytom-eter. For this reason, bacterial production was higher before the filtering process and heterotrophic prokaryotes abundance did not show any significant difference.
Since bottle effects are to some extent unavoidable (e.g.42), another factor contributing to uncertainty is
the incubation time. Contrary to previous studies27, bacterial respiration and production did not show linear
responses after 12 and 48 h, respectively. This observation is not trivial, as most of the previous studies did not consider as a key variable the incubation time or the bottle effect14,36,43. Bacterial production is typically measured
in unfiltered samples and incubated for a short period (2–8 hours), whereas bacterial respiration is determined in filtered samples that are subsequently incubated for at least 24 or 48 h. Bacterial respiration could be stimulated during long incubations (48 h42) by viral activity44 or by changes in bacterial community composition26,45. Shorter
incubations (i.e. <6 h) limit the bottle effect and provide the most accurate consumption rates of labile DOC9. On
the contrary, samples incubated for longer times will be exposed to higher cumulative processes, such as cell lysis, increasing DOC release and consequently increased bacterial production and respiration46.
Despite the methodological challenge, in this study we were able to demonstrate coherent patterns in bacte-rial carbon fluxes in two NW Mediterranean embayment’s. Our direct rather than indirect estimations and the simultaneous temporal and spatial studies, might provide a new insight of the bacterial carbon fluxes and their temperature and metabolic status dependence within oligotrophic systems.
In this study, we measured an expected significantly higher chlorophyll-a concentrations under autotrophic periods (stations which values of NCP are higher than 0) compare to those concentrations under heterotrophic conditions (NCP < 0). However, picophytoplankton biomass of the diverse groups measured, was not signif-icantly different during heterotrophic and autotrophic periods. Indeed, regardless to the locations TPP, and consequently DPP and PPP, was significantly higher under autotrophic conditions compare to heterotrophic conditions. Contrary to previous works16,18 and in agreement with others19 differences in percentage of
extracel-lular release average values between trophic states were not significant (41 ± 5% and 53 ± 5% in autotrophic and heterotrophic systems, respectively).
Figure 6. Relationship between Dissolved Primary Production (DPP) (a) and Particulate Primary Production (PPP) (b) with Chlorophyll-a concentrations under autotrophic (white dots) and heterotrophic (black dots) conditions. Dashed lines represent the fitted Model II linear regressions for the significant relationship within autotrophic samples.
-3
-2
-1
0
1
log BR
(mg C
m
-3
h
-1
)
b
c
-2 -1.6 -1.2 -0.8 -0.4 0 0.4
log DPP (mg C m
-3h
-1)
1.75 1.8 1.85 1.9 1.95 2 2.05
log DOC (µmol l
-1)
-1.2
-0.8
-0.4
0
0.4
log BCD (m
gC
m
-3h
-1)
f
e
-2
0
2
-1
1
3
-3
log
B
P
(mg
m
-3h
-1)
a
d
Figure 7. Relationship between: Dissolved Organic Carbon (DOC) and Dissolved Primary Production (DPP) with: Bacterial Production (BP) (a,d); Bacterial Respiration (BR) (b,e) and Bacterial Carbon Demand (BCD) (c,f). Black and white dots represent heterotrophic and autotrophic conditions, respectively. The solid line (for heterotrophic conditions) and dashed line (for autrotrophic conditions), represent the significant fitted Model II linear regressions. The equations parameters are: a) log BP = −24.87 + 12.40 × log DOC; r2 = 0.76; p < 0.0001;
n = 17 (dashed line for autotrophic conditions). log BP = −15.34 + 7.30 × log DOC; r2 = 0.36; p < 0.05; n = 15
(solid line for heterotrophic conditions). (b) log BR = −11.94 + 6.14 × log DOC; r2 = 0.53; p = 0.001, n = 17
(dashed line for autotrophic conditions). (c) log BCD = −11.07 + 5.70 × log DOC; r2 = 0.77; p < 0.001, n = 17
(dashed line for autotrophic conditions). (e) log BR = 0.72 + 1.24 × log DPP; r2 = 0.50; p < 0.005, n = 15 (solid
Our results showed a robust relationship between DPP and PPP with photosynthetic proxy biomass (Chl-a) in autotrophic waters, while they were not correlated in heterotrophic waters. At the Bay of Villefrance-sur-Mer, maximum rates of DPP and PPP were registered during March when nitrate and chlorophyll-a concentrations were higher and seawater temperature was lower. This situation corresponds with the spring phytoplankton bloom and is followed by an increase in bacterial production as a consequence of increased DPP19,47. However, the
lack of correlation between DPP and PPP with chlorophyll-a under heterotrophic conditions, may be attributable to a strong nutrient limitation for phytoplankton growth48, due to process such as grazing16 or to phytoplankton
lysis49. Despite the general low nutrient concentrations measured, during the spring bloom of March, the high
nitrate concentrations measured (>1 up to 4 µmol l−1) were similar to those registered in the same area2, but
lower than other oligotrophic Mediterranean regions (up to 7.0 µmol l−1 for nitrate in14).
Contrary to the previous described situation2,14,50, during summer at the Bay of Palma, the lowest nitrate
con-centration co-occurred with elevated water temperature (23.4 °C) and high DOC concon-centrations (90 µmol l−1).
Some authors9,51 reported an accumulation of DOC during summer and autumn and attributed this to the
inabil-ity or inefficiency of bacteria to use it under nutrient limitations, the so-called malfunctioning microbial loop52.
However, not only DOC, but also phytoplankton DPP has been considered an important carbon source to sup-port bacterial metabolism18,19. In our study, we observed a positive correlation between DPP and BR, but
exclu-sively when the system was heterotrophic. Under heterotrophic nutrient-deplete conditions, the fresh and labile carbon from phytoplankton production (DPP) may be firstly respired for bacterial basal metabolism53. Although,
under the same heterotrophic scenario, bacterial production is correlated to DOC concentrations instead of DPP, probably due to the extra resources needed for bacterial growth or production, than those used to maintain basal bacterial respiration31. Therefore, at resource limiting conditions when phytoplankton production was too low
38
39
40
41
1/kT (eV
-1)
-2 -1 0 1-1.5
-0.5
0.5
-2.5
lo
gB
R(
mg
Cm
-3h
-1)
c
12 16 20 24 28T (ºC)
60 70 80 90 100 110DO
C(
µmol
l
-1)
a
Autotrophic log BR = 26.36 - 0.67 x 1/kT r2= 0.46; p < 0.001; n=17 Autotrophic DOC = 28.81 + 2.45 x T r2= 0.74; p < 0.001, n= 1738
39
40
41
1/kT(eV
-1)
-4 -3 -2 -1 0lo
gB
P
(mg
Cm
-3h
-1)
Autotrophic log BP = 55.08 -1.42 x 1/kT r2= 0.73; p < 0.001; n= 17 Autotrhophic log BGE = -1.64 + 0.11 x T r2= 0.47; p = 0.002, n= 17b
d
12 16 20 24 28T (ºC)
-1 0 1 2 3lo
gB
GE
Figure 8. Temperature dependence relationship between log-transformed (a) Bacterial respiration and (b) Bacterial production vs water temperature (1/kT with k, the Boltzmann’s constant (8.617734 10−5 eV K−1) and
T the water temperature (°K)). (c) Dissolved organic carbon (DOC) and (d) Log-transformed bacterial growth efficiency vs water temperature (°C). Black and white dots represent heterotrophic and autotrophic conditions, respectively. The dashed lines and equations parameters represent the significant fitted model II regressions.
to sustain BP, labile DOC from nearby seagrass meadows may be used as an organic carbon source54–56. Since
abundant beds of Posidonia oceanica were present in both bays, a large fraction of the DOC used for bacterial production may come from the exported carbon from benthic organisms56,57.
On the other hand, under autotrophic conditions, bacterial metabolism, was positively correlated with DOC concentrations and DPP was potentially sufficient to sustain the bacterial carbon demand (DPP/BCD > 1). These results suggest that DPP contributed signifiicantly to the labile DOC pool under autotrophic conditions and bacteria were growing actively when DOC stock concentration was higher enough to maintain bacterial metabo-lism2,9,28,58,59. The highest DPP/BCD ratio was found in Villefranche´s Bay during March when the spring bloom
occurred and picoeukaryotes biomass was higher than other picoautotrophs groups. Although picoeukaryotes only accounted 3% of the total autotrophic biomass, concurred with the higher DPP concentrations measured60,61
during that period.
The previous reported BGE values depend, however, on the particular leucine-to-carbon conversion factor used31. In this work, bacterial production was estimated from in situ incubations and calculated with empirically
determined leu-to-C conversion factors as emphasized in recent studies27,62,63. Bacterial production values (0.001
to 0.44 mg C m−3 h−1) were within the range reported in other Mediterranean coastal sites14,36,64, being more
active during autotrophic periods, and leading to higher BGE values up to 4-fold compare to those periods where heterotrophic conditions dominated.
It has also been described that bacterial respiration contribute with a significant amount to total community respiration, frequently more than 50%7,25,65. In our study, bacterial respiration represented, on average, 62% of the
total community respiration and did not depend on the metabolic balance of the system. However, bacterial respi-ration mean value at both coastal oligotrophic environments (1.9 ± 0.2 mmol C m−3 d−1) was substantially lower
than the average for coastal regions (7.1 ± 12.2 mmol C m−3 d−1) given in the revision of Robinson39. Indeed,
bac-terial respiration was only slightly higher than open ocean value (1.3 ± 0.2 mmol C m−3 d−1), probably showing
the general oligotrophic nature of Mediterranean coastal waters.
Our BGE values (0.3–40.6%) were within the range of published values for the Mediterranean Sea2,14,36,58,66.
However, the median BGE (1.6%) was substantially lower than the value given for coastal regions (16%) and even the open ocean (8%)39, although it should be noted that this review39 did not include any data from the coastal
oligotrophic Mediterranean.
Temperature, nutrient concentrations, dissolved organic matter lability and bacterial taxonomic composition have been regarded among the main factors that can influence BGE14. Robinson39 suggested that most of the
BGE variability within oligotrophic waters is explained by bacterial respiration. Other authors31 found that BGE
is not directly regulated by temperature, but by the availability of substrates for growth. According to our results, temperature explains a large part of BGE (47%), bacterial respiration (46%) and production variances (73%) when there is a not nutrient limitation. Indeed, the metabolic status of the system is a critical factor determining the temperature-dependence of bacterial metabolic rates. Consequently, the significant and positive relationships between temperature and bacterial metabolic rates (bacterial production and respiration, BGE) during periods of net autotrophy did not hold for heterotrophic periods. Our results confirm that substrate availability is a key factor governing the temperature dependence of heterotrophic bacterial metabolism31,67. Temperature is a
rele-vant factor under autotrophic conditions, when our system is in the stage between the bottom-up and top-down control68. However, temperature is not a main driver of bacterial metabolism under heterotrophic conditions, due
to the limited resource availability (bottom-up control).
The lower slope of the bacterial respiration regression (EaBR = 0.67 eV) indicates a lower activation energy
required for this process relative to that of bacterial production (EaBP = 1.42 eV), what confirms their different
temperature-dependence as an intrinsic characteristic of two independent biochemical processes59.
The bacterial respiration activation energy value estimated in this study (EaBR = 0.67 eV) is very close to the
theoretical Ea of 0.65 eV predicted by the Metabolic Theory of Ecology for respiratory processes33,34. Compared
to previous works, our bacterial respiration Ea value is lower than the values reported by Mazuecos69 for the dark
ocean (0.90 eV) and higher than those values for the global ocean (EaBR = 0.589 eV31), (EaBR = 0.57 eV70).
Bacterial production activation energy (EaBP = 1.42 eV) is more than twice the maximum value described
by Morán71 (from −0.14 to 0.67 eV), although it is within the range described by Arandia-Gorostidi72 (−0.3 to
1.46 eV) both for the NE Atlantic coastal waters, and slightly higher than the in situ bacterial production meas-ured at the Baltic Sea (1.24 ± 0.16 eV73). The relationship of bacterial metabolic rates with temperature under
autotrophic conditions, agrees with higher Eas values during the highest nutrient concentration71 and productive
bloom periods67,72.
We conclude that the metabolic status (autotrophic vs heterotrophic) of the oligotrophic coastal Mediterranean studied systems, determines the source of organic carbon where the bacterial communities are supported by, as well as the temperature dependence of microbial metabolic processes.
Material and Methods
Study site and sampling.
The spatial variability was investigated in the Bay of Palma in June 2002 (Fig. 1a). Four stations were sampled: Enderrocat (39.4°N 2.7°E), Station 4 (39.5°N 2.4°E) in the east of the bay and Bahía (39.5°N 2.6°E) and Posidonia (39.5°N 2.5°E) located in the west. Stations Posidonia and Bahia are located abovePosidonia oceanica meadows and all stations were sampled at four depths (Table 1). Posidonia and Enderrocat are shallower (approximately 10 m) than Bahia and Station 4 (30 m). The temporal variability was studied in the oligotrophic coastal Bay of Villefranche in October and November 2002, March and July 2003 at four depths (Table 1). Point B located at the entrance of the bay (43° 41′N; 7°19′E, Fig. 1b) is a long-term monitoring station. All bottle samples were incubated in situ during 24 h on a vertical line attached to a floating buoy.
Hydrography, irradiance and nutrients.
Vertical profiles of temperature, salinity and oxygen satura-tion were obtained at each stasatura-tion using a SeaBird SBE19 CTD in the Bay of Palma or SBE25 in the Bay of Villefranche. Profiles of light penetration were performed with a LI-COR spherical sensor (LI-193SA) connected to a LI-1400 data–logger. Seawater was collected at four depths within the euphotic layer at each station (Table 1) using single 12 l Niskin bottles. Dissolved inorganic nutrients concentrations were measured using automated colorimetric techniques after filtration through Whatman GF/F glass fibre filters74. Dissolved silicate wasmeas-ured after filtration through 0.45 µm polyvinylidene fluoride membrane filters (PVDF, Millipore). Chlorophyll-a was measured on GF/F filters that were stored frozen until extraction and analysis by high-performance-liquid chromatography75.
Dissolved organic carbon (DOC).
Due to the low particulate carbon concentrations in the two sites, total organic carbon samples were collected and not filtered in order to minimize the risk of contamination. Samples of DOC concentration were collected in combusted (450 °C for 24 h) glass ampoules (Wheaton), acidified with 85% H3PO4 flame-sealed immediately after collection and stored in the dark at ambient temperature pending analysis.DOC concentration was measured by high temperature combustion with a Shimadzu TOC-5000 total organic carbon analyser. All concentrations are reported as the average of three replicate injections.
Picoplankton abundance.
The abundances of heterotrophic prokaryotes, Prochlorococcus spp,Synechococcus spp and photosynthetic picoeukaryotes were estimated using a bench-top flow cytometer (Becton
and Dickinson FACScalibur) equipped with a laser emitting at 488 nm. Aliquots of 2 ml were fixed with 1% paraformaldehyde and 0.05% of glutaraldehyde (final concentration), frozen in liquid N2 and stored at −80 °C
pending analysis. The samples for heterotrophic prokaryotes abundance were previously stained with Syto-13 Molecular Probes (2.5 µM) and an aliquot of 0.96 µm fluorescent latex beads (Polysciences) was also added as internal standard to each tube. The beads were calibrated every day using a beads solution (TrueCount beads) for which the bead abundance is precisely known. Heterotrophic prokaryotes abundance was identified in plots of side scatter (SSC) versus green fluorescence (FL1) as described by76. Prochlorococcus spp and Synechococcus
spp were identified in plots of SSC versus orange fluorescence (FL2) and red fluorescence (FL3). PA had a higher SSC and FL3 than both Prochlorococcus spp and Synechococcus spp and no FL2 signal. In order to convert cell abundance to carbon biomass it was used, the conversion factors proposed by77: 12 fg C cell−1 for heterotrophic
prokaryotes, 1500 fg C cell−1 for picoeukaryotes, 32 fg C cell−1 for Prochlorococcus spp, and 100 fg C cell−1 for
Synechococcus spp. The total phytoplankton carbon biomass was estimated using a carbon-to-chlorophyll-a ratio
of 12078.
primary production
14c technique.
The incorporation of carbon into the dissolved and particulatefrac-tions was measured using the 14C technique79. Water samples (30 ml) were transferred to one dark and three light
bottles and incubated in situ at each depth and station. The samples were incubated in situ on a vertical line from sunrise to sunset after addition of 30 µCi (1110 Kbq) of sodium bicarbonate (NaH14CO
3). Upon completion of
the incubation, two 5 ml aliquots of each sample were placed into 20 ml scintillation vials for determination of total labelled organic carbon (Total Primary Production = DPP + PPP). The unit for DPP and PPP were estimated by the incubation time, which was the daylight time (mg m−3 h−1). Two more 5 ml aliquots of each sample were
filtered through 0.22-µm mixed cellulose esters membrane filters (Millipore) for determination of PPP and the filtrate was collected for determination of DPP. Filters were placed into vials and exposed to concentrated hydro-chloric acid fumes for a minimum of 12 h before the addition of 3.5 ml Packard Ultima Gold (PerkinElmer) liquid scintillation cocktail. Liquid samples (total primary production and DPP) were acidified with 100 µl of hydro-chloric acid (5N) and bubbled with air for 2 h before addition of 15 ml Ultima Gold XR (PerkinElmer) liquid scintillation cocktail. Radioactivity (dpm) was measured in a Packard Tri-Carb 4000 scintillation counter. Counts from the dark bottles were subtracted from counts measured in the light bottles to correct for non-photosynthetic
14C-incorporation. The radioactivity of the NaH14CO
3 added to each sample was estimated from 20 µl aliquots.
Bacterial metabolism.
To estimate in situ community respiration, the first set of seawater samples were incubated in dark BOD (Biological Oxygen Demand) bottles (60 ml) on a vertical line in situ during 24 h. At each station and depth, 5 bottles were immediately fixed with Winkler reagents80 (time 0) and five more bottleswere fixed after 24 h. The second set of samples was incubated under dark condition in a temperature-controlled incubator simulating in situ temperature to calculate incubator community respiration. The third set of samples was filtered (142 mm diameter, 0.8 µm) to include just the bacterial fraction to estimate the incubator bacterial respiration. The filtration was carried out with a low vacuum pressure system at each station and depth. No more than 10 l of a given sample was filtered through the same filter. The percentage of oxygen consumption in filtered seawater samples compared to incubator whole seawater samples, enabled us to estimate incubator bacterial respiration. This percentage was applied to the in situ community respiration to calculate the in situ bacterial respiration.
To estimate the effect of filtration on bacterial metabolism, bacterial abundance and production, and DOC concentration were compared at each station and bay between filtered and unfiltered samples at each depth.
To estimate the effect of incubation time on bacterial metabolism, at each station of the Bay of Palma (S4, Posidonia, Enderrocat and Bahia) and depth (surface and bottom) an extra set of filtered and unfiltered seawater samples were incubated in dark BOD bottles (60 ml) during 12, 24 and 48 hours to estimate community and bacterial respiration. For bacterial production rates, seawater samples were incubated in borosilicate bottles on a vertical line in situ. At each depth and station, three replicates were recovered at sunrise (0 h of incubation), midday (6 h of incubation) and sunset (about 12 h of incubation depending on the season).
Dissolved oxygen concentration was determined by titration with a potentiometric end-point detection80.
Analyses to estimate respiration were performed with a redox electrode (9778-SC, Orion) and a custom built titrator. Bacterial production was estimated as the rate of 3H-leucine incorporation using standard methods81 in
Eppendorf vials. Sea water samples were transferred to Eppendorf vials (1.5 ml). Three were spiked with 5 µl of cold leucine (20 nM final concentration) and 25 µl of 3H-leucine (10 nM final concentration; Amersham, specific
activity 170 µCi nmol−1). The fourth sample, to which 100 µl of 100% trichloroacetic acid was immediately added,
served as a control.
The conversion factor required to express the incorporation of leucine into carbon units was estimated at stations Station 4 and Enderrocat at the surface (0.5 m) and bottom depth (33 and 16 m, respectively) following the procedure proposed in82. A sample (1.8 L) was filtered through a 0.2 µm polycarbonate membrane previously
rinsed with milliQ water and with sample water and placed in a bottle with 0.2 l of unfiltered water. The incuba-tion lasted for 2 d in a temperature-controlled incubator simulating in situ temperature. Aliquots for bacterial production (leucine incorporation) and abundance (cytometry) were processed every 6 h. The conversion factor (CF) was calculated using the relationship derived by Kirchman and Ducklow in82:
= CF e e B b µ
Where µ is the growth rate (d−1) determined from the change in biomass over time, eB is the y-intercept of
Ln (biomass in cell ml−1) vs time and eb is the y-intercept of Ln (leucine incorporation in pmol Leu−1l−1h−1)
vs time. Four values of conversion factors were obtained and the average (1.15 ± 0.33 kg C mol−1; see Table 1
Supplementary Information) was used to convert leucine incorporation to carbon uptake for bacterial carbon demand and growth efficiency (BGE) calculations. BGE was estimated as the ratio of bacterial production to total bacterial carbon demand (BP + BR). A respiratory quotient (RQ) of 1 was assumed24.
Net community production (NCP).
For estimating production of dissolved oxygen, seawater samples (10 replicates) were transferred into transparent BOD bottles (60 ml) and incubated on a vertical line in situ during 24 h. At each station and depth, incubations started at sunrise. Five bottles were immediately fixed with Winkler reagents80 (time 0) and 5 other bottles were fixed at the following sunrise (24 h incubation). The dissolved oxygenconcentration was determined as explained above. NCP was estimated by regressing O2 against time.
Statistical analysis.
One-way analysis of variance ANOVA (Statistica 5.0) was performed to evalu-ate differences among trophic status systems. Variance homogeneity was tested with Cochran’s analysis. The Student-Newman-Keuls test (SNK) was used to discriminate among different treatments after a significant F-test. A Mann-Whitney U test was used when the data were not strictly parametric. The regression model type II was used to evaluate the relationship between variables when both variables were subject to measurement error.Received: 21 June 2019; Accepted: 28 October 2019; Published: xx xx xxxx
References
1. González, N., Gattuso, J. & Middelburg, J. Oxygen production and carbon fixation in oligotrophic coastal bays and the relationship with gross and net primary production. Aquat. Microb. Ecol. 52, 119–130 (2008).
2. Bonilla-Findji, O., Gattuso, J.-P., Pizay, M.-D. & Weinbauer, M. G. Autotrophic and heterotrophic metabolism of microbial planktonic communities in an oligotrophic coastal marine ecosystem: seasonal dynamics and episodic events. Biogeosciences 7, 3491–3503 (2010).
3. Regaudie-de-Gioux, A. & Duarte, C. M. Global patterns in oceanic planktonic metabolism. Limnol. Oceanogr. 58, 977–986 (2013). 4. Gattuso, J.-P., Frankignoulle, M. & Wollast, R. Carbon and carbonate metabolism in coastal aquatic ecosystems. Annu. Rev. Ecol.
Syst. 29, 405–434 (1998).
5. Ducklow, H. Microbial services: challenges for microbial ecologists in a changing world. Aquat. Microb. Ecol. 53, 13–19 (2008). 6. del Giorgio, P. A., Cole, J. J. & Cimbleris, A. Respiration rates in bacteria exceed phytoplankton production in unproductive aquatic
systems. Nature 385, 148–151 (1997).
7. del Giorgio, P. A. & Duarte, C. M. Respiration in the open ocean. Nature 420, 379–384 (2002).
8. Azam, F. & Malfatti, F. Microbial structuring of marine ecosystems. Nat. Rev. Microbiol. 5, 782–791 (2007).
9. Santinelli, C., Sempéré, R., Wambeke, F. V., Charriere, B. & Seritti, A. Organic carbon dynamics in the Mediterranean Sea: An integrated study. Glob. Biogeochem. Cycles 26 (2012).
10. Navarro, N., Agustí, S. & Duarte, C. M. & others. Plankton metabolism and dissolved organic carbon use in the Bay of Palma, NW Mediterranean Sea. Aquat. Microb. Ecol. 37, 47–54 (2004).
11. Gazeau, F. et al. Whole-system metabolism and CO2 fluxes in a Mediterranean Bay dominated by seagrass beds (Palma Bay, NW
Mediterranean). Biogeosciences 2, 43–60 (2005).
12. Myklestad, S. M. Dissolved organic carbon from phytoplankton. in Marine Chemistry (ed. Wangersky, P. J.) 111–148 (Springer Berlin Heidelberg, 2000), https://doi.org/10.1007/10683826_5.
13. Nagata, T. Production mechanisms of dissolved organic matter. in Microbial ecology of the oceans 121–152 (Wiley-Liss, 2000). 14. Alonso-Sáez, L. et al. Factors controlling the year-round variability in carbon flux through bacteria in a coastal marine system.
Ecosystems 11, 397–409 (2008).
15. López-Sandoval, D. C. & Fernández, A. & Marañón, E. Dissolved and particulate primary production along a longitudinal gradient in the Mediterranean Sea. Biogeosciences 8, 815–825 (2011).
16. Teira, E., Pazó, M. J., Serret, P. & Fernández, E. Dissolved organic carbon production by microbial populations in the Atlantic Ocean.
Limnol. Oceanogr. 46, 1370–1377 (2001).
17. Cole, J. J., Likens, G. E. & Strayer, D. L. Photosynthetically produced dissolved organic carbon: An important carbon source for planktonic bacteria 1. Limnol. Oceanogr. 27, 1080–1090 (1982).
18. Morán, X. A. G., Estrada, M., Gasol, J. M. & Pedrós-Alió, C. Dissolved primary production and the strength of phytoplankton– bacterioplankton coupling in contrasting marine regions. Microb. Ecol. 44, 217–223 (2002).
19. Baines, S. B. & Pace, M. L. The production of dissolved organic matter by phytoplankton and its importance to bacteria: Patterns across marine and freshwater systems. Limnol. Oceanogr. 36, 1078–1090 (1991).
20. Morán, X. A. G. & Alonso-Sáez, L. Independence of bacteria on phytoplankton? Insufficient support for Fouilland & Mostajir’s (2010) suggested new concept: Bacterioplankton independence on phytoplankton? FEMS Microbiol. Ecol. 78, 203–205 (2011). 21. Fouilland, E. & Mostajir, B. Revisited phytoplanktonic carbon dependency of heterotrophic bacteria in freshwaters, transitional,
coastal and oceanic waters. FEMS Microbiol. Ecol. 73, 419–429 (2010).
22. Gasol, J. M., Vázquez-Domínguez, E., Vaqué, D., Agustí, S. & Duarte, C. M. Bacterial activity and diffusive nutrient supply in the oligotrophic Central Atlantic Ocean. Aquat. Microb. Ecol. 56, 1–12 (2009).
23. del Giorgio, P. A. & Cole, J. J. Bacterial energetics and growth efficiency. in Microbial ecology of the oceans 289–325 (John Wiley & Sons, 2000).
24. del Giorgio, P. A. & Cole, J. J. Bacterial growth efficiency in natural aquatic systems. Annu. Rev. Ecol. Syst. 29, 503–541 (1998). 25. Rivkin, R. B. & Legendre, L. Biogenic carbon cycling in the upper ocean: effects of microbial respiration. Science 291, 2398–2400 (2001). 26. Alonso-Sáez, L. et al. Seasonality in bacterial diversity in north-west Mediterranean coastal waters: assessment through clone
libraries, fingerprinting and FISH. FEMS Microbiol. Ecol. 60, 98–112 (2007).
27. del Giorgio, P. Adel et al. Coherent patterns in bacterial growth, growth efficiency, and leucine metabolism along a northeastern Pacific inshore-offshore transect. Limnol. Oceanogr. 56, 1–16 (2011).
28. Lee, C. W., Bong, C. W. & Hii, Y. S. Temporal variation of bacterial respiration and growth efficiency in tropical coastal waters. Appl
Env. Microbiol 75, 7594–7601 (2009).
29. Gasol, J. M. et al. Towards a better understanding of microbial carbon flux in the sea. Aquat. Microb. Ecol. 53, 21–38 (2008). 30. Jahnke, R. A. & Craven, D. B. Quantifying the role of heterotrophic bacteria in the carbon cycle: A need for respiration rate
measurements. Limnol. Oceanogr. 40, 436–441 (1995).
31. López-Urrutia, Á. & Morán, X. A. G. Resource limitation of bacterial production distorts the temperature dependence of oceanic carbon cycling. Ecology 88, 817–822 (2007).
32. Rochelle-Newall, E. J., Torréton, J.-P., Mari, X. & Pringault, O. Phytoplankton-bacterioplankton coupling in a subtropical South Pacific coral reef lagoon. Aquat. Microb. Ecol. 50, 221–229 (2008).
33. Gillooly, J. F., Brown, J. H., West, G. B., Savage, V. M. & Charnov, E. L. Effects of rize and temperature on metabolic rate. Science 293, 2248–2251 (2001).
34. Brown, J. H., Gillooly, J. F., Allen, A. P., Savage, V. M. & West, G. B. Toward a metabolic theory of ecology. Ecology 85, 1771–1789 (2004). 35. Allen, A. P., Gillooly, J. F. & Brown, J. H. Linking the global carbon cycle to individual metabolism. Funct. Ecol. 19, 202–213 (2005). 36. Céa, B. et al. An annual survey of bacterial production, respiration and ectoenzyme activity in coastal NW Mediterranean waters:
temperature and resource controls. Environ. Sci. Pollut. Res. 22, 13654–13668 (2015).
37. García-Corral, L. S., Martinez-Ayala, J., Duarte, C. M. & Agusti, S. Experimental assessment of cumulative temperature and UV-B radiation effects on Mediterranean plankton metabolism. Front. Mar. Sci. 2, 48 (2015).
38. Gattuso, J.-P., Peduzzi, S., Pizay, M.-D. & Tonolla, M. Changes in freshwater bacterial community composition during measurements of microbial and community respiration. J. Plankton Res. 24, 1197–1206 (2002).
39. Robinson, C. Heterotrophic bacterial respiration. in Microbial Ecology of the Oceans 299–334 (John Wiley & Sons, Ltd, 2008). 40. Carlson, C. A. & Ducklow, H. W. Growth of bacterioplankton and consumption of dissolved organic carbon in the Sargasso Sea.
Aquat. Microb. Ecol. 10, 69–85 (1996).
41. Gasol, J. A framework for the assessment of top-down vs. bottom-up control of heterotrophic nanoflagellate abundance. Mar. Ecol.
Prog. Ser. 113, 291–300 (1994).
42. Calvo-Diaz, A. et al. Decrease in the autotrophic-to-heterotrophic biomass ratio of picoplankton in oligotrophic marine waters due to bottle enclosure. Appl. Environ. Microbiol. 77, 5739–5746 (2011).
43. Wambeke, F., Christaki, U., Giannakourou, A., Moutin, T. & Souvemerzoglou, K. Longitudinal and vertical trends of bacterial limitation by phosphorus and carbon in the Mediterranean Sea. Microb. Ecol. 43, 119–133 (2002).
44. Eissler, Y. & Quiñones, R. A. The effect of viral concentrate addition on the respiration rate of Chaetoceros gracilis cultures and microplankton from a shallow bay (Coliumo, Chile). J. Plankton Res. 25, 927–938 (2003).
45. Massana, R., Pedrόs-Aliό, C., Casamayor, E. O. & Gasol, J. M. Changes in marine bacterioplankton phylogenetic composition during incubations designed to measure biogeochemically significant parameters. Limnol. Oceanogr. 46, 1181–1188 (2001).
46. Neogi, S. B. et al. Biogeochemical controls on the bacterial populations in the eastern Atlantic Ocean. Biogeosciences 8, 3747–3759 (2011). 47. Serret, P., Fernández, E., Sostres, J. & Anadón, R. Seasonal compensation of microbial production and respiration in a temperate sea.
Mar. Ecol. Prog. Ser. 187, 43–57 (1999).
48. Goldman, J. C., McCarthy, J. J. & Peavey, D. G. Growth rate influence on the chemical composition of phytoplankton in oceanic waters. Nature 279, 210 (1979).
49. Agustí, S. & Duarte, C. M. Strong seasonality in phytoplankton cell lysis in the NW Mediterranean littoral. Limnol. Oceanogr. 45, 940–947 (2000).
50. Copin-Montégut, G. & Avril, B. Vertical distribution and temporal variation of dissolved organic carbon in the North-Western Mediterranean Sea. Deep Sea Res. Part Oceanogr. Res. Pap. 40, 1963–1972 (1993).
51. Céline, F. et al. The accumulation and release of polysaccharides by planktonic cells and the subsequent bacterial response during a controlled experiment. FEMS Microbiol. Ecol. 29, 351–363 (1999).
52. Thingstad, T. F., HagstrÖm, Å. & Rassoulzadegan, F. Accumulation of degradable DOC in surface waters: Is it caused by a malfunctioning microbial loop? Limnol. Oceanogr. 42, 398–404 (1997).
53. Carvalho, M. C., Schulz, K. G. & Eyre, B. D. Respiration of new and old carbon in the surface ocean: Implications for estimates of global oceanic gross primary productivity. Glob. Biogeochem. Cycles 31, 975–984 (2017).
54. Eyre, B. D. & Ferguson, A. J. P. Comparison of carbon production and decomposition, benthic nutrient fluxes and denitrification in seagrass, phytoplankton, benthic microalgae- and macroalgae-dominated warm-temperate Australian lagoons. Mar. Ecol. Prog. Ser.
229, 43–59 (2002).
55. Barron, C., Apostolaki, E. T. & Duarte, C. M. Dissolved organic carbon fluxes by seagrass meadows and macroalgal beds. Front. Mar.
Sci. 1 (2014).
56. Barrón, C. & Duarte, C. M. Dissolved organic matter release in a Posidonia oceanica meadow. Mar. Ecol. Prog. Ser. 374, 75–84 (2009). 57. Duarte, C. M., Regaudie-de-Gioux, A., Arrieta, J. M., Delgado-Huertas, A. & Agustí, S. The oligotrophic ocean is heterotrophic.
Annu. Rev. Mar. Sci. 5, 551–569 (2013).
58. Lemée, R. et al. Seasonal variation of bacterial production, respiration and growth efficiency in the open NW Mediterranean Sea.
Aquat. Microb. Ecol. 29, 227–237 (2002).
59. Apple, J. K., del Giorgio, P. A. & Kemp, W. M. Temperature regulation of bacterial production, respiration, and growth efficiency in a temperate salt-marsh estuary. Aquat. Microb. Ecol. 43, 243–254 (2006).
60. Buitenhuis, E. T. et al. Picophytoplankton biomass distribution in the global ocean. Earth Syst. Sci. Data 4, 37–46 (2012). 61. Navarro, G., Alvain, S., Vantrepotte, V. & Huertas, I. E. Identification of dominant phytoplankton functional types in the
Mediterranean Sea based on a regionalized remote sensing approach. Remote Sens. Environ. 152, 557–575 (2014).
62. Calvo-Díaz, A. & Morán, X. A. G. Empirical leucine-to-carbon conversion factors for estimating heterotrophic bacterial production: Seasonality and predictability in a temperate coastal ecosystem. Appl Env. Microbiol 75, 3216–3221 (2009).
63. Teira, E. et al. Local differences in phytoplankton-bacterioplankton coupling in the coastal upwelling off Galicia (NW Spain). Mar.
64. Trabelsi, A. & Rassoulzadegan, F. Effect of bacterial community dynamics on DOC seasonal changes in the north-western Mediterranean Sea. J. Plankton Res. 33, 1249–1262 (2011).
65. Robinson, C. & Williams, P. le B. Respiration and its measurement in surface marine waters. in Respiration in aquatic ecosystems 147–180 (Oxford University Press, 2005).
66. Kritzberg, E., Arrieta, J. & Duarte, C. Temperature and phosphorus regulating carbon flux through bacteria in a coastal marine system. Aquat. Microb. Ecol. 58, 141–151 (2010).
67. Huete-Stauffer, T. M., Arandia-Gorostidi, N., Díaz-Pérez, L. & Morán, X. A. G. Temperature dependences of growth rates and carrying capacities of marine bacteria depart from metabolic theoretical predictions. FEMS Microbiol. Ecol. 91, fiv111 (2015). 68. Morán, X. A. G. et al. Temperature regulation of marine heterotrophic prokaryotes increases latitudinally as a breach between
bottom-up and top-down controls. Glob. Change Biol. 23, 3956–3964 (2017).
69. Mazuecos, I. P. et al. Temperature control of microbial respiration and growth efficiency in the mesopelagic zone of the South Atlantic and Indian Oceans. Deep Sea Res. Part Oceanogr. Res. Pap. 95, 131–138 (2015).
70. Yvon-Durocher, G. & Allen, A. P. Linking community size structure and ecosystem functioning using metabolic theory. Philos.
Trans. R. Soc. Lond. B Biol. Sci. 367, 2998–3007 (2012).
71. Morán, X. A. G., Calvo-Díaz, A., Arandia-Gorostidi, N. & Huete-Stauffer, T. M. Temperature sensitivities of microbial plankton net growth rates are seasonally coherent and linked to nutrient availability. Environ. Microbiol. 20, 3798–3810 (2018).
72. Arandia-Gorostidi, N., Huete-Stauffer, T. M., Alonso-Sáez, L. & Morán, X. A. G. Testing the metabolic theory of ecology with marine bacteria: different temperature sensitivity of major phylogenetic groups during the spring phytoplankton bloom. Environ.
Microbiol. 19, 4493–4505 (2017).
73. Vaquer-Sunyer, R. et al. Dissolved organic nitrogen inputs from wastewater treatment plant effluents increase responses of planktonic metabolic rates to warming. Environ. Sci. Technol. 49, 11411–11420 (2015).
74. Veuger, B. et al. Microbial uptake of dissolved organic and inorganic nitrogen in Randers Fjord. Estuar. Coast. Shelf Sci. 61, 507–515 (2004).
75. Barranguet, C. The role of microphytobenthic primary production in a Mediterranean mussel culture area. Estuar. Coast. Shelf Sci.
44, 753–765 (1997).
76. Gasol, J. M. & del Giorgio, P. A. Using flow cytometry for counting natural planktonic bacyeria and understanding the structure of planktonic bacterial communities. Sci. Mar. 64, 197–224 (2000).
77. Zubkov, M. V., Sleigh, M. A. & Burkill, P. H. Assaying picoplankton distribution by flow cytometry of underway samples collected along a meridional transect across the Atlantic Ocean. Aquat. Microb. Ecol. 21, 13–20 (2000).
78. Marañón, E., Cermeño, P. & Pérez, V. Continuity in the photosynthetic production of dissolved organic carbon from eutrophic to oligotrophic waters. Mar. Ecol. Prog. Ser. 299, 7–17 (2005).
79. Nielsen Steeman, E. The use of radio-active carbon (14C) for measuring organic production in the sea. J Cons Perm Int Explor Mer
18, 117–140 (1952).
80. Carpenter, J. H. The accuracy of the Winkler method for dissolved oxygen analysis. Limnol. Oceanogr. 10, 135–140 (1965). 81. Smith, D. C. & Azam, F. A simple, economical method for measuring bacterial protein synthesis rates in seawater using 3H-leucine.
Mar Microb Food Webs 6, 107–114 (1992).
82. Kemp, P. F., Cole, J. J., Sherr, B. F. & Sherr, E. B. Handbook of methods in aquatic microbial ecology. (CRC Press, 1993).
Acknowledgements
Many individuals contributed to the successful completion of the field work, in particular the skippers and crew of the research boats. The CTD data were provided by C. Heyndrickx and the SOMLIT program. The two sampled regions maps were kindly provided by P. Vandromme and F. Gazeau. This research was supported by the European Union in the framework of the EUROTROPH project (contract # EVK3-CT-2000-00040) and N. González-Benítez was supported by a Marie Curie individual fellowship (MCFI-2001-01425). Additional support was provided by The Netherlands Organisation for Scientific Research (Dutch-French co-operation on sea research programme). L.S. García-Corral was supported by a Juan de la Cierva fellowship from the Spanish Ministry of Science, Innovation and Universities.
Author contributions
N.G.-B. conducted the field and lab work, did analysis and led article preparation; L.S.G.-C. contributed to data analysis and writing the article; X.A.G.M., J.M., M.D.P. and J.P.G. provided project support and contributed to editing. All authors reviewed the manuscript.
competing interests
The authors declare no competing interests.
Additional information
Supplementary information is available for this paper at https://doi.org/10.1038/s41598-019-53650-z. Correspondence and requests for materials should be addressed to N.G.-B.
Reprints and permissions information is available at www.nature.com/reprints.
Publisher’s note Springer Nature remains neutral with regard to jurisdictional claims in published maps and institutional affiliations.
Open Access This article is licensed under a Creative Commons Attribution 4.0 International License, which permits use, sharing, adaptation, distribution and reproduction in any medium or format, as long as you give appropriate credit to the original author(s) and the source, provide a link to the Cre-ative Commons license, and indicate if changes were made. The images or other third party material in this article are included in the article’s Creative Commons license, unless indicated otherwise in a credit line to the material. If material is not included in the article’s Creative Commons license and your intended use is not per-mitted by statutory regulation or exceeds the perper-mitted use, you will need to obtain permission directly from the copyright holder. To view a copy of this license, visit http://creativecommons.org/licenses/by/4.0/.