Disruptions in the Sports Content Delivery Value Chain due to
Consuming Sports Content over the Internet
bMASSACHUSETTS INSTITUTE
by OF TECHNOLOGY
Halil Kiper
JUN 2
3
2016
M.S. Electrical Engineering
The Ohio State University, 2000
LIBRARIES
ARCHIVES
Submitted to the System Design and Management Programin Partial Fulfillment of the Requirements for the Degree of
Master of Science in Engineering and Management at the
Massachusetts Institute of Technology
November 2013 rtA ko r Zo 1 02013 Halil Kiper. All rights reserved.
The author hereby grants to MIT permission to reproduce and to distribute publicly paper and electronic copies of this thesis document in whole or in part in any medium now known or
hereafter cxeated.
Signature redacted
Signature of Author:
y m aHalil Kiper
A SystemDesign adManagement Program
Signature redacted
Certified by:Charles Fine Chrysler Leaders for Global Operations Professor of Management Professo f Operations Management and Engineering Systems
1 ) _(-j< T j sis Supervisor
A
Signature redacted
Accepted by: -PtikHl
10 Patrick Hale
Director System Design and Management Program
Disruptions in the Sports Content Value Chain due to Consuming Sports Content over the Internet
by
Halil Kiper
Submitted to the Engineering Systems Division In partial fulfillment of the requirements for the degree of
Master of Science in Engineering and Management
ABSTRACT
A major component of the highly lucrative sports business is the content delivery value
chain consisting of a number of players including the content creators - sports leagues; content
aggregators - TV networks; content distributors - pay TV providers; advertisers - one of the
main financiers in the value chain; and consumers. The relationships between the value chain players have been both cooperative and competitive, especially when the borders separating them became less defined due to backward and forward integration efforts of players. With the advancements in Internet content delivery and electronic devices, a new form of sports content consumption has emerged that has the potential to re-define the borders between the value chain players and to disrupt the industry. This new form of sports content consumption is Sports over IP (SpoIP, sports content consumption over the Internet). This thesis lays out four different scenarios about how the SpoIP disruption could play out in the value chain. It uses information from similar disruption in other industries and system dynamics modeling to present the ramification and likelihood of each scenario. This work predicts that the consumers will be the winner of SpoIP disruption because they will have access to good quality and cheaper sports content going forward.
Table of Contents
A BSTRACT ... 3
List of Figures ... 6
List of Tables... 8
Acknow ledgm ents ... 9
Chapter 1: Introduction ... 10
Chapter 2: M otivation ... 13
Chapter 3: M ethodology... 14
Chapter 4: Football Content Delivery... 16
4.1 The Business Ecosystem ... 16
4.2 NFL M odel... 17
4.2.1 NFL Stadium Revenue ... 18
4.2.2 NFL N etwork (NFLN) Revenue ... 20
4.2.3 NFL Content Rights Revenue ... 23
4.3 ESPN M odel... 24
4.3.1 ESPN Advertising Revenue from Football...25
4.3.2 ESPN Affiliate Fee Revenue from Football...27
4.4 Com cast M odel... 29
4.4.1 Com cast Subscriber Revenue from Football...30
4.4.2 Com cast Ad Revenue from Football...31
4.5 Consum er M odel... 33
4.6 Sum m ary of Sports Content Delivery Ecosystem Revenues ... 34
Chapter 5 SpoIP Disruption Hypothesis Generation...37
5.1 Voice over IP and the Telecom m unication Industry:... 37
5.2 Books over IP and the Publishing Industry:... 39
5.3 M usic over IP and the Recording Industry: ... 40
5.4 News over IP and the Newspaper Industry: ... 41
5.5 TV Shows over IP and the Television Industry: ... 43
5.6 Sum m ary of XoIP Effects on the Investigated Industries: ... 45
5.7 Hypotheses about Sports over Internet and the Sports Industry: ... 46
Chapter 6 SpoIP Hypotheses Tests and A nalyses... 51
6.1 H ypothesis 1 (H1 ) - Content Creator (NFL) is King ... 51
6.1.1 H i - Hypothesis Driven Assum ptions ... 52
6.1.2 H 1- Assumption Driven Sim ulations... 53
6.1.3 Feasibility of H 1 ... 57
6.2 H ypothesis 2 (H 2) - Content Aggregator (ESPN) is King ... 58
6.2.1 H2- Hypothesis Driven Assum ptions ... 58
6.2.2 H2- Assum ption Driven Sim ulations... 59
6.2.3 Feasibility of H2 ... 63
6.3 H ypothesis 3 (H3) - Content Distributor (Com cast) is King... 64
6.3.1 H3- Hypothesis Driven Assum ptions ... 64
6.3.3 Feasibility of H3 ... 69
6.4 H ypothesis 4 (H4) - Content Consum er is King ... 69
6.4.1 H4- Hypothesis Driven A ssum ptions ... 70
6.4.2 H4- A ssum ption Driven Sim ulations... 71
6.4.3 Feasibility of H4...74
Chapter 7: Conclusions and Suggested Future Work... 75
7.1 Conclusions...75
7.2 Suggested Future W ork... 76
Appendix...78
A .1 NFL system dynam ics m odel equations... 78
A .2 ESPN system dynam ics m odel equations... 79
A .3 Com cast system dynam ics m odel equations... 79
A .4 Consum er system dynam ics m odel equations ... 80
List of Figures
Figure 1.1: Sports content delivery ecosystem... 12
Figure 3.1: R esearch m ethodology. ... 14
Figure 4.1: Football content delivery ecosystem... 16
Figure 4.2: Football content delivery ecosystem value chain dynamics... 17
Figure 4.3: NFL System Dynamics model... 18
Figure 4.4: N FL stadium revenue... 19
Figure 4.5: Model output: Demand of live performance... 20
Figure 4.6: N FL N etw ork revenue... 21
Figure 4.7: Model output: NFLN subscription revenue... 22
Figure 4.8: Model output: NFLN ad revenue ... 22
Figure 4.9: NFL content rights revenue... 23
Figure 4.10: Model output: NFL content rights revenue split between sources... 24
Figure 4.11: ESPN System Dynamics model... 25
Figure 4.12: ESPN advertising revenue from football... 26
Figure 4.13: Model output: ESPN advertising revenue from football. ... 27
Figure 4.14: ESPN affiliate fee revenue from football... 28
Figure 4.15: Model output: ESPN affiliate fee revenue from football... 28
Figure 4.16: Comcast System Dynamics model... 29
Figure 4.17: Comcast subscriber revenue form football... 30
Figure 4.18: Model output: Comcast subscriber revenue from football... 31
Figure 4.19: Comcast ad revenue from football... 32
Figure 4.20: Model output: Comcast ad revenue from football... 32
Figure 4.21: Consumer spending System Dynamics model... 33
Figure 4.22: Model output: Consumer spending ... 34
Figure 6.1: Structure to test SpoIP hypotheses. ... 51
Figure 6.2: NFL revenues: baseline vs. H 1... 53
Figure 6.3: ESPN revenues: baseline vs. HI. ... 54
Figure 6.4: Comcast revenues: baseline vs. H1... 54
Figure 6.5: Consumer spending: baseline vs. HI... 55
Figure 6.6: Value chain player revenues: baseline vs. H1. ... 56
Figure 6.7: Consumer spending: baseline vs. HI... 56
Figure 6.8: NFL revenues: baseline vs. H2... 59
Figure 6.9: ESPN revenues: baseline vs. H2. ... 60
Figure 6.10: Comcast revenues: baseline vs. H2... 61
Figure 6.11: Comcast spending: baseline vs. H2. ... 61
Figure 6.12: Value chain player revenues: baseline vs. H2 ... 62
Figure 6.13: Consumer spending: baseline vs. H2. ... 62
Figure 6.14: NFL revenues: baseline vs. H3... 65
Figure 6.15: ESPN revenues: baseline vs. H3 ... 66
Figure 6.16: Comcast revenues: baseline vs. H3... 66
Figure 6.17: Consumer spending: baseline vs. H3. ... 67
Figure 6.19: Consumer spending: baseline vs. H3. ... 68
Figure 6.20: NFL revenues: baseline vs. H4... 71
Figure 6.21: ESPN revenues: baseline vs. H4... 71
Figure 6.22: Comeast revenues: baseline vs. H4... 72
Figure 6.23: Consumer spending: baseline vs. H4. ... 72
Figure 6.24: Value chain player revenues: baseline vs. H4 ... 73
List of Tables
Table 4.1: Value chain player revenues in 2012... 35
Table 4.1: NFL revenue streams in 2012 ... 35
Table 4.2: ESPN revenue streams in 2012 ... 35
Table 4.3: Comcast revenue streams in 2012 ... 35
Table 4.4: Consumer spending in 2012 ... 36
Table 5.1: Shift in value capture in the telecommunication industry due to VoIP. ... 37
Table 5.2: Shift in value capture in the publishing industry due to BoIP. ... 39
Table 5.3: Shift in value capture in the music industry due to MoIP ... 40
Table 5.4: Shift in value capture in the newspaper industry due to NoIP... 43
Table 5.5: Shift in value capture in the television industry due to ToIP ... 44
Table 5.6: Shift in value capture in all analyzed industries due to the Internet. ... 46
Table 5.7: Shift in value capture in the sports industry based on hypotheses H1, 2, 3, and 4... 50
Table 6.1: Shift in value capture based on HI. ... 52
Table 6.2: Shift in value capture based on H2. ... 58
Table 6.3: Shift in value capture based on H3. ... 64
Table 6.4: Shift in value capture based on H4. ... 70
Acknowledgments
First, I would like to acknowledge the opportunity and guidance given to me by my research advisor, Professor Charles Fine. Thank you for letting me work on this fascinating project and for letting me join your team in the MIT Communication Futures Program (CFP). Your support and guidance helped me immensely during my work.
In addition to Prof. Fine, I want to acknowledge the following CFP members: Chintan Vaishnav, Sergey Naumov, Natalie Klym, and Henry Holtzman from MIT; Terri Swartz and Rob Hunter from ESPN; and John Cate from American Music Partners. The discussions I had with these experts were very valuable for my research.
I must thank my family members for their support during my studies at MIT. They
believed in the benefits of taking a break from my career and going back to school to learn. I am grateful for their encouragement and support.
Finally, I would like to extend my appreciation to MIT's System Design and Management Program leadership and staff members. Thank you for helping me make the most of my time in the program.
Chapter 1: Introduction
The sports industry in the U.S. is one of the most lucrative ones, generating revenues for a number of players in the sports ecosystem. According to [1], the U.S. sports market in 2012 is estimated to be $400 to $450 billion. These revenues come form a broad spectrum of sources including ticket sales, content rights, licensed products, sports video games, collectibles, sporting
goods, sports-related advertising, endorsement income, stadium naming fees, and facilities income.
The four big leagues in the U.S., the National Football League (NFL), National
Basketball Association (NBA), National Hockey League (NHL), and the Major League Baseball (MLB) earned about $25.6 billion in revenue in 2011 [2]. NFL earned the most with $11 billion, followed by MLB, NBA, and NHL with $7 billion, $4.3 billion, and $3.3 billion, respectively. As mentioned in [3], professional teams have started to rely less on tickets sales and more on selling their content rights to generate income.
TV networks, such as ESPN, CBS, Fox, and NBC as well as pay TV providers, such as DirecTV, Time Warner Cable, and Comcast buy content rights from leagues and broadcast them after adding their own complementary programming. These complementary programming include video and audio capture of games, commentaries, previews, feature stories, reality shows, and documentary shows. One popular complementary programming offered by ESPN is SportsCenter [4], which is a daily sports news television show that has existed since the launch of the network in 1979. The show broadcasts news about sports events, some of which with certain restrictions. For example, NFL does not allow in-progress highlights outside of its own life games broadcasts. Other examples of complementary sports programming are Fox Sports1
between leagues and networks/pay TV providers for content rights. For example [7], ESPN paid
the NFL $15.2 billions for a 10-year content right deal starting in 2011. CBS/Fox/NBC paid the
NFL $28 billions for a 9-year deal starting in 2011. The ESPN deal amounts to a 73% increase
and the CBS/Fox/NBS deal amounts to a 63% increase from previously made deals. Therefore, the content right fees are not only very high, but they are also increasing sharply. Currently, this
trend is mostly benefiting the leagues and hurting the networks, pay TV providers, and the
consumers. Networks and pay TV providers absorb part of the increased fee and pass on the rest
down the value chain towards the consumers and advertisers. According to [8], sports channels
account for about 40% of the cable TV fees, explaining partly why sports programming is so
important to pay TV providers and why consumers have to pay more and more for subscription.
Leagues, TV networks, and pay TV providers sponsor part of their operations with high
valued advertising deals. Such deals are signed with advertising agencies or directly with
companies whose products appeal to the demographic that watches sports. Examples of such
companies are Nike, Adidas, Reebok, PepsiCo, and General Motors, marketing products ranging
from sport apparel and drinks to vehicles. Although these players are integral part of the value
chain, they are excluded form the presented study to limit the scope. Advertisers are considered
sources of revenue for various value chain players without talking about how advertisers
generate their own income.
This thesis presents the research conducted to analyze and predict future disruptions in
the sports content delivery value chain, which is depicted in Figure 1.1, due to consuming sports
content over the Internet. Throughout the thesis, such consumption is also called SpoIP (Sports
The remaining parts of the thesis are organized as follows: Chapter 2 talks about the
motivation of this research followed by the methodology used in Chapter 3. Chapter 4 presents
the details of the sports content delivery value chain and the introduction of the System
Dynamics model used in the research. Chapter 5 offers insights about how the hypotheses used in the study have been developed. Chapter 6 presents the results and discussions of the analysis
performed via simulations and finally Chapter 7 provides the conclusion and suggested future work.
content revenue
League TV Networks Pay sV Consumers
AdvertisersOl Oe
Chapter 2: Motivation
Owing to the advances in content delivery over the Internet and electronics devices
enabling the consumption of such content, the concept of consuming sports content over the
Internet has been an interesting topic to study. The popularity of sports, the tension between the
value chain players, and the gradual increase in cost of accessing and broadcasting the content
make it very likely that SpoIP will disrupt the industry. This disruption may occur by changing
the existing value chain and forcing all players to modify their strategies or exit the market. The
big question, however, is how this disruption will play out. Studying and understanding the
disruptions will come with the benefit of gaining more insights about this fascinating topic, but
more importantly it has implications on the future dynamics of one of the most lucrative
industries in the U.S. - the sports industry that generated about $400 billion in yearly revenue in 2012 [1].
Chapter 3: Methodology
As of the writing of this thesis, it was still unknown how the disruption in the sport
content value chain due to SpoIP will play out. The effects of the disruptions had started but not settled. Due to this still ongoing process, a hypothesis driven approach was taken in the presented work. The approach is summarized in Figure 3.1.
Develop System Develop Test hypotheses,
Dynamics model hypotheses about analyze results,
of sports content how SpoIP may synthesize
delivery value disrupt the value conclusions
> chDin
chain
Figure 3.1: Research methodology.
First, a System Dynamics [9] model was developed to build a simulation platform that is used to test the hypotheses developed in subsequent steps. The model uses revenue as a quantifiable metric to define success. The model was calibrated so that past and present performance of value chain players is matched to publicly available data. Performance drivers were identified and added to the model to create connections between SpoIP and future performance. Assumptions made for future behavior are discussed in corresponding sections that are dedicated to the details of the model.
Second, four hypotheses were developed each representing a different outcome of the SpoIP disruption. The hypotheses were conceived as a result of studying Internet related disruptions in other industries, including music, publishing, TV, newspaper, and telephony.
Third, each of the four hypotheses was tested with the System Dynamics model. The
simulation results were analyzed and the conclusions were synthesized. Afterwards, the feasibility of each scenario and outcome were discussed to determine the one that will most
likely occur.
In order to limit the scope of this work, only (American) football related revenues of four specific value chain players, namely NFL, ESPN, Comcast, and the Consumer are considered.
Therefore, the revenues presented in this work do not amount to the total revenue of the industry, but merely a subset of the revenues that is more likely to be affected by SpoIP.
Chapter 4: Football Content Delivery
4.1 The Business Ecosystem
The ecosystem used for the study in this work in seen in Figure 4.1 where individual
players and the flow of revenue and content are shown. Revenues as a financial metric are used
to quantify the effects of SpoiP. Therefore, revenue sources that are likely to be affected by
sports content consumption over the Internet are used in the model and analyses.
content revenue
4-League" Networks with Pay TVCosmr
NLag ; Content Rights; Providers;Cnsm s
ESPN Comcast
Advertisers; Nike
Figure 4.1: Football content delivery ecosystem.
To limit the scope of the study only football related revenues of four specific value chain
players are considered. These value chain players are NFL, ESPN, Comcast, and the Consumer.
NFL
rabid fans dmand for SadiuI NFL Stadium
rabid fan live performance C\
Revenue creating NFL NFL Network
rateReeu(1)
Fcuec+ Pay TV I FL Revenue Revenue (lP) Cons
L causal dei iand IfOr dmd N rkSpen
popularity fans ido demand Network ESPN Affiliate Fee + fan Re u Revenue (IP)
creating demand N I L Content
+ rate No f NFL k ights C oncast & other
p ta\i ts pay TV Subscriber potential Games on Rerenue+ Revenue
fans NFL+ +Renu
Network No of Star +
Players
+ JSPN Affiliate + omCast Subscriber Fee Revenue Revenue
No of NFL ESPN NoofNFL Comcas
Games on demand for Revenue Games on Rev nue
E N \ideo Co cast dIemnd for
video
[ESPN Ad Comcast Ad
+ Revenue +Revenue
Figure 4.2: Football content delivery ecosystem value chain dynamics.
I
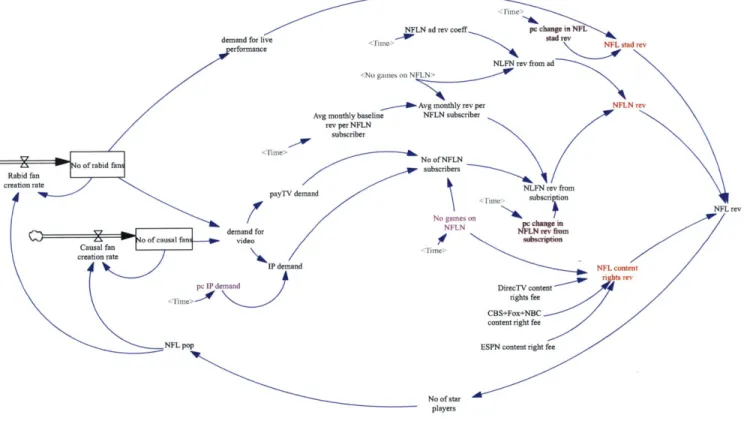
4.2 NFL Model
The NFL System Dynamics model is shown in Figure 4.3. Three revenue sources are
considered: Stadium revenues, NFL Network (NFLN) revenues, and content rights revenues.
There are of course other NFL revenue sources, such as stadium naming fees, licensed products, sports video games, etc.; however, to limit the scope of the study, it is assumed that SpoIP does
not affect these revenue sources.
umer ding
The three NFL revenue sources are explained in more detail in the following three
sub-sections.
NFLN ad rev coeff__ p, change in NFL
demand for live tad r
erformanceI1w
NLFN rev from ad
Avg monthly rev per Ni I N
Avg monthly baseline NFLN subscriber
rev per NFLN subscriber
No ofNFLN Rabid fan o of rabid fan
creation ra payTV demand NLFN rev from
usr o NFL rev N it on pc change in
demand for NFLN rev from
o of causol fan - video subscription
Causal fan I
creation rote d4t
IP demnand
c III demiand DirecTV content
rights fee CBS-Fox-NBC content right fee
NFL pop ESPN content right fee
No of star players
Figure 4.3: NFL System Dynamics model.
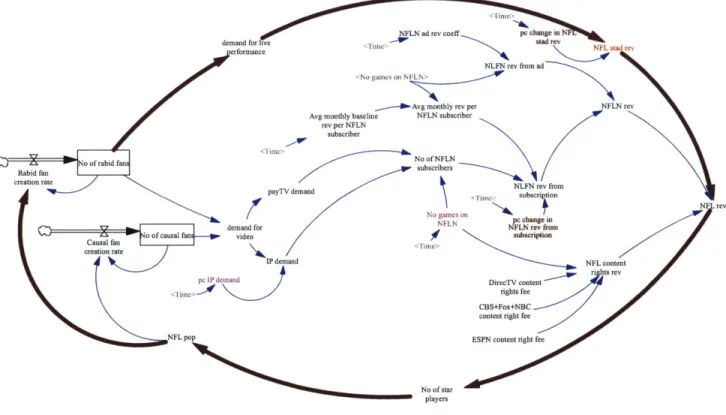
4.2.1 NFL Stadium Revenue
NFL stadium revenue is composed of ticket sales and other income generated during
games in stadiums, such as from parking, food, and apparel. This revenue stream (NFL stad rev
in Figure 4.4) is modeled as a multiplication of demandfor live performance and $100, which is
the assumed average revenue generated by each stadium attendee. Parameter demandfor live
performance is driven by the number of rabid fans, which in turn, is a stock driven by the Rabid
the model), which is set by number of star players. Number of start players is driven by NFL
revenue, closing the system dynamics loop shown in Figure 4.4 with bold arrows.
demand for liv erformance
NLFN rev from ad
Avg morthly rev per NFLN rev
Avg monthly baseline NFLN subscriber
rev per NFLN subscriber
NoofNFLN
Rabid fai No of rabid fan subscribers
creation rate
'Wan payTV demand NLFN rev from
(
m iccnibpc change idemand for N it goNFba re m
Caursal fair oaf causal fan video subscripion
creation rate
IP demand NFL content
une e Direngh scontent t e
CBS+Fox+NBC
content right fee
NFL pop ESPN content right fee
No of star ''- players
Figure 4.4: NFL stadium revenue.
Demandfor live performance is calibrated to match the past data in [10] and its future
behavior is assumed to follow an S-curve. The model output for this parameter is shown in
Figure 4.5 for the baseline (BL, a.k.a. no SpoIP) case, presenting the total number of stadium
attendance in one year across all stadiums in the US.
The average revenue per NFL stadium attendee is derived from the fan cost index data
presented in [11] and [12] and it is fixed at $100 in this study.
19
NF rev
demand for live performance 30 M 25M 20 M 15 M 2008 2010 2012 2014 2016 2018 2020 2022 Time (Year) demand for live performance : BL
Figure 4.5: Model output: Demand of live performance.
According to the data in [13], the average stadium capacity is approximately 70,000.
Therefore, a saturation function is implemented in NFL stad rev to simulate this limitation on the
number of stadium attendees.
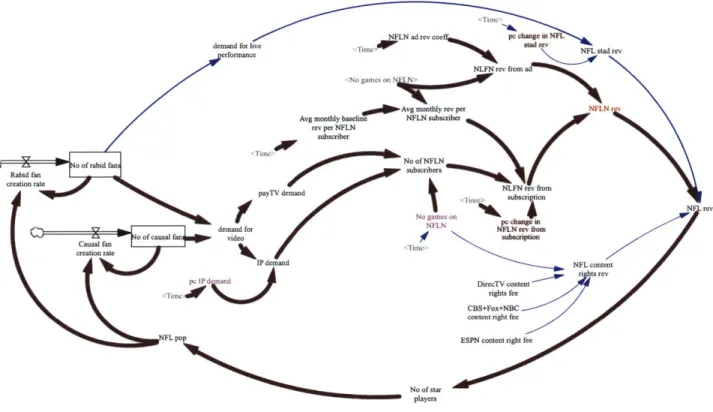
4.2.2 NFL Network (NFLN) Revenue
NFL Network is NFL's broadcast branch [14], offering sports programing dedicated to its
content. It can be viewed as a competitor and complementor to similar sports networks, such as
ESPN. This revenue stream (NFLN rev in Figure 4.6) is modeled as an addition of NFLN
NFLN adre vcoe,,,, p change in NFL
demand for live sad re NFL stad rev
erfNortaance
NLFN rev from ad
NN
0a0dAvg monthly rev perdN Avg monthly baseline NFLN subscriber
rev per NFLN subscriber
crea o o f rabid fN o ofN
pubayiers
Friu rae4.:NLNtokrvne
payTV demand NLFN rev from
r v subscription b o r
demand~~N evfo roevL
Cpa, o fando of causal fans aderoei t s ir to
BothonIP demand NFL cont N d
B D ire cxt c o n te g m
t r e v
content right fee
NFL pop ESPN content right fee
No of star players
Figure 4.6: NFL Network revenue.
The system dynamics loop for NFLN rev is shown with bold arrows in Figure 4.6. NFL
revenues drives no of star players, which in turn drives NFL popularity. As NFL becomes more popular, more and more rabid and causal fans are created, driving the desire to watch NFL games in video format (modeled with parameter demandfor video). Demandfor video is divided into demand for watching on the Internet (IP demand) and for watching via pay-TV (payTV demand). Both demand parameters, together with the number of NFL games shown on NFLN, drive the number of NFLN subscriber. Number of NFLN subscriber and the average monthly revenue per
NFLN subscriber - which is also a function of number of games on NFLN - set the revenue from NFLN subscription (NFLN revfrom subscription), which is calibrated to data provided in [ 15 ] to
match past trends. Future behavior is modeled with an S-curve. Figure 4.7 shows the model
output of this parameter.
0
NLFN rev from subscription
2B 1.5 B lB 500M 0 2008 2010 2012 2014 2016 Time (Year) 2018 2020 2022
NLFN rev from subscription : BL
Figure 4.7: Model output: NFLN subscription revenue.
NLFN rev from ad
2012 2014 2016
Time (Year)
2018 2020 2022
NLFN rev from ad: BL
Figure 4.8: Model output: NFLN ad revenue.
Ad revenues are based on historical data given in [15] and number of NFL games on NFLN. Future behavior is modeled so that ad revenues changes in proportion to the number of NFL games shown on NLFN. The model output of this parameter is shown in Figure 4.8.
300 M 225 M 150 M 75 M 0 20 08 2010
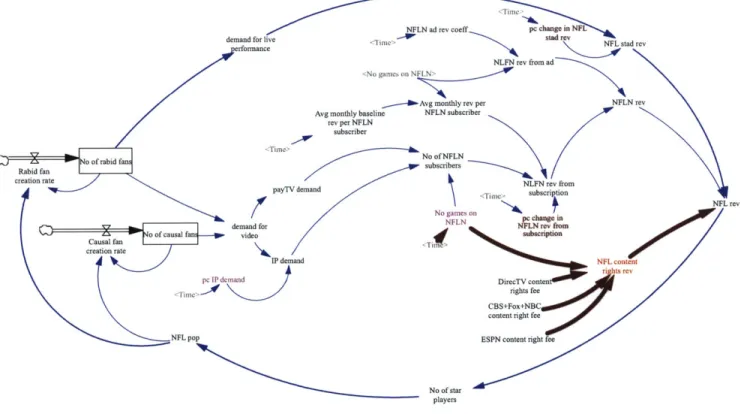
4.2.3 NFL Content Rights Revenue
Among the revenue sources investigated in this work, content rights amounts to the
largest one for NFL as of 2013. NFL gains income from this revenue source by selling the rights
of its content (games) to networks. The model of this revenue source is shown in Figure 4.9 with
bold arrows.
demand for live
erformance \ne s
NLFN rev frot ad
rvgo mc ot N
Avg monthly rev per NFLN rev
Avg monthly baseline NFLN subscriber
rev per NFLN subscriber
o of rabid fan NoofNFLN
Rabi fansubscribers creation rare payTV demanddemnd 11m, surbscriptionFLre No k m atNF e demand for NL e o
Causal far o0 of causal fan video subscription
creation rate\A h IPdemand
1w I'd-DirecTV conitent
CBS+Fox+NBC
content right fee
NFL pop ESPN content ght fee
No of star players
Figure 4.9: NFL content rights revenue.
The revenue stream is modeled as the addition of the rights revenues obtained from
DirecTV, CBS + Fox + NBC, and ESPN. Due to the contractual nature of this revenue source, it
is not directly driven by NFL popularity and it is kept outside the causal loop driven by NFL
games on NFLN (the games shown on NFLN are not shown on any of these networks). The
model is calibrated to fit the data presented in [16] and [7] and the outputs are shown in Figure
4.10.
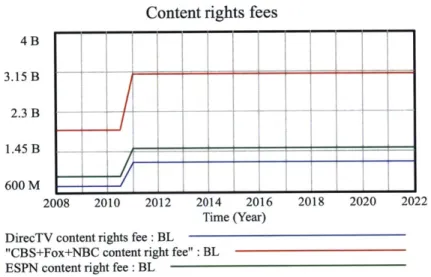
Content rights fees
4 B 3.15 B 2.3 B 1.45 B 600 M 2008 2010 2012 2014 Tim DirecTV content rights fee : BL
"CBS+Fox+NBC content right fee" : BL
ESPN content right fee : BL
2016 2018 2020 2022
e (Year)
Figure 4.10: Model output: NFL content rights revenue split between sources.
4.3 ESPN Model
The next value chain player in the sports content consumption ecosystem is the cable TV
network that owns the content rights of NFL games. In this study, a popular network, ESPN [18],
is studied. ESPN is an American cable TV network that focuses on sports-related programing.
The System Dynamics model for ESPN is shown in Figure 4.11. The revenue sources are
divided into advertising revenues and affiliate fee revenues.
24
I
H-vgc change in SPN a iliate fee rev aliime IC affiite ee Iev
I P demand payTV demand
No of NFL gaiEs
Time on ESPN ESPN rev
LS1PN ad re\
ESPN baseline ad rev
Figure 4.11: ESPN System Dynamics model.
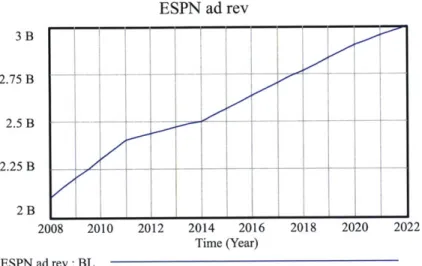
4.3.1 ESPN Advertising Revenue from Football
Advertising revenues come from ad agencies or directly from companies promoting their products on ESPN channels. Figure 4.12 emphasizes the ad related portion of the model with bold arrows. Ad related revenue is driven by No of NFL games on ESPN and by a baseline ad revenue parameter that is used to calibrate the model to past data. For consistency, only football related revenues are considered and they are assumed to be 60% of the total ESPN revenues. The approach outlined in [19] is used to predict the total revenue of ESPN. This approach starts with public financial data of Disney Corporation, which is divided into Media Networks, Parks and Resorts, Studio Entertainment, Consumers Products, and Interactive Media. After identifying ESPN's as part of Media Networks, numbers from this segment were further sub-segmented into Cable Networks and Broadcasting. After a series of calculations, ESPN numbers, which are part of the Cable Networks segment numbers, were predicted. One major assumption is that 66% of
ESPN revenue comes from affiliate fees and the rest from advertising. The advertising model is
calibrated to match the calculated data and the output of the model is shown in Figure 4.13. A
slowing growth behavior (S-curve) has been implemented for future trends.
S han
fee rev
ESPN
affiliate fee rev
P dceman Id - payTV demnid
No of NFL imes
on ESPN ESPN rev
I SP'N aid re\
ESPN baseline ad rev
ESPN ad rev 3 B 2.75 B 2.5 B 2.25 B-2 B 2008 2010 2012 2014 2016 2018 2020 2022 Time (Year) ESPN ad rev: BL
Figure 4.13: Model output: ESPN advertising revenue from football.
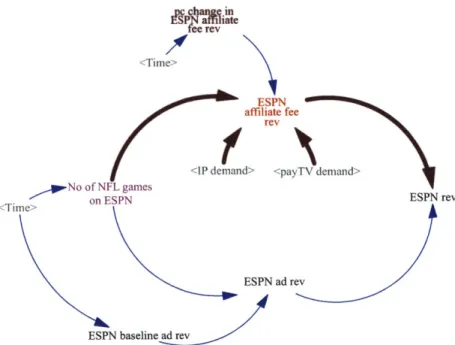
4.3.2 ESPN Affiliate Fee Revenue from Football
Affiliate fee revenue comes form pay TV providers that carry the ESPN programming in their offerings. According to [20], in 2011 ESPN captured $4.69 per month from each pay TV subscriber who has a package that includes ESPN. Affiliate fees represent ESPN's main revenue stream and it is assumed to be 66% of the total. Figure 4.14 shows the model, which is matched to data obtained as outlined in [19]. The affiliate fee revenue is driven by No ofNFL games on
ESPN as well as the two video demand parameters IP demand andpayTV demand. These video
demand parameters were initially introduced in the NFL model presented in Figure 4.3, showing one of the links between the two value chain players. The output of the model is shown in Figure 4.15.
?c cha
S~Tee rev
Time
11P demiand payT1V demmnd
N of NFL me
ESPN rev
ESPN ad rev
ESPN baseline ad rev
Figure 4.14: ESPN affiliate fee revenue from football.
ESPN affiliate fee rev
7 B 6.25 B 5.5 B 4.75 B 4B 2008 2010 2012 2014 2016 2018 2020 2022 Time (Year)
ESPN affiliate fee rev: BL
Figure 4.15: Model output: ESPN affiliate fee revenue from football.
I
4.4 Comcast Model
The next member of the football content consumption value chain is the pay TV provider.
This study focuses on a US-based cable TV provider called Comcast [21], which besides cable
TV offers mass media, Internet, and telephone services. The System Dynamics model for
Comcast is shown in Figure 4.16. The revenue sources are divided into advertising revenues and
subscription revenues. Similar to the assumptions made in ESPN revenues, a subset of Comcast
revenues is calculated to represent football related revenues.
pc change in Comcast
(
subscriber rev <Time>C omeCaSt subscriber rev
<payTV demand> <IP demand>
No of NFL games Comcast rev
r on Comcast <Ti me> Comcast ad rev <Ti me> Comcast baseline ad rev
4.4.1 Comcast Subscriber Revenue from Football
The majority of Comcast's pay TV revenue comes form subscribers paying monthly fees
to watch a number of cable channels. Although subscribers currently pay for bundled channels,
an attempt to isolate football related channel revenues has been made in this work. According to
[8], 40% of Comcast revenues come from sports related programing. Moreover, similar to the
case of ESPN, it is assumed that 60% of Comcast's sports revenue can be attributed to football.
The model used to calculate subscriber revenue is shown in Figure 4.17. It can be seen that this
parameter is driven by NFL video demand parameters and No of NFL games on Comcast. The
model output, matching the data extracted from [22] is seen in Figure 4.18. An S-curve function
is implanted to simulate future behavior.
pc change in Comcast subscriber rev Time.
Comcast subscrib eCr rex
payTV demmd I P demand
No of NFL gamse Cormcast rev
(
'On Comcast -Time> Comcast ad rev T ime> Comcast baseline ad revast subscriber rev 7 B 6.25 B 5.5 B 4.75 B 4B 2008 2010 2012
Comcast subscriber rev : BL
2014 2016
Time (Year)
2018 2020 2022
Figure 4.18: Model output: Comcast subscriber revenue from football.
4.4.2 Comcast Ad Revenue from Football
The second football related revenue source for Comcast is through advertising. The
model of this source is shown in Figure 4.19 and it is driven by No of NFL games on Comcast
and by a baseline ad revenue parameter that is used to calibrate the model to past data. The
subset of football related revenue has been calculated with the same assumptions stated in
Section 4.4.1, starting with the aggregated ad revenue data from [22]. The model output is shown in Figure 4.20. 31 Comc
.
..
..
.
...
....
CIO
03pc change in Comcast
(
subscriber rev <Time>Comcast subscriber rev
<payTV demand> IP demand,
No of NFL games Comcast rev
(
0 on Coi cast <Time-Comncast a revTime>I
Comcast baseline ad revFigure 4.19: Comcast ad revenue from football.
Comcast ad rev 2 B 1.65 B 1.3 B 950M 600 M 2008 2010 2012 2014 2016 2018 2020 2022 Time (Year) Comcast ad rev BL
4.5 Consumer Model
The final player in the modeled value chain is the consumer whose System Dynamics model is shown in Figure 4.21. The model adds up five costs consumers incur when watching football. These costs are: i- the cost of watching live games in stadiums (same as NFL stad rev). ii- the cost of Comcast subscription to watch games on Pay TV. iii- the cost subscribing to other pay TV providers, which all together have 80% of the market. iv- the fees ESPN charges when it reaches consumer directly via SpoIP. v- the fees NFLN charges when it reaches consumers directly via SpoIP. The costs in iv and v are set to zero for the baseline case when there is no SpoIP. Figure 4.22 shows the consumer spending model outputs.
percent of ESPN affiliate rev charged to consumer
ESPN affiliate _ consnmc spend
fee rev> on FSPN
Time
NIL N rve COnSumer spend
on NFLN
percent of'NFLN NIL stad rev W consumer spend
subscription rev charged to consumer
Comcast
subscriber rex
consIiner spend on toi-Cotcast pay IV
Consumer spend 40 B 30B 0 20B 10B 0-2008 2010 2012 2014 2016 2018 2020 2022 Time (Year) NFL stad rev BL Comcast subscriber rev : BL
"consumer spend on non-Comcast payTV" : BL consumer spend: BL
Figure 4.22: Model output: Consumer spending.
4.6 Summary of Sports Content Delivery Ecosystem Revenues
This section presents simulated 2012 financial numbers of the investigated value chain players to get a feel about the relative sizes of each player in the baseline scenario (status quo, no SpoLP). It should be noted that the presented revenues do not represent the whole industry, but rather the revenues of the chosen players, constituting only a subset of the industry. Moreover, the presented revenues are only football related ones that are likely to be affected by SpoIP -again only a subset of all revenues. Table 4.1 shows the revenues for each player and Tables 4.2-4.4 shows the details of each player's revenue streams. Table 4.5 shows consumer spending. The following conclusions can be drawn from the tables: NFL and ESPN earn the highest revenues, each about 37% of the total; most of NFL's revenues (69%) come from content rights; the majority of ESPN revenues (70%) comes from affiliate fees; Comcast earns 90% of its revenues
from subscription fees, constituting 93% of consumer spending on football together with the payments made to other pay TV providers.
Value Chain Player 2012 Revenues ($B) %
NFL 8.4 39%
ESPN 7.4 35%
Comcast 5.8 26%
TOTAL 21.6
Table 4.1: Value chain player revenues in 2012.
Table 4.1:
NFL Revenue 2012 Revenues % Source of
Streams ($B) Revenue
Stadium 1.8 21% consumers
NFL Network 0.8 10% pay TV providers
and advertisers
Content Rights 5.8 69% networks
TOTAL 8.4
NFL revenue streams in 2012.
ESPN Revenue 2012 Revenues % Source of
Streams ($B) Revenue
Advertising 2.4 32% advertisers
Affiliate Fee 5.0 68% pay TV providers
TOTAL 7.4
Table 4.2: ESPN revenue streams in 2012.
Comcast 2012 Revenues % Source of
Revenue Streams ($B) Revenue
Advertising 0.8 14% advertisers
Subscription Fee 5.0 86% pay TV providers
TOTAL 5.8
Consumer 2012 Spending % Spending ($B) NFL Stadium 1.8 7% Comcast Cable 5.0 19% Other pay TV 19.9 74% providers TOTAL 26.7
Chapter
5
SpoIP Disruption Hypothesis Generation
With the goal of developing hypotheses on how the content consumption over the
Internet will disrupt the Sports Value Chain, a number of other industries that have been
experiencing similar disruptions have been analyzed. These industries are telecommunications, publishing, music recording, newspaper, and television. The analyses are presented in the
following sections.
5.1 Voice over IP and the Telecommunication Industry:
The change in value-capture among the value chain players due to the introduction of
Voice over IP (VoIP) in the telecommunication industry is summarized in Table 5.1.
Value Chain Players Value Captured Comments
Product Developers Majority of VoIP development has been in SW
Infrastructure Developers Re-use already existing IP networks
Service Providers Lost lucrative long-distance call revenues
Consumers Cheaper and better service
Table 5.1: Shift in value capture in the telecommunication industry due to VoIP.
The disruption in the telecommunication industry due to VoIP has been mainly
technological and its effects on business models have been limited. VoIP has been a significant
features. It's a cheaper alternative to PSTN (public switched telephone network -the traditional circuit switched voice system). According to studies [23], switching from PSTN to VoIP can save up to 40% on local and 90% on international calls. Moreover, VoIP can be used with ubiquities, cheap or free hardware and software, such as PCs, laptops, and Skype. It employs the
highly scalable IP network and due to its packed-technology, more than two people can talk at
the same time. In addition, it has useful features, such as calling anywhere in the world with the same caller ID, forwarding voice mail transcripts to e-mails, and virtual numbers.
While VoIP is potentially a very disruptive technology in the telephony industry, a significant industry disruption has not been played out yet. Incumbent telecommunication companies lost revenues, especially form international calls [23]; however, the downside on these telecommunication companies has been limited because they too embraced and used the new technology and VoIP has been mainly used to emulate traditional services. Going forward, industry experts follow closely the VoIP disruption on the mobile telephony market. Nowadays, about 60% of the roughly $100 monthly smartphone bill payment goes towards circuit switched voice call services. However, these lucrative revenue streams are under pressure with proliferation of mobile application for VoIP service, such as Skype, Tango, and Google Voice, enabling the use of Wi-Fi or data service to make voice calls. Everything being equal and assuming that telecommunication companies allow consumers to have data-only subscription, using mobile VoIP could reduce the monthly smartphone bill by 60%, which is significant.
5.2 Books over IP and the Publishing Industry:
The dynamics in value-capture among the value chain players due to the introduction of
Books over IP (BoIP) in the publishing industry is summarized in Table 5.2. It should be noted
that the publishers and retailers that lose captured value according to the Table 5.2 are those with
traditional physical book business models. Those with hybrid and digital only businesses have
been doing better.
Value Chain Players Value Captured Comments
Authors Less dependent on publisher, able to directly reach
consumers
Publishers* By-passed by authors, not the main value creators
(editing, marketing, distributing) anymore
Retailers* By-passed by publishers, empty stores
Consumers Low cost, flexible, and many alternatives for
content
Table 5.2: Shift in value capture in the publishing industry due to BoIP.
* traditional: business model supports only physical books
The traditional publishing workflow, which has been around for many decades, has
inefficiencies resulting in long time to market and waste in the supply chain [24]. In this
workflow, the author creates the manuscript, hands it over to the publisher who edits and
prepares the book for release. The book is released according to publisher standards with hard
cover first, followed by soft cover and e-book. Books are distributed through retail channels and
on average 30-40% of all books are returned to the publisher for destruction. With this flow the
often loses control of the editorial content. Also, there is major waste in the supply chain, which is mostly absorbed by publishers. One way to reduce the waste in supply chain has been to print books after demanded by consumers, greatly increasing the purchase time of the product. With the adoption of e-books a new publishing workflow has emerged. In this workflow, the author gives the content to the book printer who prints on-demand while at the same time a digital version of the book is available. The digital version can be distributed as e-books or sent to retailers, enabling them to print on-site when demanded by consumers. At the same time, the
author promotes the book him/herself using popular channels, such as social media. In this workflow, the author maintains control over the content and the waste in the supply chain is
greatly reduced by accurately matching inventory to demand.
5.3 Music over IP and the Recording Industry:
The change in value-capture among the value chain players due to the introduction of Music over IP (MoIP) in the recording industry is summarized in Table 5.3 [25].
Value Chain Players Value Captured Comments
Artists Less dependent on labels; able to directly reach
consumers; quick feedback from consumers
Record Labels By-passed by artists, lost bundling advantage of
album sales
Retailers* By-passed by artists and labels; lost bundling
advantage of album sales
Consumers Low cost; no need to pay for unwanted songs in
albums; easy access to content
Table 5.3: Shift in value capture in the music industry due to MoIP.
Before the consumption of music over the Internet had started the recording industry was
dominated by recording companies (labels), such as EMI Recorder Music, Sony Music Group, Universal Music Group, etc. offering highly specialized services at high costs. Therefore, labels
captured most of the value generated by the value chain and only few artists earned significant
income form song sales and they mostly relied on concerts for revenues. As a result of
proliferation of music over the Internet, alternative distribution channel were created. Labels as
well as artist started to by-pass retailers by directly connecting to consumers. The ease of
distribution also increased music piracy through peer-to-peer sharing. Besides, the ease of
distribution, the availability of virtually any song via connected PCs made piracy especially
compelling to some consumers. Another disruption led by music over the Internet has been the
wider reach of radio stations that can be now listened to in any location around the world that has
access to the World Wide Web. Together with Apple's iTunes, music consumption over the
Internet led to unit of sale to change from the album to song, removing the revenue advantage
that has been enjoyed with bundling. In summary, as a result of this disruption, artists and
consumers are better off, while labels and traditional retailers are worse off.
5.4 News over IP and the Newspaper Industry:
The change in value-capture among the value chain players due to the introduction of
News over IP (NoIP) in the publishing industry is summarized in Table 5.4.
The newspaper industry has been a victim of the news over IP disruption starting with its
degradation in classified advertising revenue. Daily newspaper classified advertising peaked in
2000 at $19.6 billion and in 2010 it had fallen to $5.65 billion [26]. Newspaper lost about 70% of
because they offered lower price (sometimes free), speed (instant posting), and wider reach (wherever there is Internet). Although the incumbent news organization had access to the disrupting technologies, they did not react soon enough due to fear of self-cannibalizing their lucrative print business. However, as former Apple Inc. CEO Steve Jobs stated, if you don't cannibalize yourself someone else will [27]. Despite the recent challenges, the 2011 The
Economist article [28] finally offers some better news for the newspaper industry. Subscription
based revenue streams have stabilized for a number of newspapers (e.g. NYT) that implemented paywalls for online content consumption. The preliminary success of the paywalls can be attributed to the technological development in online payment systems, increased attractiveness of digital subscription due to the popularity of tablets and mobile devices, and clever strategies, such as the "soft" paywalls allowing consumers to read a number of articles per month for free before being asked to pay. It is clear, however, that digital ad revenues will not compensate the lost print ad revenues. Historically, print ads contributed to 80% of the paper revenue. Going forward the ad contribution is set to more like 50%, indicating a goal of less dependence on ad revenues. The paywall idea is a step in that direction. Newspapers have been the biggest losers in this disruption; however, their losses have slowed down as a result of accepting the disruption and adapting to the digital ways of news consumption.
Value Chain Players Value Captured Comments
Journalists Less dependent on newspapers; can reach readers
directly
Advertisers More options; technologies available to measure ad
effectiveness
Newspapers Besides brand name no much power left; other
players can easily by-pass
Consumers Low cost; many channels available to access
content; no need to purchase whole bundled
product
Table 5.4: Shift in value capture in the newspaper industry due to NoIP.
5.5 TV Shows over IP and the Television Industry:
The change in value-capture among the value chain players due to the introduction of TV
Shows over IP (ToIP) in the television industry is summarized in Table 5.5.
The TV business model for the past 50 years relied on a number of foundations [29]: not much to do at home besides watching TV, no way other than TV to get video content, no options
other than TV to reach viewers as advertisers, no options other than cable and satellite to get
quality TV. These foundations have been cracked lately due to technological developments. For
example, other means of home entertainment have emerged - Internet, Facebook, and games; new platforms to get TV content have been developed - Hulu, YouTube, and iTunes; other channels for advertisers to reach viewer have emerged - Internet, e-mail, and portals.
Value Chain Players Value Captured Comments
Actors/Actresses/ Less dependent on powerful TV Networks; easier
Producers access to consumers
Advertisers Alternative and cheaper access channels to
consumers
TV Networks By-passed by content creators and advertisers
Consumers Low cost; original content (sometimes); convenient
access; time shifting
Table 5.5: Shift in value capture in the television industry due to ToIP.
Internet portals, such as YouTube, Hulu, and Amazon have the potential to disrupt the
TV business, but they haven't really done so - despite offering "good enough" and cheap programing - for at least two reasons: First, the content that they provide is not unavailable in other outlets and second, these portals still require a broadband service - if you already pay on average $70 for broadband Internet, how significant is the incremental cost of adding cable to
your bill? [30]. On the original content front, Netflix seems to have learned the "content +
convenience" lesson by offering a unique content, the House of Cards, which is also an example
of a creative content called Webisodes. Webisodes are launched online as a bundle rather than
series at certain times, shifting the power of consumption from the broadcaster to the consumer who can watch the content at any convenient time. Hulu, on the other hand, has less control over its original content because its traditional media owners who fully control the content and licensing fees provide it [31].
5.6 Summary of XoIP Effects on the Investigated Industries:
As a result of the above-mentioned analyses, whose results are summarized in Tables
5.1-5.5, we can divide the value chain players into five categories: content creators, financers, aggregators, distributors, and consumers. Content financers are advertisers and sponsors while
content distributors are organizations that merely connect content creators with content
consumers with some added value - mostly not directly linked to the content. For example, a retail store selling many genres of music CDs in one place is a content distributor. Table 5.6 shows a summary of changes in captured value after re-segmenting the previously analyzed
value chains according to the newly defined four categories. It is clear that content creators, financers, and consumer benefit while content distributors loose from the distribution of the
content itself over the Internet. It is interesting to note that although five different industries have been analyzed, their dynamics in response to the Internet have been quite similar. Content
creators have benefited from the Internet because they have gained power over distributors due
to the creation of alternative channels to directly reach consumers. The proliferations of alternate
distribution channels have also benefited content financers who don't have to work with only
few players in the concentrated distribution business. The consumers gain from the disruption
because they have convenient access to cheaper content. Convenience and low cost attracts more
consumers helping the overall market [32]. On the other hand, aggregators and distributors loose from the trends because their main revenue streams are under pressure from the Internet, which
set the foundation to use newer and cheaper technologies to offer same or good enough services.
Moreover, these value chain players are often paralyzed and cannot easily follow the trends due
chain dynamics of the analyzed five industries can be extended to the sports industry to develop some hypotheses, which are presented in the next section.
Table 5.6: Shift in value capture in all analyzed industries due to the Internet.
5.7 Hypotheses about Sports over Internet and the Sports Industry:
Based on the conclusions drawn from the analyses conducted on the telephone, publishing, music, newspaper, and TV industries, there is a great likelihood that content creators, consumers, and financers will gain, while content aggregators and distributors will loose form the consumption of sports content over the Internet. However, the final outcome of the disruption will depend on the strategic choices each player in the value chain makes. Hence, it is premature to determine winners and losers at this point and a more insightful study is to use the above-mentioned analyses to develop a number of hypotheses and determine the conditions for these hypotheses to be true and predict the dynamics in the value chain with a set of simulations. In this study, the content financers, such as advertisers, are not included in the analyses to limit the
Value Chain Players VoIP BoIP MoIP NoIP ToIP
Content Creator
Content Financer
Content Aggregator/Distributor
scope. Four hypotheses have been developed and each hypothesis has one winner in the value
chain.
Hypothesis 1 (Hi): Sports content creators are king. According to this hypothesis,
leagues (content creators) will benefit the most by directly connecting to consumers; they will
work less with content aggregators, such as ESPN, and even less with content distributors, such
as Comcast.
Content creators, such as the NFL, add the most value in the sports value chain. They
create the content, which are the sport events that consumers watch. Therefore, it is likely that
they will capture most of the value that is created by the entire value chain. Traditionally, leagues
have had to share the captured value with aggregators, such as ESPN, and distributors, such as
Comcast, because they have partnered with them to reach consumers. However, with SpoIP, leagues can reach consumers through an already established, easily scalable, and cost effective
infrastructure - the Internet. Although the league will have more opportunities to reach directly the consumers, they will still continue working with aggregators and distributors due the
currently established revenue streams with content right fees and the added values of these value
chain players - the complementary programing created by aggregators and distributors. However with time, the leagues will develop capabilities to cost effectively offer the same values and
replace the revenue streams from the content aggregators and distributors, reducing their
dependencies on these value chain players and therefore reducing the value that is captured by
them. The number of fans will increase as well, increasing the number of rabid fans that generate
Hypothesis 2 (H2): Content aggregators are king. The premise behind this hypothesis
is that content aggregators, such as ESPN, will maintain their strong relationship with leagues
and content distributors, like Comcast and enjoy the benefits of increased sports content
viewership, while capturing more value at the expense of content distributors, such as Comcast. As a content aggregator and developer of complementary programming, such as SportsCenter, ESPN can be viewed as a pseudo-content creator acting as a complementor to the leagues. So, its good relationships with the leagues will continue. On the other hand, ESPN will have increased negotiating power with distributors because it will have the opportunity to reach customers directly via the ubiquitous Internet. With time, ESPN will reduce its dependency on distributors and find new revenue streams to replace those it currently enjoys from distributors. Although this seems to be unlikely today because the content distributors are also controlling the Internet connections to consumers, this will change in the future with the proliferation of mobile Internet with technologies such as LTE offered by wireless telcos, such as AT&T and Verizon.
Hypothesis 3 (H3): Content distributors are king. According to this hypothesis,
content distributors, who currently have the closest relationship with customers will embrace the new technology and will benefit the most from SpoIP.
Content distributors, such as Comcast, have the benefit of substantial income to finance new technologies and access to end consumers. As seen with the recently launched "TV Everywhere" program, this value chain players will offer the benefits (lower price and convenient access to content) of SpoIP while at the same time continue to generate revenue. Currently, Comcast does so by allowing access to premium sports content over the Internet to its paid cable subscribers, who enjoy the value added service.
Hypothesis 4 (H4): Content consumers are king. This hypothesis states that due to the
disruption in the sports content distribution industry via SpoIP, prices to watch sports events will
drop, content quality will stay the same or increase, and the consumers will capture most/more of
the value that is created.
The downward pressure on price and content quality increase will occur due to
competition among content creators, aggregators, and distributors, each trying to directly reach
consumers. Moreover, the low cost distribution over already existing Internet infrastructure will
enable these players to incur less capital cost and charge less to consumers to payback their
investments. Another key benefit that is assumed with this hypothesis is that similar to the digital
music unbundling -where consumers can buy only the songs they like rather than the whole
album - there will be an unbundling in sports content consumptions. For example, fans of the football team Dallas Cowboys can watch only their team's games no matter where they are
located physically; paying only for those games and not games of other teams. This a la carte
model will enable the consumers to pay only for what they are interested in without having to
subsidize other fans. This phenomenon will not only reduce the cost to the consumer, but also
increase the quality of the offerings - as it has been in the music industry. If the artist or label wants to revenue from each song, they need to ensure that they are all good.
Table 5.7 shows the summary of the developed four hypotheses. In the table, red and yellow down arrows represent significant and modest decline in value capture, respectively.
Value Chain Players H1 H2 H3 H4
Content Creator (NFL)
Content Aggregator (ESPN)
Content Distributor (Comcast)
Content Consumer (Fans)