HAL Id: hal-00201119
https://hal.archives-ouvertes.fr/hal-00201119
Submitted on 23 Dec 2007HAL is a multi-disciplinary open access archive for the deposit and dissemination of sci-entific research documents, whether they are pub-lished or not. The documents may come from teaching and research institutions in France or abroad, or from public or private research centers.
L’archive ouverte pluridisciplinaire HAL, est destinée au dépôt et à la diffusion de documents scientifiques de niveau recherche, publiés ou non, émanant des établissements d’enseignement et de recherche français ou étrangers, des laboratoires publics ou privés.
Critical and sustainable fluxes: theory, experiments and
applications
Patrice Bacchin, Pierre Aimar, Robert Field
To cite this version:
Patrice Bacchin, Pierre Aimar, Robert Field. Critical and sustainable fluxes: theory, exper-iments and applications. Journal of Membrane Science, Elsevier, 2006, 281 (1-2), pp.42-69. �10.1016/j.memsci.2006.04.014�. �hal-00201119�
Review
Critical and sustainable fluxes: theory, experiments and
applications
P. Bacchin(1) P. Aimar(1) and R.W. Field(2)
(1)Laboratoire de Génie Chimique, Université Paul Sabatier, 118 route de Narbonne,
31062 Toulouse cedex, France
(2) Department of Engineering Science, University of Oxford, Parks Road, Oxford OX1 3PJ, UK
* Corresponding author. bacchin@chimie.ups-tlse.fr, Fax number : (33) 5 61 55 61 39
Over the last ten years, numerous membrane filtration data have been viewed in the light of the concept of critical flux. This concept, used in a number of different ways often without explicit redefinition, is here clarified both from a theoretical and from an experimental viewpoint. Also, a link is make with the sustainable fluxes. Also covered are the various methods of measurement and the influence of membrane and suspension properties on the critical flux. Over the same period of time, models have been developed to explain the observed behaviour. Those for stable colloidal suspensions are based on the existence of repulsive interactions between soft matter constituents. The assumptions and usefulness of various models are discussed. The concept of a critical concentration for phase transition is introduced into the theoretical discussion. For theoreticians and experimentalist, this and the clarified concept of a small set of critical fluxes will continue to provide a valuable framework. For membrane users dealing with most industrial process streams (mixtures and complex fluid) the concept of a sustainable flux (shown as being derived from critical flux) is of a great utility; above a certain key flux (dependent on hydrodynamics, feed conditions and process time) the rate of fouling is economically and environmentally unsustainable. For many, knowledge of the point below which no major irreversible fouling occurs (the critical flux) in a membrane separation will always be of greatest utility.
Keywords: fouling, critical flux, colloid, ultrafiltration, nanofiltration, microfiltration, reverse osmosis
1. Introduction
Flux reduction below that of the corresponding pure water flux (or more generally pure solvent flux) can be divided into two separate parts. Firstly concentration polarisation is a natural consequence of the selectivity of a membrane. This leads to an accumulation of particles or solutes in a mass transfer boundary layer adjacent to the membrane surface that affects the flux by a reduction in effective transmembrane pressure driving force (TMP) due to the osmotic pressure difference between filtrate and feed solution adjacent to the membrane surface. This phenomenon is inevitable, but is reversible with a reduction in TMP and hence flux.
Secondly there is fouling which may take the following forms:
• Adsorption : adsorption occurs when specific interaction between the membrane and the solute or particles exist. A monolayer of particles and solutes can grow even in the absence of permeation flux leading to an additional hydraulic resistance. If the degree of adsorption is concentration dependent then concentration polarisation exacerbates the amount of adsorption.
• Pore blockage : when filtering, pore blockage can occur leading to a reduction in flux due to the closure (or partial closure) of pores.
• Deposit : a deposit of particles can grow layer by layer at the membrane surface leading to an important additional hydraulic resistance. This is often referred to as a cake resistance.
Accumulation (concentration polarisation) at the membrane surface cannot be avoided but a correct choice in operating conditions permits one to choose those conditions where the mass accumulation only has a minor effect on the process efficiency.
Working below critical flux can permit operation over long time periods without any significant deposition occurring (Fig. 1). The careful reader will have noticed that the word “significant” has been slipped in and this paper will also address the concept of sustainable flux later, this being particularly relevant for industrial processes.
Fouling can also change membrane selectivity and therefore the critical flux concept can have consequences for selectivity. Thus understanding the critical and sustainable positions will influence process optimisation with regard to both productivity and selectivity.
With regard to industrial processes the development of sub-critical membrane processes has lead to a reduction in energy consumption but there is a need for larger membrane surface area. So the decrease in running costs is partially off-set increased investment cost. Ideally there is the opportunity for sub-critical operation. Achieving or approaching such conditions has good prospects:
• Environmentally beneficial; there is lower energy consumption and less usage of chemical agents and therefore the operation is more environmentally friendly.
• Technically sound; sub-critical conditions yield a clean way of operation that can be more easily controlled. Ideally it allows one to work with a membrane that is not covered by fouling multilayers which drastically change the selectivity efficiency.
• Economically attractive; with membrane cost decreasing sub-critical membrane operation or near sub-critical operation will be attractive to both operators of membrane processes and suppliers who will increase sales volume.
Scientifically, the critical flux concept is now ten years old. Over the last ten years, a lot of studies have been realised on “critical flux” determinations for crossflow membrane filtration. As an illustration, Figure 2 shows the growing evolution over the last ten years of the number of publications in journals satisfying the research criteria “critical flux* and (fouling or membrane)”. Data was taken from Science Citation Index in March 2005. In the same figure, the number of these papers as a percentage of those dealing with fouling in membrane science (satisfying the research criteria “fouling and membrane”) is also plotted. This relates to the impact of the concept. In recent years, 10-20 papers per year were produced using the critical flux concept and this represents around 10% of the scientific production on fouling in membrane science. This research area is expanding and now represents a significant part of works dealing with fouling. These works have also a good impact factor: the 90 papers being cited 666 times over these years. Table 1 lists papers concerned with this concept that have had more than 30 citations. The first three of them corresponds to the first ones to define a critical flux in 1995.
This paper seeks to summarise the literature on “critical” flux especially with regard to colloidal filtration, to summarise methods of measurement and to refine and clarify usage of terms in order to maintain their utility. Such action is necessary because as Samuel Baker (1835-1902) wrote “A definition is the enclosing of a wilderness of idea within the wall of words” but as a contemporary noted “words are slippery and thought is viscous” (Henry Brooks Adams, 1838-1918). Slippage has occurred and the actual ideas being discussed obscured so it is timely to disentangle various concepts and in so doing to
answer the questions, “Is the critical flux concept just a fashion or a useful concept?”, and “What other related terms (e.g. sustainable flux) are now useful?”
2. Critical flux concept : background and first definition
This section provides some background information. It is intended to be neither a comprehensive review of fouling nor of Flux-TMP relationships.
An important characteristic of membrane operation, especially in UF/MF, is the limiting flux which corresponds to the maximum steady state flux achievable with a given solution or suspension Michaels [1],Porter [2]. For this limit, further increases in TMP do not increase flux.
Broadly speaking the critical flux has been defined in two ways. Either as the flux at which the transmembrane pressure (TMP) starts to deviate from the pure water line (the strong form of critical flux) or as the first permeate flux for which irreversible fouling appears on the membrane surface. The critical flux can be generally defined as the “first” permeate flux for which fouling become predominant; being then well differentiated from limiting flux (the “last” flux reachable).
As a contextual introduction, some prior history and the birth of this concept are given below.
2.1. State of the art leading to the critical flux concept
Historically, the first publication giving the idea of a possible “threshold” flux when filtering a colloidal suspension has to be attributed to Cohen et al. [3] in 1986. In this publication, the authors noted that permeate flux obtained during reverse osmosis of ferric hydroxide was very high (and called this the "colloid flux paradox"). They advanced the idea that such a behaviour could be due to surface interaction between colloidal particles. In 1989, Mcdonogh et al. [4] pursued this idea and reported experiments with silica particles where permeate flux was affected by changes of ionic strength. This underlines the role played by surface interaction. In a 1994 review, Belfort et al. [5] detail fouling mechanisms and included in their discussion a section about colloid capture by a membrane which is however separated from the main one dealing with particle transport. They concluded that progress has been made in “identifying the importance of colloidal and particle fouling and the proper description of colloid-membrane interaction” but that there still exists a need to develop “quantitative understanding of the possible interactions that can occur between (…) particles in a complex process streams”.
2.2. First definitions and features
In 1995, the first three papers to define the critical flux concept were published. Firstly a theoretical model proposed by Bacchin et al. [6], [7] balanced surface interaction, diffusion and convection. This gives a physical explanation for the "colloid flux paradox". When compared to other transport phenomena, surface interaction are shown to be responsible for fluxes which are well above the ones given with other transport phenomena (diffusion, shear induced diffusion and lateral migration) for particle size between 10 nanometers and 10 micrometers (Fig. 3). From this modelling, a critical flux is defined as “the flux below which no fouling occur” and its existence is theoretically proven and physically explicated by transport phenomena induced by surface interaction: the critical flux is the flux required to overcome repulsion and lead to the coagulation on the surface. This definition has the clear merit of being related to a physical mechanism and “criticality” is the point at which the repulsive barrier is overcome.
The second paper took a purely empirical approach. Field et al. [8] defined “a flux below which a decline of flux with time does not occur; above it fouling is observed”. As shown in Figure 4, there are two forms of this flux : strong and weak. The strong form is the flux at which the transmembrane pressure (TMP) starts to deviate from the pure water line, which is of course linear. For the weak form,
there is the assumption that there is very rapid fouling on start-up and so the flux-TMP relationship is below that of the pure water line. The critical flux (weak form) is the point at which this line becomes non-linear.
Thirdly Howell [9] depicted “a flux below which there is no fouling by colloidal particles” which allows then the definition of “sub-critical flux operation of microfiltration”. In so far as this definition avoids reference to fouling by macromolecules that might also be present, and that their effect could increase with time, this definition can now be seen retrospectively, as a harbinger of the concept of a sustainable flux.
2.3. Clarification and new definitions
It is important before going further to clarify definitions of critical flux that will be linked to methods of measurements (§3), experimental features (§4) and theory (§5). Above it was noted that the term critical flux had been used in mainly two ways, either as the flux at which the flux-transmembrane pressure (TMP) curve starts to deviate from linearity or as the first permeate flux for which irreversible fouling appears. Definitions have been given at different levels. Some are from a physical (deterministic) point a view (typically defined as the flux that leads to coagulation close to and then deposition upon the membrane) whilst others are from an experimental (naturalistic) point a view. The latter were typically defined as the flux leading to a first deviation from a linear variation with TMP.
A clarification will be first made in this section according to classical flux-TMP-fouling equations. Some further link to the theory will be seen in the modelling section. Generally, reduction in flux (or increase in pressure) for constant pressure (flux) operation is linked to a filtration law which can be seen as an integral form of the Darcy law in which different fouling mechanisms operate.
( m ads rev irrev)
P J R R R R π μ Δ − Δ = + + + (1)
An osmotic pressure term, Δπ, reduces the efficiency of the trans-membrane pressure. Furthermore, hydraulic resistance are added to the membrane resistance because of :
• surface or pore adsorption, Rads (independent of solvent transfer)
• a fouling resistance driven by the filtered volume being reversible (eg possibly pore blinding, or cake deposit), Rrev, or irreversible (possibly cake deposit or gel formation), Rirrev.
This classification allows one to distinguish additional resistances (such as adsorption) that are independent of the pressure and permeate flux from fouling phenomena driven by the solvent transfer through the membrane. Fouling of the latter type can be reversible (Rrev) or irreversible (Rirrev) when the
pressure is decreased.
When considering these fouling mechanisms, the strong form of critical flux, Jcs, has been
developed to discriminate no fouling conditions (where Rm is the only resistance in equation 1) from
fouling conditions where other resistances also apply. It has been defined as the flux at which the flux-transmembrane pressure (TMP) curve starts to deviate from linearity (Fig. 4). So with the assumption that osmotic pressure effects are negligible
cs cs for J<J : for J>J : ( ( )) m m rev irrev P J R P J R R R μ μ Δ = Δ = + +
The weak form of critical flux, Jcw, has been used to distinguish operation below and above the
point at which the performance is influenced by fouling phenomena that are driven by the solvent transfer through the membrane. Initially the additional term was applied only to adsorption occurring at the outset of filtration [8]. Later a distinction was made by Wu et al. [10] between very low fouling conditions and more significant ones, with this intermediate region being between, Jcs and Jcw. However in this review
the former definition is retained.
cw cw for J<J : ( ) for J>J : ( ) m ads
m ads rev irrev
P J R R P J R R R R μ μ Δ = + Δ = + + +
where at least one of Rrev or Rirrev is non-zero
We now define a new term “critical flux for irreversibility”, Jci, to discriminate fouling with respect to
its irreversibility. Above the critical flux for irreversibility, there are growing multi-layers of irreversible fouling in the boundary layer whereas below it only a concentration polarisation layer exists in all cases with an additional mono-layer of adsorbed species in some cases. When filtering macromolecules or colloidal dispersion, this critical flux is related to the coagulation of the dispersed phase close to the membrane surface, followed by deposition upon it. Accumulatted matter at the membrane undergoes a phase transition from a dispersed phase (concentration polarisation) to a condensed phase (multi-layer deposit).
The irreversibility form of the critical flux can be defined by :
ci ci for J<J : ( ) for J>J : ( ) m ads rev
m ads rev irrev
P J R R R P J R R R R π μ π μ Δ − Δ = + + Δ − Δ = + + +
where Rads might include in-pore fouling or monolayer adsorption.
There is a theoretical foundation for the critical flux for irreversibility in the work of Bacchin et al. [7] accounting for colloidal surface interaction. This approach can also be found in the experimental analysis of Defrance et al. [11], [12] who defined the "critical" flux as the flux below which the TMP remains stable and fouling is reversible. These authors say that before this flux fouling is due to pore plugging and adsorption but when it was exceeded TMP increased and did not stabilise due to cake formation at the surface.
Although the concept of critical flux was originally postulated as a method of avoiding fouling it is now seen by many as a concept related to the minimisation of fouling. Thus the useful concept of sustainable flux has recently evolved especially in the context of membrane engineering. Whilst having links with the concept of critical flux, a sustainable flux itself is not a critical flux. For mixtures (and this includes most industrial process streams) the concept of a sustainable flux is useful; above a certain key flux (dependent on hydrodynamics, feed conditions and process time) the rate of fouling is unsustainable. If there is a clear discontinuity in the rate of fouling as a function of flux then this point is very important from a practical point of view.
Three different definitions of critical flux were used above and these are summarised in Table 2. They relate to different patterns of flux-TMP-fouling behaviour. Various inter-relationships exist between the terms. For example when adsorption and osmotic pressure phenomena are insignificant and the fouling resistance is purely irreversible, then the strong form of critical flux and the critical flux for irreversibility are exactly the same (fig. 5 a). Secondly if adsorption (or other fouling phenomena independent of
pressure) occurs but there is no osmotic effect then the weak form of critical flux and the critical flux for irreversibility are exactly the same (fig. 5 b). In those cases where osmotic pressure can not be neglected (eg colloidal and macromolecular filtration Fig. 5 c) then the critical flux for irreversibility is the only definition that is theoretically sound because a deviation from linearity might be the consequence of the osmotic pressure (which is a reversible phenomena). The irreversibility can be shown by [10] hysterisis in the flux-pressure relationship as flux is increased and decreased. Figures. 5 c might also describe the behaviour of particulate systems, such as earlier work Benkahla et al. [13] on cake growth in the cross-flow microfiltration of mineral suspensions. Often the critical flux for irreversibility Jic has been
measured but Jcs or Jcw might also exist and an estimate would be of scientific interest.
3. Methods of Measurement
The critical flux has mainly been obtained from flux-TMP measurements often by flux or pressure stepping. Also observations have been deduced from particle mass balances and by direct observation through the membrane (DOTM). Various methods are introduced together with critical comments upon their implementation including the quality (accuracy and reliability) to price (experiment length and complexity) ratio of methods.
3.1. Deductions from Flux-Pressure observations
Flux-pressure experiments can be made either by imposing a flux and measuring a pressure or by imposing a pressure and measuring a flux. They have different advantages and inconveniences.
A constant pressure allows determination of a steady state flux (the filtration system is self regulated: fouling decreases the flux thus reducing rate of fouling) which lead to reliable results with no time dependance (if a sufficient duration for each pressure step is used). On the other hand, a constant flux leads in the presence of fouling phenomena to a continuously increasing pressure with running time because of a (quasi) constant fouling rate. The former method allows then determining steady state flux (and then steady state hydraulic resistance) whereas the second one is able to give for a given flux the fouling rate (the variation of the resistance with time). These methods are then fully complementary giving steady state data (needed to scale-up filtration process) whereas the second one gives dynamic data (often allowing to have an idea of the sustainability of fouling in the process).
In a general way, constant pressure experiment can be recommended when working with suspension showing few adsorption in order to reach intrinsic steady state permeate flux. On the other hand, constant flux experiments are adapted to reveal fouling phenomena with complex suspensions.
3.1.1. Flux-pressure profile
With a suitable value for the permeability of the membrane either constant pressure or constant flux operation can be used to determine the critical flux. However, for UF membranes of dilute feeds [10] found that it was very difficult to control the TMP at a low enough value to measure the strong form of the critical flux and therefore that constant flux operation was to be preferred. Constant flux operation (with measurement of TMP) is readily achieved by pumping the permeate. The TMP should remain constant with time at each flux, as any increase indicates fouling and therefore that the critical flux has been exceeded. Ideally the total resistance should be calculated at each step to check whether the resistance has remained constant.
Constant pressure experiments have also been used, for example, by Gesan-Guiziou et al. [14]. An indication of fouling is then given by flux decline. So with certain feeds permeate pumping is not essential but for very sensitive determination of critical flux constant flux operation is recommended
because the sensitivity of the TMP measurement allows small changes due to any trace fouling to be detected. Another example in Fradin et al. [15] of constant pressure operation involved magnesium hydroxide suspensions and a sintered metal membrane. For critical flux operation, membrane conditioning was required. This involved operation of the membrane at a low flux and with a dilute suspension for a few hours prior to operation with feeds of interest. When membrane conditioning of this type is involved, any critical flux found is now best viewed as being a critical flux for irreversibility, Jic.
For both modes, the critical flux is the point where the flux-TMP relationship becomes non-linear. If flux-TMP gradient is lower than that of clean water but linear then this critical flux is of the weak form. Whilst reference was made to water, one could for UF/MF, but not RO, beneficially substitute buffer solution. The use of pure water can lead to very thick Gouy-Chapman double layers and an electro-viscous resistance in the membrane pores. This effect can be effectively removed by using electrolyte (higher ionic strength).
It is important that the flux is initially sub-critical and then increased to the critical flux. If initially the flux is higher then irreversible fouling at the higher flux will affect any subsequent measurements. From figure 6a, Milcent et al. [16] concluded that the "critical flux” was 50 l/m2h. At 50 l/m2h TMP does appear to have stabilised however this graph cannot be used to determine Jcrit without
some crosschecking of resistance because the flux was previously much higher. Indeed if one examines the TMP curve one may note that there has been some irreversible fouling as TMP is much higher than when it was at this flux previously. For the lower crossflow velocity (Figure 6b) the value attributed to Jcrit was given as 20 l/m2h but the same reservations hold. Also there appears to be a slight increase in
TMP at this flux which means it is above the critical flux. The values determined do relate to a significant change in behaviour but do not satisfy the definition of critical flux as originally defined. There is insufficient evidence to determine whether the fouling is reversible and so the values given can not be taken to be values of the critical flux for irreversibility. Repetition of the experiments approaching the flux values from below would have been of greater interest.
Although during flux stepping experiments, an increase in TMP at a given flux indicates fouling, the converse, namely an observably constant TMP at a constant flux, is not enough to prove sub-critical flux operation. For example, Persson et al. [17] claimed stable fluxes up to 110 l/m2h but it can be seen from the flux-TMP profile (figure 7) that some fouling has occurred by 80 l/m2h. There can be a flux above the critical value at which pressure will appear to remain constant with time because the new steady-state is rapidly obtained. For this reason, resistance calculation at each point is recommended. Thus the essential determination of the linearity (or otherwise) of the flux-TMP relationship can be made 3.1.2 Flux stepping and flux cycling
The simplest form of this technique is a set of increasing pressure steps followed by a set of decreasing steps, eg Chen et al. [18]. They showed that above the “critical” flux a significant hysteresis occurred but the deviation from linearity was not made clear. The stepwise filtration procedure has been commonly used to determine “critical” filtration conditions for a variety of fluids eg Gesan-Guiziou et al. [19],Kwon et al. [20],Manttari et al. [21]. An identical step-by-step procedure but regulated on the permeate flux was used by Wu et al. [10]. They described two types of experiments. One is a series of increasing flux steps (eg Figure 6 in [10]), the other involves a series of up-and-down steps. The latter is a series of flux cycles and is illustrated in Figure 8. In the latter the sensitivity of the TMP measurement allows small changes due to any trace fouling to be detected. For example when examining the filtration of BSA solution with the 50k MWCO membrane (pH 7.4, 0.15% w/w, Re 248) use was made of this procedure where flux was increased and then decreased to a previous value in a series of steps. The filtration process consisted of a series of steps during each of which a flux was specified and the TMP produced was recorded. At step 1, once J1 was set and the process had reached a steady state (in this case
it took 40 s) the transmembrane pressure was recorded as TMP1. If this was the first step, the flux was
then increased to a slightly higher value and the flux was again recorded in a similar fashion. After this step with a slightly higher flux ended, the flux was set back to J1 and another value of TMP was recorded
as TMP1′. The difference between TMP1 and TMP1′ was called the deviation. If deviation equalled zero, it
was presumed that no fouling had occurred. The flux was then increased to J3 before being moved back
to J2. If the difference between TMP2 and TMP2′ was zero, it was presumed that no fouling had occurred.
Fig 8 illustrates the flux, the TMPs and the deviation at each stage for the process. It shows that for the first three steps all the deviations were zero which means there was no fouling at all before the flux was 20 lm−2 h−1. Furthermore the calculated resistance was constant. Upto stage 7 the amount of fouling is
close to the limit of detection.
As illustrated in Figure 8 the transition to irreversible fouling occurs either at the same point as the deviation from linearity or it occurs at a higher flux. Clearly a check of reversibility is required. This can be done using flux stepping but instead of steadily increasing the flux, the flux should be increased by two steps and then decreased by one and TMP measured at each step. If the TMP, when the flux is decreased, is not the same as when the flux was previously at that level, irreversible fouling has occurred and the critical flux for irreversibility has been exceeded. This technique has been used by Metsamuuronen et al. [22]. Their experiments were run for only 9 minutes, which is only sufficient to indicate "critical" flux. Half an hour is a more common length of time. Certainly it is worth checking that the critical flux indicated in short times is stable over longer periods of time. In most early works including that of some of the co-authors’ this was not done. Some recent theoretical work indicates the importance of time especially for macromolecules and this point will be expanded upon later.
Critical flux obtained by mass balance (see section 3.3) are always inferior (around two times less) than the one obtained by analysing results of a flux step method. Whilst one may question the “critical” flux values obtained from profiles and deduce different values, there is a need for improved techniques (and clearer definitions) if different values are obtained by different people from the same data. A more accurate critical flux determination can be obtained by analysing the reversibility of the fouling for each step of pressure or flux. To this end the procedure of filtration with pressure steps composed of alternative increasing and decreasing step initiated by Wu et al [8] has been developed further by Espinasse et al. [23]. This last method allows continuous quantification of fouling reversibility so permitting very accurate measurement of critical flux of both types.
Espinasse et al. [23] realised experiments with alternative up and down pressure steps for which the steady state flux were measured (step principle in figure 9). By analysing these experiments, the authors dissociated the irreversible and reversible part of fouling for each pressure step i.e. continuously during the filtration. If reversible fouling is associated with the osmotic pressure contribution, then figure 10 shows an increase of osmotic pressure from the start of the filtration. However the increase due to the irreversible part of fouling was measured only above a flux of around 14 10-6 m/s. This flux is the critical flux for irreversibility (Jci). The behaviour corresponded to that shown in Figure 5c.
Whether fouling is reversible and hence whether the transition to irreversibility has been exceeded is readily determined by this technique but repetition of experiments is highly desirable. Clearly Defrance et al. [12] determined a point of very significant change in the experiments above 92 l/m2h as shown by the data of Figure 11. Either as they suggest the increasing and decreasing fluxes (at lower fluxes) are not identical due simply to experimental error or there is a very minor component of irreversible fouling during initial operation.
Another factor that may influence the transition to irreversibility is the flux-pressure history. If the flux is increased gradually to a given level, the cake can be much looser and more likely to re-disperse than if that same flux had been imposed immediately.
3.2 Direct Observation through the Membrane (DOTM)
In discussion some have suggested the term "cake formation flux". The cake formation flux cannot be measured directly using the flux-pressure relationship of § 3.1as the changes might well not be attributable to cake. With other evidence it would be reasonable for this to be the cause of sudden changes and large increases in TMP. This question can partially be answered by results from DOTM (Direct Observation Through the Membrane). In DOTM, a microscope is used to look through an Anopore membrane, which is transparent when wet. Deposition of particles on the membrane surface (or their absence) can be observed. Li et al. [24], [25] have used this technique and shown that the variations in pressure caused by deposition can be very small. This can be seen in figure 12. Thus the point of first deposition is not the point of large changes in resistance.
Clearly DOTM is a very sensitive way of detecting particle deposition but it is restricted to transparent membranes. Nevertheless this technique where applicable is the only one that can be used for direct observation of the initial deposit on the membrane. Also it has to be noted that these direct observation have always been made on particle of a relatively large size (circa 10 μm in diameter). Although the use of UV observation may in the future permit the observation of smaller particles of a few microns in diameter.
Electron micrographs have proven the non-existence of deposit on a membrane after sub-critical operation [18]. Direct observation during the formation of deposit on membrane have been realised by Li et al. in 1998 [24]. These observations have proven the appearance of a deposit above the critical flux.
3.3 Mass Balance
By monitoring the concentration of particles in the outlet stream, Kwon et al [20] measured a critical flux based on a particle mass balance. The adsorption of particles in the system was measured by measuring the concentration when there was no flux. The idea is that any reduction in particle outlet concentration not caused by passive adsorption/adhesion is caused by deposition. Once the deposition rate at several fluxes had been found a graph of flux against deposition rate was plotted. The critical flux was then found by extrapolation; it is the flux at which the deposition rate is zero. This could be expected to relate to a "cake formation flux". However the critical fluxes were also measured using TMP increases at constant flux and found to be up two times larger. However, the flux-TMP relationship seems to have been ignored and it is not linear below the alleged critical fluxes. For example in figure 13, where 0.816μm diameter latex was being filtered, the authors have said that critical flux is around 120 l/m2h for
all pore sizes but by 80 l/m2h all the profiles have become non-linear which suggests the critical flux is at least 40 l/m2h too high. So the point of transition that was determined will have corresponded to a
different phenomena.
Gesan-Guiziou et al [14] claim they found their critical flux from a mass balance and TMP stepping simultaneously but they do not say whether these values agreed or if they used an average of the two. Bowen et al. [26] have used a similar technique. They found the fractional deposition after 4 hours of operation at several different fluxes. By plotting these, they could extrapolate to find the flux at which there was no deposition but they did not find a critical flux for all the membranes they used. The mass balance technique does not distinguish between strong and weak forms of critical flux and gives no information about reversibility per se. It should be used in conjunction with another technique. Also it
must be remembered that whilst it is suitable as a complementary technique for particulates, it is not directly applicable to macromolecules where a measurable quantity of solute will accumulate (polarise) near the membrane in the concentration polarisation layer.
3.4 Determination by fouling rate analysis
As noted by Le Clech et al. [27], a zero rate of TMP increase may never be obtained during trials with real and synthetic sewage. Thus use of the flux-step or any other method to determine critical flux will yield a result that it may not exist. In their work the result is that if it exists, the value is less than 2 lm-2h -1. The useful results from experiments in this area relate to the rate of fouling. Significant differences
above and below clearly defined fluxes have been found as illustrated in Figure 14. These points of change are significant and relate to the operational and economic sustainability of a membrane process. So as already indicated the term sustainable flux Jsus will be more appropriate if a distinction is being
made between low and high fouling rates. It is conceivable that the rate of fouling approach will identify both a value Jsus and a critical flux. Indeed referring back to Figure 5, three points of change might be
significant: two critical fluxes (Jcs or Jcw and Jsus) as illustrated in that figure and at a higher flux a value
of Jsus.
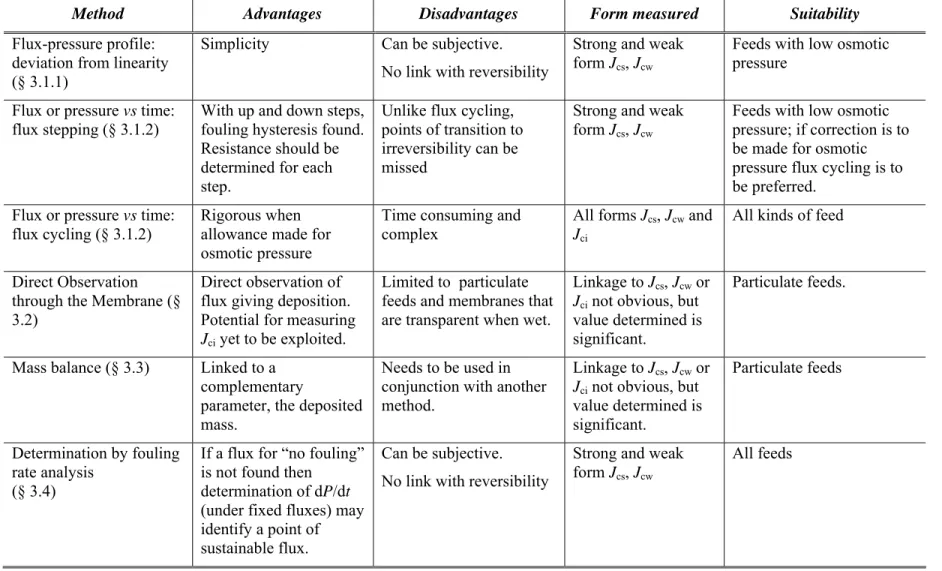
3.2. Comparison of techniques for critical flux measurement
The various measurement techniques have different advantages and disadvantages : a summary is given in table 3. According to the definition given in section 2, the weak and strong form of critical flux can be defined by a deviation from water flux line. Irreversibility form of critical flux can be fully determined by methods with continuous up-and-down flux or pressure steps. Mass balance method could be a useful complement to these methods with a determination of deposited mass. However, for complex suspension, the analysis of the criticality via fouling rate, obtained through when operating with the flux step method have shown interesting perspectives for submerged membrane bioreactor in Jefferson et al. [28]. This method has potential to characterise fouling in others systems.
4. Experimental features
First experimental highlights of the critical flux concept were by Field [8] and Howell [29] who used a wide range of different colloidal suspension (yeast, dodecane-water emulsion and calcium carbonate slurry) which shows the breadth of interest for sub-critical operation of microfiltration. Experimental determination of critical flux realised on clays with different ionic strength have proven the important link between the critical flux value and suspension stability so underling the role taken by particles repulsion in the concept of critical flux [30]. Many studies have since proven the existence of a “critical’’ flux (the inverted commas are used to show that the values determined might relate to the sustainable flux rather than the critical flux) and have determined its value with different fluid and filtration conditions. These works have been realised with various kind of fluid suspension from “model or lab” fluid to more complex suspensions related to industrial applications as listed below.
The wide range can be viewed as consisting of three subsets (colloidal dispersion, macromolecular solution and complex fluid) for which the increasing level of complexity can explain the difficulties in reaching accurate and reliable critical flux value:
• Gold sol : Madaeni [31]
• Silica particles : [10],[18],Huisman et al. [32]
• Latex : [14],[19],[20],[24],Li et al. [25],[23],Espinasse [33],Kwon et al. [34],Vigneswaran et al.
[35]
• Clays : Bacchin et al. [30],Cabassud et al. [36],Hamachi et al. [37],Kwon et al. [38]
Macromolecular solution • Proteins
• lactalbumin : Howell et al. [39],Vyas et al. [40]
• Myoglobin : [22]
• γ−lactoglobulim and IgG : [39],Chan et al. [41]
• lysozyme : Chan et al. [42]
• Bovine Serum Albumine : [10],[41],[42],Chen [43],De Zarate et al. [44]
• Natural Organic Matter (NOM) or humic substances : [26],Aoustin et al. [45],Seidel et al.
[46],Yuan et al. [47] • Emulsion : [8] Complex fluid
• Yeast cells : [10],[22],[25],Chang et al. [48],Sur et al. [49]
• Skimmed milk : [19],Al Akoum et al. [50],Gesan-Guiziou et al. [51],Gesan-Guiziou et al.
[52],Grandison et al. [53],Youravong et al. [54]
• Water and waste water : Chapman et al. [55],Choksuchart et al. [56],Vera et al. [57],Vera et al.
[58]
• Lactic acid broth : [16],[17],Carrere et al. [59]
• Bioreactors sludge : Defrance et al. [11],[12],Bouhabila et al. [60],Chang et al. [61],Cho et al.
[62],Choo et al. [63],Fane et al. [64],Gander et al. [65],Jefferson et al. [66],Madaeni et al. [67],Ognier et al. [68]
• Pulp and paper mill : [21],Huuhilo et al. [69],Manttari et al. [70]
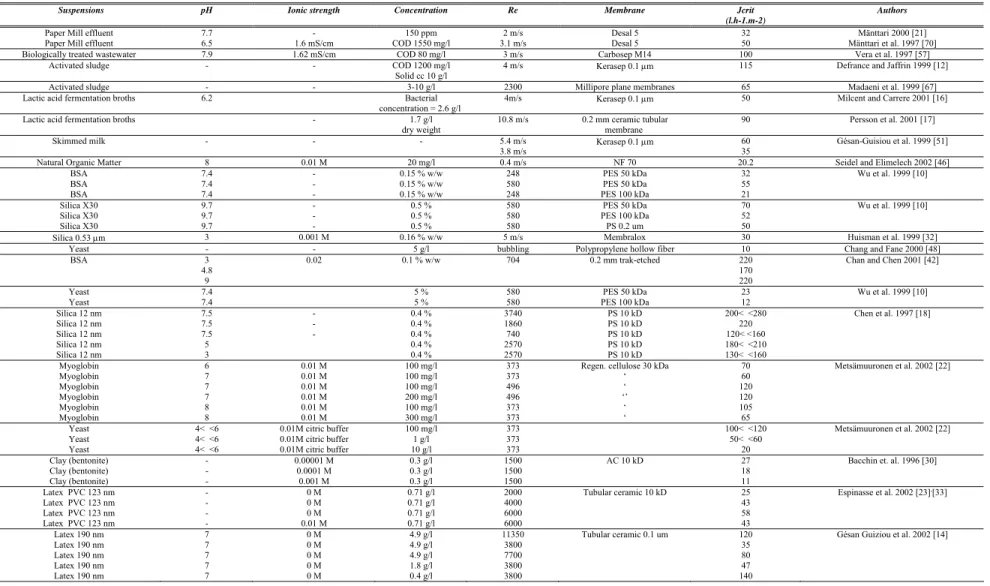
Table 4 summarises the operating conditions for these principal determinations of “critical” flux. Objectives of most of these publications were focused on the determination of fouling mechanisms so as to have a good choice of operating conditions. The way determinations can be made and the tools develop to experimentally access “critical” flux has been covered in §3. The sensitivity “critical” flux to operating conditions is now reviewed (suspensions properties §4.1, hydrodynamics §4.2 and membrane properties §4.3) and the consequences on process productivity and selectivity is detailed §4.4.
4.1. Effect of suspension properties on critical flux
4.1.1. Suspension stability
As soon as surface interaction was highlighted as being mainly responsible for the critical flux of colloidal suspensions [7] numerous works were undertaken to study the effect of suspension properties. Principally these are pH, which changes the solute charge, and ionic strength that varies the surface repulsion through charge screening. Globally an increase in pH above the isoelectric point (IEP) gives an increase in the critical flux. By way of illustration, firstly it has been found that there is an increase in the weak form of critical flux from 60 to 105 l/h.m2 for myoglobin as pH is increased from 7 to 8 (Metsammuren et al. 2002 [22] in Table 4). Secondly for silica the following rise was found: circa 145 to 195 l/h/m2 as pH increased from 3 to 5 (Chen et al. 1997 [18] in table 4). A minimum in the critical flux
has also been determined for BSA suspension for a pH near the IEP as presented in figure 15 (Chan and Chen 2001 [42]). Consistent with this, it has been observed with whey protein concentrate and sodium caseinate suspensions (Youravong et al. 2002 [54]) that there is an increase in critical flux for both protein suspensions with increasing pH.
Regarding ionic strength, an increase of ionic strength below the critical concentration for coagulation decreased the critical flux both in clays suspension [30] and for latex particles (Kwon et al. 2000 [20], Espinasse 2003 [33]). Also addition of electrolyte decreased the critical flux for sodium caseinate with a more pronounced influence for CaCl2 than for NaCl. These experiments directly illustrate
the role of the ionic strength and the pH on the repulsive surface interaction that can explained through DLVO theory. They underline again the direct correlation between the stability of the suspension and the critical flux.
Surface hydrophobic interaction has also been shown to be important in more complex suspensions. The effect of Ca++ concentration on critical flux has been underlined during NOM nanofiltration (Seidel and Elimelech 2002 [46]). The formation of Ca-NOM binding leads to a change in interaction between NOM macromolecules: the stability is decreased by a change in conformation when calcium is added which exposes the hydrophobic part of NOM. As a consequence a decrease in the critical flux is observed.
Changes in electrostatic interaction are not always the cause of suspension instability. For example an increase of pH beyond a threshold value in a membrane bioreactor used for denitrification (Ognier et al. 2002 [68]) resulted in an important decrease in critical flux. This resulted in the deposition of carbonate calcium precipitate on the membrane. The mechanism of precipitation or crystallisation of a solute can be seen as resulting from the presence of a solute with low stability. So again the important decrease in critical flux results from suspension instability.
4.1.2 Suspension concentration
A lot of studies show a decrease in the critical flux when the suspension concentration rises. As an example, Gesan Guisiou et al. 2002 [14] observed a rapid decrease of the critical flux with increasing concentration of suspensions of latex. From 0.4 to 2 g/l, critical flux values decreased from 140 to 47 l/h/m2. For higher concentrations the critical flux was almost constant at around 30 l/h/m2 for concentrations from 3 to 8 g/l. The same trend was observed for latex suspensions by Kwon et al. 2000 [20]. However the plotting of the permeate flux as a function of the logarithm of the concentration is not linear and so does not satisfy the film model. As a consequence neither the film nor the gel model can explain the mass accumulation. Variation of diffusion coefficient or viscosity (Aimar et al. [71]) and the presence of surface interaction Bacchin et al. [7] can be responsible for these discrepancies. As explained in earlier work (Field et al. [72]) a constant surface concentration is not to be expected. The effect of concentration in a complex suspension exhibited similar behaviour but sometimes with only slight decreases in critical flux with increasing concentration of bacterial cells in fermentation broth [17] or with activated sludge concentration [67] as illustrated with figure 16.
4.1.3 Suspension size
The effect of the particle size on the critical flux is difficult to determine experimentally as it is necessary, for an accurate analysis, to have particles with different size but the same surface properties. A study [20] was made with polystyrene latex particles of seven different sizes from 0.1 to 10 μm. Experimental determination of critical flux both based on the TMP increase for constant flux experiments and on a mass balance on particles in the retentate showed a minimum in the critical flux for particles size of about 0.2 μm (figure 3). The value of critical flux observed is superior for particles of 0.1 mm (fig. 4). This trend (minimum of critical flux for size around 100 nm) was found theoretically by Harmant et al. [73] and explained (fig. 17) by a coupling of different critical flux mechanisms of diffusion (higher for smaller particles) and surface interaction (higher for bigger particles). Such a minimum can also be related to the transition between the formation of gel layer (for small particles) and a deposit (for bigger
particles) [74]. Experiments made by Li et al.(2000) [25] for larger particles also showed an increase of critical flux with particle size. These results will be compared to back-transport mechanisms in the section dedicated to model analysis §5.
4.2. Effect of hydrodynamics on critical flux
Hydrodynamics at the membrane surface have a major influence on variations in critical flux values: an increase in the strength of the hydrodynamics being synonymous with a critical flux rise. Furthermore, the sensitivity of critical flux to hydrodynamic conditions can explain the distribution of critical fluxes (and then of fouling) along a membrane surface.
4.2.1 Hydrodynamic and global critical flux
Tangential flow at the membrane surface induces a variation of critical flux which has typically been expressed as a power law of the Reynolds number in numerous papers dealing with critical flux. Such a trend is found in all studies dealing with effect of the cross-flow velocity on critical flux but a common exponent for this power law can not be deduced from these works. It has to be noted that a large cross flow velocity can cause only a small increase in critical flux if the pressure drop along the membrane surface becomes significant [67]. For the same TMP, the transmembrane pressure at the inlet of the membrane surface when the velocity and hence feed-side pressure gradient are high is itself high. This leads to a local permeate flux which can be superior to the critical value and hence local fouling.
Experiments have also been made with different hydrodynamic promoters: cross rotational and vibratory shear enhanced processes (Al Akoum et al. 2002 [50], Huuhilo et al. 2001 [69]), gas sparging (Sur and Cui 2001 [49], Cabassud et al. 2001 [36], Chang and Fane 2000 [48], Bouhabila et al. 1998 [60]), washing period (Defrance and Jaffrin 1999 [12]), agitator-induced flushing (Ahn et al. [75]).
A critical ratio linking the permeate flux and the hydrodynamics has theoretically to be related to the mass transfer coefficient or boundary layer thickness [7], [76]. The critical ratio is then a critical Péclet number (Jδ/D). Gésan-Guisiou et al. [51] expressed their hydrodynamic criteria in terms of a
critical wall shear stress; the experimental results on ultrafiltration of skimmed milk showed a linear variation of critical flux and wall shear stress (figure 18). The slope of this line, which has been found to 0.95 l.h-1.m-2.Pa-1 for skimmed milk [51] and 18 l.h-1.m-2.Pa-1 for latex particles [14], represents a critical ratio independent of hydrodynamic conditions and only a function of suspension properties. The intercept with x-axis is interpreted as a critical erosion shear stress below which a critical flux does not exist for a given solution-membrane combination. These two last approaches using a critical Péclet number or a critical ratio “flux over wall shear stress” are convergent as the wall shear stress and boundary layer thickness can be theoretically linked through the Fanning friction factor.
4.2.2 Critical flux distribution along the membrane
Critical flux can be reached preferentially at certain points along a membrane surface. A distribution of fouling distribution along a membrane has already been discussed by different authors well before the critical flux concept was evolved (Gourgues et al. [77]) but can be interpreted by the critical flux concept. Experimental illustration of this behaviour has been observed during filtration near sub-critical flux showing an important distribution of deposited mass along the membrane surface during biomass filtration for a membrane without spacers (figure 19 from [62]) or during desalination by reverse osmosis with spacer filled channels (Schwinge et al. [78]).
Such a trend can be fully explained by a distribution of critical flux along the membrane surface which is theoretical explained by the fact the real critical number is not the critical flux but a critical Peclet number [7]. Indeed, the boundary layer thickness grows along the membrane leading to a decrease in mass transfer coefficient. So if one considers that there is a constant critical Peclet number then it follows that there is a decrease in critical flux from the membrane inlet to outlet. This distribution explains why a cake grows from the outlet where hydrodynamic conditions and then mass transfer coefficient are unfavourable to the inlet [74], [76]. Critical Peclet number can then be explained by the
trends illustrated by figure 19. These last results emphasize the role of a critical number Peclet to describe critical fouling conditions in tangential filtration. It has to be noted that recent models integrate the critical flux and its distribution along the membrane in submerged hollow fiber modules to optimise the fibre length and radius (Chang et al. [79]).
4.2.3 Analogy in dead end filtration
In the absence of tangential flow along the membrane (i.e. dead end filtration) a critical flux can not be observed if the critical factor is a critical wall shear stress. However, a critical filtered volume ([73], Bacchin et al. [80]) has been found for dead-end filtration of certain fluids. Indeed, for dead end filtration of a colloidal suspension, a deposit appears on the membrane only after a given filtered volume (the critical filtered volume). Such a concept presents the same phenomena with regard to the formation of an irreversible coagulated deposit as when, in cross-flow filtration, the critical flux for irreversibility is not exceeded. Thus for true colloidal suspensions there is a link to dead-end operation.
4.3. Effect of membrane properties on critical flux
Membrane properties such as porosity and pore size (or molecular weight cut-off) have been experimentally investigated in addition to the effect of the membrane materials properties (surface charge or hydrophilic effect).
4.3.1 Effect of membrane porosity and cut-off
The geometric structure of the membrane (porosity, cut-off, pore shape …) has been shown to be important for critical flux. Wu et al. [10] observed for a PES membrane a decrease of the critical flux when the membrane cut-off is increased (Table 4). As proposed by the authors, the change in critical flux could be the difference in surface properties (such as charge) but could also be the results of a change in local porosity and hence in local permeate velocity. The latter would modify locally the balance between drag force and surface interaction responsible for the critical flux. This effect might be particularly important for macromolecules. Recently during the ultrafiltration of colloidal latex suspension it was observed that the initial permeability of tubular ceramic membranes has little effect on the critical flux value [14]. However, experiments realised on a membrane pre-coated with an irreversible deposit induced an important decrease in critical flux.
Experiments have been recently performed on microsieves i.e. membrane with well-defined pore made by controlled etching. Bromley et al. [81] have shown five fold higher critical flux with slotted pores that with a circular pores. These last results clearly indicate the impact of the local structure at the membrane surface on the critical flux. Furthermore, other experiments with microsieves realised by Kuiper et al. [82] with circular pores but different porosity have shown that porosity can play an important role in the development of the cake layer at the membrane surface. For high porosity i.e. pore very close to each other, steric hindrance can occur between particles and prevented their deposition on the whole membrane surface. Even if critical flux is exceeded the deposit can not develop on the whole surface. Such a system might well have a critical flux for irreversibility, Jci, in excess of a conventional
critical flux Jcs or Jcw.
A membrane with a higher porosity will have a better distribution of the permeate flux on the porous surface (lower value for local maximum permeate flux) and should lead to an increased global (averaged over the whole surface) critical flux.
4.3.2 Effect of membrane materials
Huisman et al. [32] ran experiments on silica filtration using three membranes having the same cut-off but made with different membrane materials (titania, zirconia and α-alumina). No noticeable difference in the value of critical flux was observed even when membrane zeta potential was changed
from positive to negative. The effect of a membrane surface being hydrophobic or hydrophilic or even the effect of a membrane cleaning did not show consequences for the determination of critical flux [21]. The only difference noted in favour of hydrophilic membranes [22] can be explained by the fact that the hydrophilic membrane exhibited higher porosity which can be the cause of a higher value in critical flux (as detailed in the previous paragraph). Chan and Chen [42] emphasise this conclusion in a study focused on the pre-cake formation which showed evidence of the importance of membrane morphology for the limiting mechanisms only during sub-critical experiments. A time-lag for a first appearance of fouling resistance was introduced dependent on the kinetics of protein aggregation and aggregate deposition. Finally it has to be noted that the critical flux for irreversibility was defined as the permeate flux above which a multilayer fouling occurs (§ 2.3). Thus almost by definition membrane surface properties can have only little effect on the value of Jci.
4.4. Consequences of critical flux on process efficiency
4.4.1. Consequences on productivity
As already discussed above, critical flux is a concept of importance to optimise filtration productivity. Indeed, fouling leads to a loss of productivity. Fouling may only be reduced by the adoption (if applicable) of membrane back-washing adapted (additional cost and lost in energy and/or permeate production) or an increase in shear at membrane surface (additional energy cost due for example to increased cross-flow velocity). The possibility open by sub-critical operation is then very challenging. A lot of works cited above have shown results of filtration without fouling and hence no loss in productivity over a long period of time. One of the main applications of sub-critical operations is the filtration of bioreactors sludge which can work at low flux. Numerous publications have been made in this area. As an example, Gander et al. 2000 [65] report that there is evidence from MBRs to support the critical flux hypothesis as many submerged plate and frame plants run at a trans-membrane pressure inferior to 0.4 bar with no noticeable steady-state flux decline.
4.4.2. Consequences on selectivity
Some papers use the determination of a critical flux to improve the fractionation by avoiding an additional rejection due to a deposit on the membrane. Studies on membrane selectivity have soon been used to verify the concept of critical flux i.e. the presence of a deposit on the membrane surface. However, Chen et al. [18] who was expecting an increase of rejection above or below the critical flux, observed no variation in rejection have been observed in this paper whether the membrane was operated above or below the critical flux. They explain this trend by two concomitant phenomena: an increase in flux can both be responsible for a deposit and then an additional resistance to the solute transfer (increase in rejection) and the cause of the increase of solute concentration at the membrane (decrease in observed rejection). Gésan-Guisiou et al. 1999 [51] note an important increase in retention of both β-lactaglobulin and α-lactalbumin when operating at fluxes above the critical flux when filtering skimmed milk. These results were confirmed at different value of tangential flow and explained by authors as the consequences of an irreversible deposition of casein micelles, micro-organisms and entrapped or retained soluble proteins at the membrane surface. In 2002, Chan et al. [41] showed in a study combining fouling and selectivity determination during filtration of a solution of two proteins, a minimum of observed rejection in the smaller protein near the critical flux (Fig. 20) : the initial decrease of rejection with permeate flux could be explained by the increase of the membrane concentration and the following increase by the appearance of the deposit leading to an additional resistance for protein transfer. From these results, as underlined by Howell et al. 2002 [39], controlled flux operation can be a solution to operate high fractionation level with membrane processes by taking advantage of the fact that when the flux increases the rejection of high molecular weight decreases (because of the fouling layer) whilst that of lower molecular weight materials decreases (because of the polarisation concentration). Knowledge of critical flux concept seems to be essential to achieve high degree of separation with membrane processes.
5. Theoretical development and explanation
The cause for the existence of a critical flux are based on back transport mechanisms which can be surface interaction or hydrodynamic phenomena such as lateral migration or shear induced diffusion (figure 2 and 16). Lateral migration or shear induced diffusion have led to model development well before the appearance of the critical flux concept. The review of 1994 [5] has been complemented by Li et al. [25]. We will therefore focus our discussion of recent models on the effect of surface interaction during ultrafiltration which are well adapted to describing colloidal fouling.
5.1. Mass balance in a boundary layer
The first “modified film model”, as it was call by the authors, was developed by McDonogh et al. (1989) [4]. Surface interactions in the boundary layer are accounted for through the force of repulsion due to osmotic pressure caused by the accumulation of ions between charged planes. This model describes the gap between the film model due to surface interaction and allows one to calculate the rise of steady state flux induced by an increase of zeta potential. These results are compared to steady state flux measurements. The same approach was developed in 1995 by Buffham et al. [83] in a model where the boundary layer assumptions was avoided by using the modified film model with a Berman axial flow (Berman [84]) and a mass balance along the channel section. Although this work includes, the notion of a metastable equilibrium indicating whether particle deposition is more or less likely, the term “critical” is intentionally avoided. The authors cite the reason as being: “there does not appear to be a critical phenomenon in the sense that a very small change in permeation rate causes the concentration profile to change from one for which deposition would be most unlikely to one for which deposition is almost certain”. It has to be noted that this definition is now be used to depict a critical flux. In Bowen et al. [85], improvements are made in the way surface interaction act on mass transport: the effect of the surface interaction is taken into account through the variation of the collective diffusion coefficient accounting for multiple interactions between particles in a cell model Bowen et al. [86]. On the other hand, the osmotic pressure at the membrane surface is considered as a boundary condition of the problem avoiding a specific assumption for the wall concentration. However a parabolic concentration profile is imposed. This work does not put in light any critical phenomena. Jonsson et al. [87] in 1996 develop the same kind of model based on a depiction of the effect of surface interaction through a thermodynamic force due to the osmotic pressure gradient in a cell model accounting for multi-interactions. The model is developed in a boundary layer thickness and with a boundary condition based on the osmotic pressure at the membrane. The transition between polarisation concentration and deposit or gel on the membrane is explained as the consequence of the fact that the concentration at the membrane can reach a critical volume fraction for which the osmotic pressure has a maximum. The paper indicates that “the operating conditions under which the critical precipitation concentration (the gel or cake concentration) is reached can also be calculated” but no results were presented in this work. The same year BHATTACHARJEE ET AL. [88] included the effects of concentrated and interacting solutes in the convection-diffusion equation via a structure factor for interacting particles. This model allows then a realistic description of the behaviour of concentrated solutions near a membrane. However all calculations were made for volume fractions at the membrane too low to determine critical fouling conditions. More recently a modified film model with a two dimensional flow (Berman) was published byBacchin et al. [74]. The boundary condition was given by the osmotic pressure at the wall but a criteria for deposition was added giving a cake resistance when a critical osmotic pressure was reached. This model allows then the depicting of a critical flux and of the cake growing at the membrane surface (figure 21) and validates the more accurate concept of critical Peclet number [7], [76] (§5.3).
5.2. Force equilibrium and Lagrangian approaches
Also the fouling can be described through a mechanical approach based on a force balance on a particle (Lagrangian approach). Petsev et al. [89] published in 1993 a theoretical model based on a force equilibrium accounting for the surface interaction force acting on a particle in a body centred cubic or hexagonal geometry. The balance of this force with the permeate drag force in a dead end filtration law allows one to define the concentration profile above the membrane. A critical time is introduced to define the moment at which coagulation occurs on the membrane: “the hydrodynamic drag force, …, tends to compress the particle layer, so that again at a given moment coagulation can occur”. In 1994, Palecek et al. [90] developed a simplified equilibrium between the drag force on the proteins associated with the filtrate flow and the intermolecular repulsive interactions between the proteins in the bulk solution and those in the protein deposit on the surface of the membrane. This work was compared to experimental results of steady state flux obtained when filtering protein at pH's away from the isoelectric point. However, this model needs to have an assumption on the distance between the protein and the membrane to estimate the limiting permeate flux. Harmant et al. [91] [73] develop a model based on the construction of layers of particles during dead end filtration (Figure 17). These constructions respect the balance between convective, diffusive and surface interaction force estimated in a hexagonal geometry. It is shown that above a critical filtered volume the sum of the drag force exerted on the accumulated layer lead to the coagulation of the first layer on the membrane.
In 1999 Bowen et al. [92] and later [93] proposed a model with a finite element approach calculating the force between a spherical colloidal particle and a cylindrical membrane pore accounting for the hydrodynamic force (resulting from permeation but not that from cross flow) in 2 dimensions and for the surface interactions. They found that a potential barrier exists at the pore entrance preventing a particle from entering the pore. Critical values of pressure gradients across the membrane pore have then been calculated. Kim et al. [94] developed recently a similar modelling (small differences are in the pore geometry (slit-shaped pore versus cylindrical pore) and in the calculation procedures)) but accounting for Brownian diffusion. A “critical filtration velocity » (similar to the critical flux concept) is again defined (figure 22) when diffusion is not accounted. However, at this time, this kind of simulation is limited to one particle at a pore entrance; the effect of particle-particle interaction is not accounted.
5.3. Deposition rate modelling
Another kind of model is based on the writing of the total mass flux continuity (with convective, diffusive and interactive mass flux) and using a boundary condition of perfect sink on the solid surface (nil concentration at the interface). The basic assumption is that all particles arriving at the collector surface are irreversibly and quickly captured and disappear from the system. Such a boundary condition originally applied by Smoluchowski [95] to describe fast coagulation and later used for determination of the stability ratio by Verwey et al. [96] is often used to solve deposition problems (Adamczyk et al. [97]). These kind of models differ from models based upon steady state mass balance (§ 5.1), wherein the mass flux is nil, in the way they can describe the variation of the mass transfer (the deposition rate) versus operating conditions.
Such a model has been developed [7] to describe the deposition problem during ultrafiltration fouling. This approach allows determination of the operating conditions promoting deposition on the one hand and no fouling on the other. Operating conditions are described through a Peclet number combining in one expression the effect of permeate flux and cross flow velocity (through the boundary layer thickness) and in the second expression the stability of the suspension. A critical Peclet number is then defined to border the fouling and no fouling zones:
⎟ ⎠ ⎞ ⎜ ⎝ ⎛ = = δ δ B crit crit V D J Pe ln 0
where Jcrit is the critical flux, D0 the diffusivity at infinite dilution of the suspension, δ is the boundary
layer thickness for mass transfer induced by the cross flow velocity and VB the potential barrier due to
repulsive interaction which can be link to DLVO theory. This approach with boundary layer assumptions was developed by Song et al. [98] for a channel using a Bermann velocity profile. This paper underlines the important interplay between classical transport phenomena and interaction mechanisms but does not comment on critical phenomena for filtration.
5.4. Models analysis
These different studies have lead to important progress in the consideration of a new transport phenomenon to explain fouling in membrane processes: namely surface interaction. Today this has to be considered as important as molecular diffusion, shear induced diffusion and lateral migration. It is interesting to note that even very different modelling approaches (mass balance, force model or deposition rate) have lead to similar descriptions of critical conditions for filtration - the aggregation of the colloidal suspension at the membrane (Table 5). Physically, the critical flux can then be linked to the permeate flux and the respective drag force needed to overcome the repulsive barrier generated by interactions existing between colloidal particles. Above this critical value of the permeate flux, aggregation occurs in the suspension at the membrane surface leading to a multilayer deposit. The term critical has a scientific “semantic” significance here : critical is already used when surface interaction controls an aggregation phenomena – critical concentration for coagulation – [95] or for the critical deposition concentration Van de Ven [99] for the deposition kinetics on a collector. In these area, the term “critical” corresponds to the fact that the system shift from repulsive interaction between particles (dispersed matter - stable state) to attractive interaction (aggregate – unstable state) when a critical electrolyte concentration is added. In the same way, the critical flux represent the flux above which the accumulated mass at the membrane shift from repulsive interaction (dispersed matter - polarized layer) to attractive interaction (condensed matter - deposit) [100].
It has to be noted that the critical flux concept is sometimes used for larger particles (around 10 um) that are large relative to colloid suspensions. However, the mechanisms responsible for this phenomena are then essentially shear induced diffusion or lateral migration as predicted by comparison of the effect of various transport phenomena on the critical flux (fig. 4). When not processing colloidal suspensions the term “critical” loses a part of its significance.
Experimental results of critical flux observed by direct observation of mass accumulation through the membrane for latex particles and yeast cells (size superior to 3 μm) [25] were compared to calculation of shear induced diffusion and showed good agreement for larger particles (6 and 12 um). However for 3 μm, the experimental critical flux was well above the one calculated. This difference can be explained by surface interaction which can generate for colloidal suspension a higher flux than those calculated using classical models (diffusion, shear induced diffusion and lateral migration) as seen in fig. 2. These results confirm the fact that in moving from 1 to 10 μm the main phenomena for particle transport shifts from surface interactions to hydrodynamic causes.
The strength of the surface interaction models is their ability to explain the effect of suspensions properties such as pH or ionic strength which take a role in determining particle interaction and so control the formation of fouling layers. Critical operating conditions can then be theoretically deduced from physico-chemical properties of suspension. Their main weakness is the new degree of complexity and the inability to provide direct predictions (above all for complex fluids) from microscopic properties of the suspension (size, zeta, ionic strength…). One of the causes for this discrepancy can be that the theory on concentrated soft matter suspensions is not fully predictive.


![Figure 4. Forms of critical flux as originally defined by Field et al [8] Pure water Flux TMP Strong formWeak form](https://thumb-eu.123doks.com/thumbv2/123doknet/14425046.514035/33.892.153.750.222.599/figure-forms-critical-originally-defined-field-strong-formweak.webp)

![Figure 6. Flux-TMP profiles for lactic acid fermentation broth [16]](https://thumb-eu.123doks.com/thumbv2/123doknet/14425046.514035/35.892.143.812.299.530/figure-flux-tmp-profiles-lactic-acid-fermentation-broth.webp)
![Figure 7. Flux-TMP relationship for lactic acid fermentation broth with a ceramic MF membrane [17]](https://thumb-eu.123doks.com/thumbv2/123doknet/14425046.514035/36.892.213.681.199.865/figure-flux-relationship-lactic-fermentation-broth-ceramic-membrane.webp)


